Beaune Airbnb Market Analysis 2026: Short Term Rental Data & Vacation Rental Statistics in Bourgogne – Franche-Comté, France
Is Airbnb profitable in Beaune in 2026? Explore comprehensive Airbnb analytics for Beaune, Bourgogne – Franche-Comté, France to uncover income potential. This 2026 STR market report for Beaune, based on AirROI data from February 2025 to January 2026, reveals key trends in the market of 337 active listings.
Whether you're considering an Airbnb investment in Beaune, optimizing your existing vacation rental, or exploring rental arbitrage opportunities, understanding the Beaune Airbnb data is crucial. Navigating the high regulation landscape is key to maximizing your short term rental income potential. Let's dive into the specifics.
Key Beaune Airbnb Performance Metrics Overview
Monthly Airbnb Revenue Variations & Income Potential in Beaune (2026)
Understanding the monthly revenue variations for Airbnb listings in Beaune is key to maximizing your short term rental income potential. Seasonality significantly impacts earnings. Our analysis, based on data from the past 12 months, shows that the peak revenue month for STRs in Beaune is typically August, while February often presents the lowest earnings, highlighting opportunities for strategic pricing adjustments during shoulder and low seasons. Explore the typical Airbnb income in Beaune across different performance tiers:
- Best-in-class properties (Top 10%) achieve $5,666+ monthly, often utilizing dynamic pricing and superior guest experiences.
- Strong performing properties (Top 25%) earn $3,228 or more, indicating effective management and desirable locations/amenities.
- Typical properties (Median) generate around $1,933 per month, representing the average market performance.
- Entry-level properties (Bottom 25%) see earnings around $1,157, often with potential for optimization.
Average Monthly Airbnb Earnings Trend in Beaune
Beaune Airbnb Occupancy Rate Trends (2026)
Maximize your bookings by understanding the Beaune STR occupancy trends. Seasonal demand shifts significantly influence how often properties are booked. Typically, Augustsees the highest demand (peak season occupancy), while January experiences the lowest (low season). Effective strategies, like adjusting minimum stays or offering promotions, can boost occupancy during slower periods. Here's how different property tiers perform in Beaune:
- Best-in-class properties (Top 10%) achieve 80%+ occupancy, indicating high desirability and potentially optimized availability.
- Strong performing properties (Top 25%) maintain 65% or higher occupancy, suggesting good market fit and guest satisfaction.
- Typical properties (Median) have an occupancy rate around 46%.
- Entry-level properties (Bottom 25%) average 27% occupancy, potentially facing higher vacancy.
Average Monthly Occupancy Rate Trend in Beaune
Average Daily Rate (ADR) Airbnb Trends in Beaune (2026)
Effective short term rental pricing strategy in Beaune involves understanding monthly ADR fluctuations. The Average Daily Rate (ADR) for Airbnb in Beaune typically peaks in September and dips lowest during March. Leveraging Airbnb dynamic pricing tools or strategies based on this seasonality can significantly boost revenue. Here's a look at the typical nightly rates achieved:
- Best-in-class properties (Top 10%) command rates of $434+ per night, often due to premium features or locations.
- Strong performing properties (Top 25%) achieve nightly rates of $228 or more.
- Typical properties (Median) charge around $140 per night.
- Entry-level properties (Bottom 25%) earn around $100 per night.
Average Daily Rate (ADR) Trend by Month in Beaune
Get Live Beaune Market Intelligence 👇

Explore Real-time Analytics
Airbnb Seasonality Analysis & Trends in Beaune (2026)
Peak Season (August, July, September)
- Revenue averages $3,733 per month
- Occupancy rates average 58.5%
- Daily rates average $215
Shoulder Season
- Revenue averages $2,872 per month
- Occupancy maintains around 47.0%
- Daily rates hold near $210
Low Season (January, February, March)
- Revenue drops to average $1,572 per month
- Occupancy decreases to average 31.4%
- Daily rates adjust to average $196
Seasonality Insights for Beaune
- The Airbnb seasonality in Beaune shows highly seasonal trends requiring careful strategy. While the sections above show seasonal averages, it's also insightful to look at the extremes:
- During the high season, the absolute peak month showcases Beaune's highest earning potential, with monthly revenues capable of climbing to $3,989, occupancy reaching a high of 60.3%, and ADRs peaking at $221.
- Conversely, the slowest single month of the year, typically falling within the low season, marks the market's lowest point. In this month, revenue might dip to $1,450, occupancy could drop to 24.9%, and ADRs may adjust down to $189.
- Understanding both the seasonal averages and these monthly peaks and troughs in revenue, occupancy, and ADR is crucial for maximizing your Airbnb profit potential in Beaune.
Seasonal Strategies for Maximizing Profit
- Peak Season: Maximize revenue through premium pricing and potentially longer minimum stays. Ensure high availability.
- Low Season: Offer competitive pricing, special promotions (e.g., extended stay discounts), and flexible cancellation policies. Target off-season travelers like remote workers or budget-conscious guests.
- Shoulder Seasons: Implement dynamic pricing that balances peak and low rates. Target weekend travelers or specific events. Offer slightly more flexible terms than peak season.
- Regularly analyze your own performance against these Beaune seasonality benchmarks and adjust your pricing and availability strategy accordingly.
Best Areas for Airbnb Investment in Beaune (2026)
Exploring the top neighborhoods for short-term rentals in Beaune? This section highlights key areas, outlining why they are attractive for hosts and guests, along with notable local attractions. Consider these locations based on your target guest profile and investment strategy.
| Neighborhood / Area | Why Host Here? (Target Guests & Appeal) | Key Attractions & Landmarks |
|---|---|---|
| Historic Center | Beaune's historic center is charming and full of character, known for its beautiful architecture and rich history. It attracts tourists wanting to experience the local culture and cuisine. | Hôtel-Dieu, Burgundy Wine Museum, Beaune Market, Basilique Notre-Dame, Place de la Halle |
| Wine Route | The Wine Route is ideal for those who want to explore the famous Burgundy vineyards. This area attracts wine enthusiasts and offers stunning landscapes of vineyards. | Vineyard Tours, Wine Tastings, Château de Pommard, Clos de Vougeot, Domaine de la Romanée-Conti |
| La Bouzaize Park | A scenic park area that provides a relaxing atmosphere for families and nature lovers. It is popular for picnics and leisurely strolls, attracting visitors of all ages. | Bouzaise Lake, Playgrounds, Walking Trails, Botanical Gardens |
| Rue des Tonneliers | This lively street is known for its local shops, wine bars, and restaurants. It captures the essence of Beaune's vibrant food scene, making it appealing for culinary tourists. | Local Restaurants, Wine Shops, Gourmet Food Shops, Cafés |
| Porte Marie de Bourgogne | A historic entrance to Beaune that provides a sense of the city's past and architecture. It attracts tourists interested in history and stunning views. | Historical Gates, Views Over the City, Nearby Cafés |
| The Côte d'Or | This region surrounding Beaune is famous for its picturesque hillside vineyards and quaint villages, ideal for nature lovers and those seeking quiet retreats. | Charming Villages, Scenic Drives, Outdoor Activities |
| Place Carnot | A central square that hosts various events and markets, adding vibrancy to the city. It is a hub for locals and tourists alike, fostering community interaction. | Local Markets, Festivals, Cafés and Restaurants |
| Beaune Lac | Located slightly outside the city center, this area offers lake views and tranquility, attracting visitors looking for outdoor activities like cycling and hiking. | Beaune Lake, Cycling Paths, Nature Trails |
Understanding Airbnb License Requirements & STR Laws in Beaune (2026)
Yes, Beaune, Bourgogne – Franche-Comté, France enforces high STR regulations. Obtaining a license and ensuring compliance is almost certainly required according to current 2026 STR laws. Always verify the latest short term rental regulations and Airbnb license requirements directly with local government authorities for Beaune to ensure full compliance before hosting.
(Source: AirROI data, 2026, based on 89% licensed listings)
Top Performing Airbnb Properties in Beaune (2026)
Benchmark your potential! Explore examples of top-performing Airbnb properties in Beaunebased on Trailing Twelve Month (TTM) revenue. Analyze their characteristics, revenue, occupancy rate, and ADR to understand what drives success in this market.
LA TERRE D'OR Beaune - Les Tilleuls House
Entire Place • 5 bedrooms
Maison du Bastion Beaune city center 12 guests
Entire Place • 6 bedrooms

Elegant townhouse 6p in Burgundy region
Entire Place • 3 bedrooms
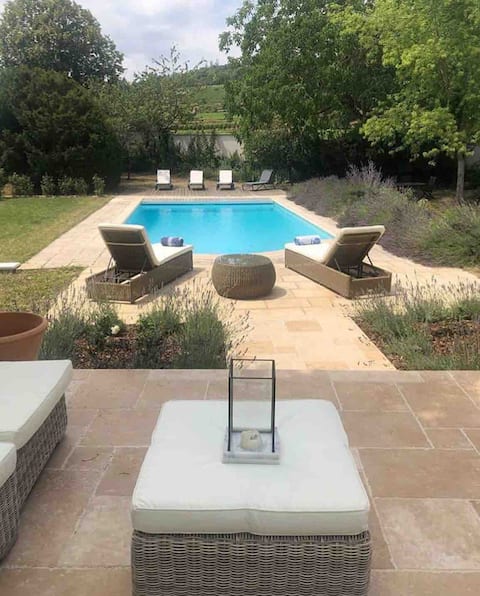
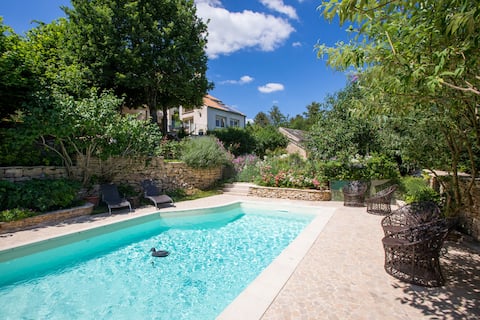
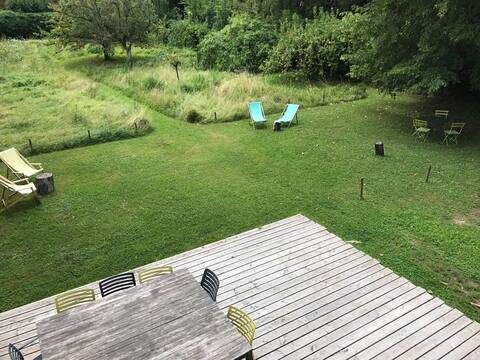
Fabulous house with pool, sleeps up to 8
Entire Place • 4 bedrooms
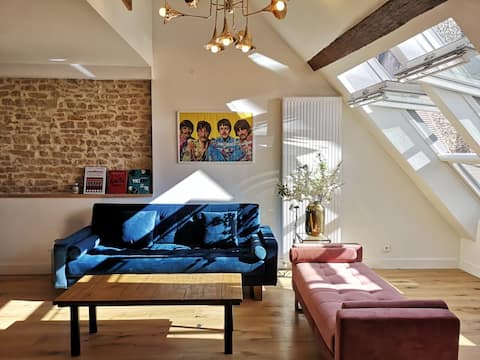
The white album - 190 m2 Beaune Centre Historique
Entire Place • 5 bedrooms

Beaune center: exceptional house
Entire Place • 3 bedrooms
Note: Performance varies based on location, size, amenities, seasonality, and management quality. Data reflects the past 12 months.
Top Performing Airbnb Hosts in Beaune (2026)
Learn from the best! This table showcases top-performing Airbnb hosts in Beaune based on the number of properties managed and estimated total revenue over the past year. Analyze their scale and performance metrics.
| Host Name | Properties | Grossing Revenue | Stay Reviews | Avg Rating |
|---|---|---|---|---|
| Allan | 20 | $505,085 | 1108 | 4.79/5.0 |
| Libbi | 6 | $289,337 | 540 | 4.88/5.0 |
| Vincent | 8 | $266,470 | 126 | 4.88/5.0 |
| Azad | 4 | $220,102 | 1913 | 4.70/5.0 |
| Dominique | 4 | $190,851 | 136 | 4.91/5.0 |
| Kevin Et Virginie | 4 | $183,877 | 3226 | 4.88/5.0 |
| Karima | 10 | $171,660 | 351 | 4.74/5.0 |
| Aurélie | 1 | $156,926 | 118 | 4.94/5.0 |
| OVO Network | 1 | $152,491 | 81 | 4.83/5.0 |
| Vincent | 2 | $138,063 | 43 | 5.00/5.0 |
Analyzing the strategies of top hosts, such as their property selection, pricing, and guest communication, can offer valuable lessons for optimizing your own Airbnb operations in Beaune.
Dive Deeper: Advanced Beaune STR Market Data (2026)
Ready to unlock more insights? AirROI provides access to advanced metrics and comprehensive Airbnb data for Beaune. Explore detailed analytics beyond this report to refine your investment strategy, optimize pricing, and maximize your vacation rental profits.
Explore Advanced MetricsBeaune Short-Term Rental Market Composition (2026): Property & Room Types
Room Type Distribution
Property Type Distribution
Market Composition Insights for Beaune
- The Beaune Airbnb market composition is heavily skewed towards Entire Home/Apt listings, which make up 89.6% of the 337 active rentals. This indicates strong guest preference for privacy and space.
- Looking at the property type distribution in Beaune, Apartment/Condo properties are the most common (63.5%), reflecting the local real estate landscape.
- Houses represent a significant 29.7% portion, catering likely to families or larger groups.
- The presence of 6.2% Hotel/Boutique listings indicates integration with traditional hospitality.
- Smaller segments like others (combined 0.6%) offer potential for unique stay experiences.
Beaune Airbnb Room Capacity Analysis (2026): Bedroom Distribution
Distribution of Listings by Number of Bedrooms
Room Capacity Insights for Beaune
- The dominant room capacity in Beaune is 1 bedroom listings, making up 43.6% of the market. This suggests a strong demand for properties suitable for couples or solo travelers.
- Together, 1 bedroom and 2 bedrooms properties represent 69.7% of the active Airbnb listings in Beaune, indicating a high concentration in these sizes.
Beaune Vacation Rental Guest Capacity Trends (2026)
Distribution of Listings by Guest Capacity
Guest Capacity Insights for Beaune
- The most common guest capacity trend in Beaune vacation rentals is listings accommodating 2 guests (32%). This suggests the primary traveler segment is likely couples or solo travelers.
- Properties designed for 2 guests and 4 guests dominate the Beaune STR market, accounting for 60.5% of listings.
- 25.0% of properties accommodate 6+ guests, serving the market segment for larger families or group travel in Beaune.
- On average, properties in Beaune are equipped to host 3.8 guests.
Beaune Airbnb Booking Patterns (2026): Available vs. Booked Days
Available Days Distribution
Booked Days Distribution
Booking Pattern Insights for Beaune
- The most common availability pattern in Beaune falls within the 181-270 days range, representing 38.9% of listings. This suggests many properties have significant open periods on their calendars.
- Approximately 68.0% of listings show high availability (181+ days open annually), indicating potential for increased bookings or specific owner usage patterns.
- For booked days, the 91-180 days range is most frequent in Beaune (38%), reflecting common guest stay durations or potential owner blocking patterns.
- A notable 34.1% of properties secure long booking periods (181+ days booked per year), highlighting successful long-term rental strategies or significant owner usage.
Beaune Airbnb Minimum Stay Requirements Analysis
Distribution of Listings by Minimum Night Requirement
1 Night
109 listings
32.3% of total
2 Nights
109 listings
32.3% of total
3 Nights
15 listings
4.5% of total
4-6 Nights
2 listings
0.6% of total
7-29 Nights
1 listings
0.3% of total
30+ Nights
101 listings
30% of total
Key Insights
- The most prevalent minimum stay requirement in Beaune is 1 Night, adopted by 32.3% of listings. This highlights the market's preference for shorter, flexible bookings.
- A strong majority (64.6%) of the Beaune Airbnb data shows acceptance of very short stays (1-2 nights), indicating a dynamic, high-turnover market.
- A significant segment (30%) caters to monthly stays (30+ nights) in Beaune, pointing to opportunities in the extended-stay market.
Recommendations
- Align with the market by considering a 1 Night minimum stay, as 32.3% of Beaune hosts use this setting.
- Explore offering discounts for stays of 30+ nights to attract the 30% of the market seeking extended stays.
- Adjust minimum nights based on seasonality – potentially shorter during low season and longer during peak demand periods in Beaune.
Beaune Airbnb Cancellation Policy Trends Analysis (2026)
Non-refundable
3 listings
0.9% of total
Refundable
5 listings
1.5% of total
Super Strict 60 Days
4 listings
1.2% of total
Limited
4 listings
1.2% of total
Flexible
72 listings
21.4% of total
Moderate
129 listings
38.3% of total
Firm
101 listings
30% of total
Strict
19 listings
5.6% of total
Cancellation Policy Insights for Beaune
- The prevailing Airbnb cancellation policy trend in Beaune is Moderate, used by 38.3% of listings.
- There's a relatively balanced mix between guest-friendly (59.7%) and stricter (35.6%) policies, offering choices for different guest needs.
- Strict cancellation policies are quite rare (5.6%), potentially making listings with this policy less competitive unless justified by high demand or property type.
Recommendations for Hosts
- Consider adopting a Moderate policy to align with the 38.3% market standard in Beaune.
- Using a Strict policy might deter some guests, as only 5.6% of listings use it. Evaluate if potential revenue protection outweighs possible lower booking rates.
- Regularly review your cancellation policy against competitors and market demand shifts in Beaune.
Beaune STR Booking Lead Time Analysis (2026)
Average Booking Lead Time by Month
Booking Lead Time Insights for Beaune
- The overall average booking lead time for vacation rentals in Beaune is 61 days.
- Guests book furthest in advance for stays during November (average 100 days), likely coinciding with peak travel demand or local events.
- The shortest booking windows occur for stays in February (average 29 days), indicating more last-minute travel plans during this time.
- Seasonally, Fall (74 days avg.) sees the longest lead times, while Winter (40 days avg.) has the shortest, reflecting typical travel planning cycles.
Recommendations for Hosts
- Use the overall average lead time (61 days) as a baseline for your pricing and availability strategy in Beaune.
- For November stays, consider implementing length-of-stay discounts or slightly higher rates for bookings made less than 100 days out to capitalize on advance planning.
- Target marketing efforts for the Fall season well in advance (at least 74 days) to capture early planners.
- Monitor your own booking lead times against these Beaune averages to identify opportunities for dynamic pricing adjustments.
Popular & Essential Airbnb Amenities in Beaune (2026)
Amenity Prevalence
Amenity Insights for Beaune
- Essential amenities in Beaune that guests expect include: Heating, Wifi. Lacking these (any) could significantly impact bookings.
- Popular amenities like Hair dryer, Essentials, Hot water are common but not universal. Offering these can provide a competitive edge.
Recommendations for Hosts
- Ensure your listing includes all essential amenities for Beaune: Heating, Wifi.
- Prioritize adding missing essentials: Heating, Wifi.
- Consider adding popular differentiators like Hair dryer or Essentials to increase appeal.
- Highlight unique or less common amenities you offer (e.g., hot tub, dedicated workspace, EV charger) in your listing description and photos.
- Regularly check competitor amenities in Beaune to stay competitive.
Beaune Airbnb Guest Demographics & Profile Analysis (2026)
Guest Profile Summary for Beaune
- The typical guest profile for Airbnb in Beaune consists of a mix of domestic (39%) and international guests, with top international origins including United States, typically belonging to the Post-2000s (Gen Z/Alpha) group (50%), primarily speaking English or French.
- Domestic travelers account for 39.1% of guests.
- Key international markets include France (39.1%) and United States (17.3%).
- Top languages spoken are English (41.4%) followed by French (27.2%).
- A significant demographic segment is the Post-2000s (Gen Z/Alpha) group, representing 50% of guests.
Recommendations for Hosts
- Focus marketing internationally, particularly towards travelers from United States.
- Tailor amenities and listing descriptions to appeal to the dominant Post-2000s (Gen Z/Alpha) demographic (e.g., highlight fast WiFi, smart home features, local guides).
- Highlight unique local experiences or amenities relevant to the primary guest profile.
- Consider seasonal promotions aligned with peak travel times for key origin markets.
Nearby Short-Term Rental Market Comparison
How does the Beaune Airbnb market stack up against its neighbors? Compare key performance metrics like average monthly revenue, ADR, and occupancy rates in surrounding areas to understand the broader regional STR landscape.
| Market | Active Properties | Monthly Revenue | Daily Rate | Avg. Occupancy |
|---|---|---|---|---|
| Épinac | 18 | $8,488 | $539.65 | 36% |
| Saint-Trivier-sur-Moignans | 10 | $3,748 | $311.34 | 37% |
| Bligny-lès-Beaune | 23 | $3,066 | $279.17 | 43% |
| Saint-Augustin | 17 | $2,985 | $313.19 | 35% |
| Juliénas | 17 | $2,882 | $244.93 | 43% |
| Puligny-Montrachet | 16 | $2,859 | $368.33 | 35% |
| Romanèche-Thorins | 13 | $2,790 | $292.42 | 38% |
| Rully | 21 | $2,775 | $211.98 | 39% |
| Verdelot | 14 | $2,758 | $319.99 | 36% |
| Saint-Romain | 17 | $2,647 | $326.60 | 36% |