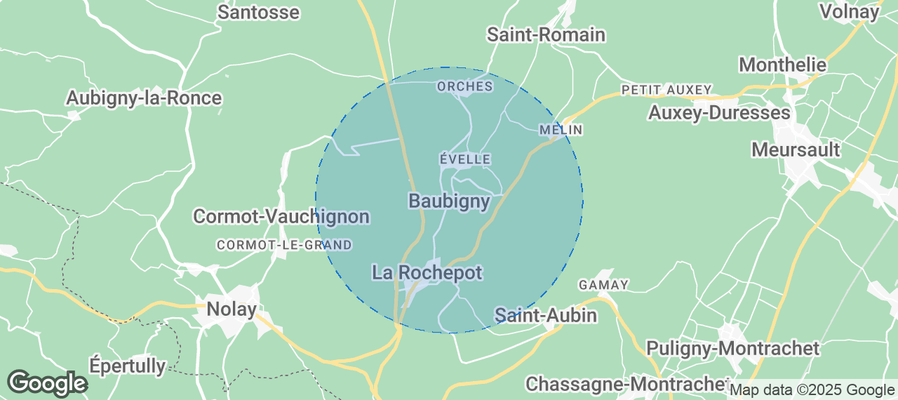
Baubigny Airbnb Market Analysis 2026: Short Term Rental Data & Vacation Rental Statistics in Bourgogne – Franche-Comté, France
Is Airbnb profitable in Baubigny in 2026? Explore comprehensive Airbnb analytics for Baubigny, Bourgogne – Franche-Comté, France to uncover income potential. This 2026 STR market report for Baubigny, based on AirROI data from February 2025 to January 2026, reveals key trends in the niche market of 21 active listings.
Whether you're considering an Airbnb investment in Baubigny, optimizing your existing vacation rental, or exploring rental arbitrage opportunities, understanding the Baubigny Airbnb data is crucial. Leveraging the low regulation environment is key to maximizing your short term rental income potential. Let's dive into the specifics.
Key Baubigny Airbnb Performance Metrics Overview
Monthly Airbnb Revenue Variations & Income Potential in Baubigny (2026)
Understanding the monthly revenue variations for Airbnb listings in Baubigny is key to maximizing your short term rental income potential. Seasonality significantly impacts earnings. Our analysis, based on data from the past 12 months, shows that the peak revenue month for STRs in Baubigny is typically August, while January often presents the lowest earnings, highlighting opportunities for strategic pricing adjustments during shoulder and low seasons. Explore the typical Airbnb income in Baubigny across different performance tiers:
- Best-in-class properties (Top 10%) achieve $3,769+ monthly, often utilizing dynamic pricing and superior guest experiences.
- Strong performing properties (Top 25%) earn $2,605 or more, indicating effective management and desirable locations/amenities.
- Typical properties (Median) generate around $1,486 per month, representing the average market performance.
- Entry-level properties (Bottom 25%) see earnings around $921, often with potential for optimization.
Average Monthly Airbnb Earnings Trend in Baubigny
Baubigny Airbnb Occupancy Rate Trends (2026)
Maximize your bookings by understanding the Baubigny STR occupancy trends. Seasonal demand shifts significantly influence how often properties are booked. Typically, Augustsees the highest demand (peak season occupancy), while January experiences the lowest (low season). Effective strategies, like adjusting minimum stays or offering promotions, can boost occupancy during slower periods. Here's how different property tiers perform in Baubigny:
- Best-in-class properties (Top 10%) achieve 69%+ occupancy, indicating high desirability and potentially optimized availability.
- Strong performing properties (Top 25%) maintain 56% or higher occupancy, suggesting good market fit and guest satisfaction.
- Typical properties (Median) have an occupancy rate around 33%.
- Entry-level properties (Bottom 25%) average 19% occupancy, potentially facing higher vacancy.
Average Monthly Occupancy Rate Trend in Baubigny
Average Daily Rate (ADR) Airbnb Trends in Baubigny (2026)
Effective short term rental pricing strategy in Baubigny involves understanding monthly ADR fluctuations. The Average Daily Rate (ADR) for Airbnb in Baubigny typically peaks in January and dips lowest during March. Leveraging Airbnb dynamic pricing tools or strategies based on this seasonality can significantly boost revenue. Here's a look at the typical nightly rates achieved:
- Best-in-class properties (Top 10%) command rates of $396+ per night, often due to premium features or locations.
- Strong performing properties (Top 25%) achieve nightly rates of $167 or more.
- Typical properties (Median) charge around $128 per night.
- Entry-level properties (Bottom 25%) earn around $105 per night.
Average Daily Rate (ADR) Trend by Month in Baubigny
Get Live Baubigny Market Intelligence 👇
Explore Real-time Analytics
Airbnb Seasonality Analysis & Trends in Baubigny (2026)
Peak Season (August, July, June)
- Revenue averages $3,031 per month
- Occupancy rates average 56.9%
- Daily rates average $185
Shoulder Season
- Revenue averages $1,859 per month
- Occupancy maintains around 36.9%
- Daily rates hold near $174
Low Season (January, February, December)
- Revenue drops to average $982 per month
- Occupancy decreases to average 18.7%
- Daily rates adjust to average $180
Seasonality Insights for Baubigny
- The Airbnb seasonality in Baubigny shows highly seasonal trends requiring careful strategy. While the sections above show seasonal averages, it's also insightful to look at the extremes:
- During the high season, the absolute peak month showcases Baubigny's highest earning potential, with monthly revenues capable of climbing to $3,553, occupancy reaching a high of 71.1%, and ADRs peaking at $194.
- Conversely, the slowest single month of the year, typically falling within the low season, marks the market's lowest point. In this month, revenue might dip to $804, occupancy could drop to 14.7%, and ADRs may adjust down to $169.
- Understanding both the seasonal averages and these monthly peaks and troughs in revenue, occupancy, and ADR is crucial for maximizing your Airbnb profit potential in Baubigny.
Seasonal Strategies for Maximizing Profit
- Peak Season: Maximize revenue through premium pricing and potentially longer minimum stays. Ensure high availability.
- Low Season: Offer competitive pricing, special promotions (e.g., extended stay discounts), and flexible cancellation policies. Target off-season travelers like remote workers or budget-conscious guests.
- Shoulder Seasons: Implement dynamic pricing that balances peak and low rates. Target weekend travelers or specific events. Offer slightly more flexible terms than peak season.
- Regularly analyze your own performance against these Baubigny seasonality benchmarks and adjust your pricing and availability strategy accordingly.
Best Areas for Airbnb Investment in Baubigny (2026)
Exploring the top neighborhoods for short-term rentals in Baubigny? This section highlights key areas, outlining why they are attractive for hosts and guests, along with notable local attractions. Consider these locations based on your target guest profile and investment strategy.
| Neighborhood / Area | Why Host Here? (Target Guests & Appeal) | Key Attractions & Landmarks |
|---|---|---|
| Baubigny Village Center | Charming village with historical architecture and proximity to local amenities. Great for guests looking for a peaceful rural escape while still being close to essential services. | Local Market, Historic Church, Nearby Hiking Trails, Scenic Vineyards |
| Beaune | Known as the Wine Capital of Burgundy, Beaune attracts tourists with its rich history and wine culture. Ideal location for wine lovers and culture enthusiasts. | Hôtel-Dieu, Beaune Wine Museum, Les Grands Jours de Bourgogne, Local Wine Tastings, Historic City Walls |
| Dijon | As the capital of Burgundy, Dijon offers rich history, gastronomy, and culture. A vibrant city that attracts both tourists and business travelers. | Dijon Palace, Musée des Beaux-Arts, Culinary Schools, Les Halles Market, Historical City Centre |
| Chalon-sur-Saône | A beautiful city on the Saône River, famous for its history and art scene. Good for river tourism and cultural experiences. | Chalon Cathedral, National Photography Museum, Riverwalk, Local Art Galleries, Historical Monuments |
| Macon | Known for its picturesque setting along the Saône River and vineyards. Appeals to tourists interested in wine and scenic views. | Saint Vincent Cathedral, Mâcon Arts Museum, Local Wine Estates, River Cruises, Cultural Festivals |
| Tournus | A historic town known for its Abbey and good access to Burgundy's wine routes. Attracts religious tourists and wine lovers. | Saint Philibert Abbey, River Saône Views, Historical Sites, Wine Route Access, Culinary Experiences |
| Nuits-Saint-Georges | Famous for its wine production, particularly red wines, making it a popular destination among wine enthusiasts. | Vineyard Tours, Local Wineries, Wine Festivals, Culinary Delights, Scenic Vineyards |
| Santenay | A beautiful commune known for its wine and thermal spa. A tranquil retreat for relaxation and wine tourism. | Thermal Spas, Local Vineyards, Wine Tasting Events, Nature Trails, Charming Village Streets |
Understanding Airbnb License Requirements & STR Laws in Baubigny (2026)
While Baubigny, Bourgogne – Franche-Comté, France currently shows low STR regulations, specific Airbnb license requirements might still exist or change. Always verify the latest short term rental regulations and Airbnb license requirements directly with local government authorities for Baubigny to ensure full compliance before hosting.
(Source: AirROI data, 2026, based on 5% licensed listings)
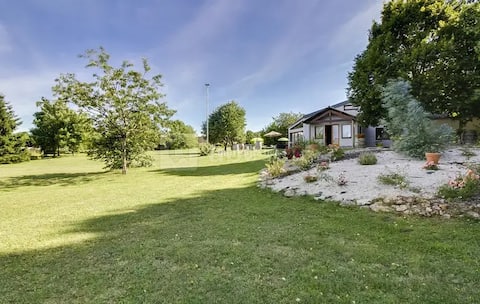
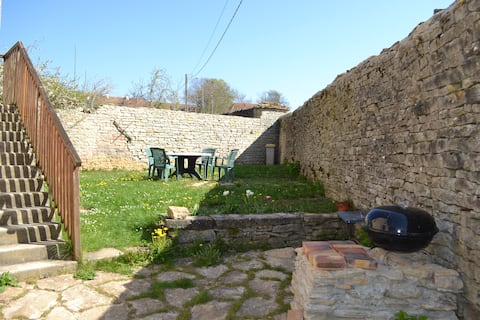
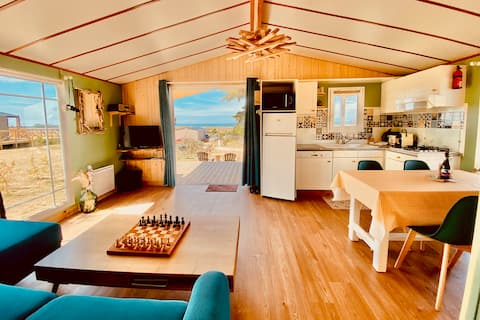
Top Performing Airbnb Properties in Baubigny (2026)
Benchmark your potential! Explore examples of top-performing Airbnb properties in Baubignybased on Trailing Twelve Month (TTM) revenue. Analyze their characteristics, revenue, occupancy rate, and ADR to understand what drives success in this market.
Cottage with many beds
Entire Place • 9 bedrooms
Evelle Orches Beaune Nolay Burgundy
Entire Place • 3 bedrooms
The Cabane de Baubigny.
Entire Place • 2 bedrooms
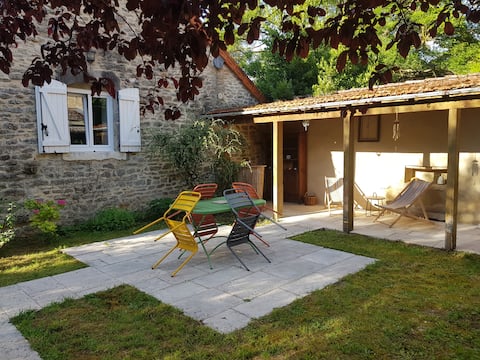
Enclosed garden house & fireplace in a quiet area near Beaune
Entire Place • 2 bedrooms
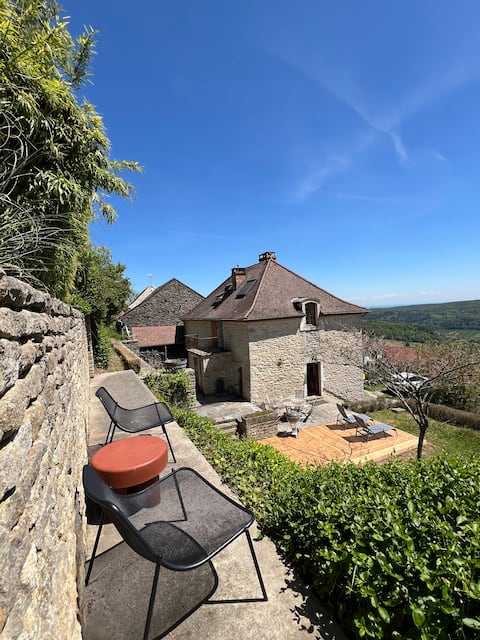
Cliffside House
Entire Place • 2 bedrooms
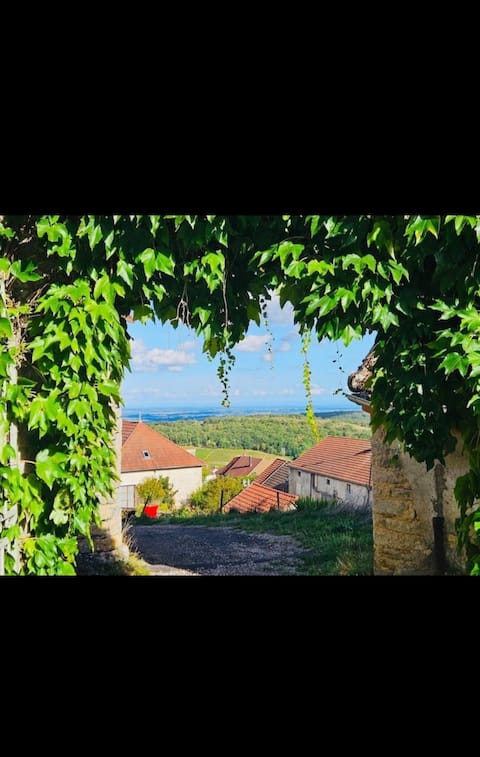
Charming property, view of the vineyards
Entire Place • 5 bedrooms
Note: Performance varies based on location, size, amenities, seasonality, and management quality. Data reflects the past 12 months.
Top Performing Airbnb Hosts in Baubigny (2026)
Learn from the best! This table showcases top-performing Airbnb hosts in Baubigny based on the number of properties managed and estimated total revenue over the past year. Analyze their scale and performance metrics.
| Host Name | Properties | Grossing Revenue | Stay Reviews | Avg Rating |
|---|---|---|---|---|
| Philippe | 4 | $65,770 | 43 | 4.89/5.0 |
| Damien | 1 | $55,230 | 4 | 5.00/5.0 |
| Jacqueline | 1 | $29,039 | 83 | 4.96/5.0 |
| Nicolas | 1 | $28,314 | 80 | 4.95/5.0 |
| ÉmilietSylvain | 1 | $25,524 | 60 | 4.88/5.0 |
| Natalia | 1 | $25,518 | 28 | 4.79/5.0 |
| Pascal Nicolas | 1 | $20,469 | 10 | 5.00/5.0 |
| Michel | 1 | $19,968 | 34 | 4.97/5.0 |
| Anne | 1 | $18,496 | 223 | 4.82/5.0 |
| Aline | 1 | $18,290 | 20 | 4.90/5.0 |
Analyzing the strategies of top hosts, such as their property selection, pricing, and guest communication, can offer valuable lessons for optimizing your own Airbnb operations in Baubigny.
Dive Deeper: Advanced Baubigny STR Market Data (2026)
Ready to unlock more insights? AirROI provides access to advanced metrics and comprehensive Airbnb data for Baubigny. Explore detailed analytics beyond this report to refine your investment strategy, optimize pricing, and maximize your vacation rental profits.
Explore Advanced MetricsBaubigny Short-Term Rental Market Composition (2026): Property & Room Types
Room Type Distribution
Property Type Distribution
Market Composition Insights for Baubigny
- The Baubigny Airbnb market composition is heavily skewed towards Entire Home/Apt listings, which make up 95.2% of the 21 active rentals. This indicates strong guest preference for privacy and space.
- Looking at the property type distribution in Baubigny, House properties are the most common (85.7%), reflecting the local real estate landscape.
- Houses represent a significant 85.7% portion, catering likely to families or larger groups.
- The presence of 9.5% Hotel/Boutique listings indicates integration with traditional hospitality.
- Smaller segments like outdoor/unique (combined 4.8%) offer potential for unique stay experiences.
Baubigny Airbnb Room Capacity Analysis (2026): Bedroom Distribution
Distribution of Listings by Number of Bedrooms
Room Capacity Insights for Baubigny
- The dominant room capacity in Baubigny is 2 bedrooms listings, making up 42.9% of the market. This suggests a strong demand for properties suitable for couples or solo travelers.
- Together, 2 bedrooms and 1 bedroom properties represent 61.9% of the active Airbnb listings in Baubigny, indicating a high concentration in these sizes.
- A significant 33.3% of listings offer 3+ bedrooms, catering to larger groups and families seeking more space in Baubigny.
Baubigny Vacation Rental Guest Capacity Trends (2026)
Distribution of Listings by Guest Capacity
Guest Capacity Insights for Baubigny
- The most common guest capacity trend in Baubigny vacation rentals is listings accommodating 4 guests (38.1%). This suggests the primary traveler segment is likely small families or groups.
- Properties designed for 4 guests and 6 guests dominate the Baubigny STR market, accounting for 66.7% of listings.
- 42.9% of properties accommodate 6+ guests, serving the market segment for larger families or group travel in Baubigny.
- On average, properties in Baubigny are equipped to host 4.8 guests.
Baubigny Airbnb Booking Patterns (2026): Available vs. Booked Days
Available Days Distribution
Booked Days Distribution
Booking Pattern Insights for Baubigny
- The most common availability pattern in Baubigny falls within the 271-366 days range, representing 52.4% of listings. This suggests many properties have significant open periods on their calendars.
- Approximately 85.7% of listings show high availability (181+ days open annually), indicating potential for increased bookings or specific owner usage patterns.
- For booked days, the 91-180 days range is most frequent in Baubigny (42.9%), reflecting common guest stay durations or potential owner blocking patterns.
- A notable 14.3% of properties secure long booking periods (181+ days booked per year), highlighting successful long-term rental strategies or significant owner usage.
Baubigny Airbnb Minimum Stay Requirements Analysis
Distribution of Listings by Minimum Night Requirement
1 Night
4 listings
19% of total
2 Nights
5 listings
23.8% of total
3 Nights
2 listings
9.5% of total
4-6 Nights
3 listings
14.3% of total
30+ Nights
7 listings
33.3% of total
Key Insights
- The most prevalent minimum stay requirement in Baubigny is 30+ Nights, adopted by 33.3% of listings. This highlights the market's preference for longer commitments.
- A significant segment (33.3%) caters to monthly stays (30+ nights) in Baubigny, pointing to opportunities in the extended-stay market.
Recommendations
- Align with the market by considering a 30+ Nights minimum stay, as 33.3% of Baubigny hosts use this setting.
- If feasible, allowing 1-night stays, especially midweek or during low season, could capture last-minute bookings, as only 19% currently do.
- Explore offering discounts for stays of 30+ nights to attract the 33.3% of the market seeking extended stays.
- Adjust minimum nights based on seasonality – potentially shorter during low season and longer during peak demand periods in Baubigny.
Baubigny Airbnb Cancellation Policy Trends Analysis (2026)
Refundable
1 listings
4.8% of total
Flexible
5 listings
23.8% of total
Moderate
5 listings
23.8% of total
Firm
9 listings
42.9% of total
Strict
1 listings
4.8% of total
Cancellation Policy Insights for Baubigny
- The prevailing Airbnb cancellation policy trend in Baubigny is Firm, used by 42.9% of listings.
- There's a relatively balanced mix between guest-friendly (47.6%) and stricter (47.7%) policies, offering choices for different guest needs.
- Strict cancellation policies are quite rare (4.8%), potentially making listings with this policy less competitive unless justified by high demand or property type.
Recommendations for Hosts
- Consider adopting a Firm policy to align with the 42.9% market standard in Baubigny.
- Using a Strict policy might deter some guests, as only 4.8% of listings use it. Evaluate if potential revenue protection outweighs possible lower booking rates.
- Regularly review your cancellation policy against competitors and market demand shifts in Baubigny.
Baubigny STR Booking Lead Time Analysis (2026)
Average Booking Lead Time by Month
Booking Lead Time Insights for Baubigny
- The overall average booking lead time for vacation rentals in Baubigny is 68 days.
- Guests book furthest in advance for stays during February (average 111 days), likely coinciding with peak travel demand or local events.
- The shortest booking windows occur for stays in October (average 44 days), indicating more last-minute travel plans during this time.
- Seasonally, Summer (78 days avg.) sees the longest lead times, while Spring (64 days avg.) has the shortest, reflecting typical travel planning cycles.
Recommendations for Hosts
- Use the overall average lead time (68 days) as a baseline for your pricing and availability strategy in Baubigny.
- For February stays, consider implementing length-of-stay discounts or slightly higher rates for bookings made less than 111 days out to capitalize on advance planning.
- Target marketing efforts for the Summer season well in advance (at least 78 days) to capture early planners.
- Monitor your own booking lead times against these Baubigny averages to identify opportunities for dynamic pricing adjustments.
Popular & Essential Airbnb Amenities in Baubigny (2026)
Amenity Prevalence
Amenity Insights for Baubigny
- Essential amenities in Baubigny that guests expect include: Kitchen. Lacking these (this) could significantly impact bookings.
- Popular amenities like Coffee maker, Heating, Free parking on premises are common but not universal. Offering these can provide a competitive edge.
- Warning: Wifi is not universally provided but is considered essential globally. Ensure reliable Wifi is offered.
Recommendations for Hosts
- Ensure your listing includes all essential amenities for Baubigny: Kitchen.
- Prioritize adding missing essentials: Kitchen.
- Consider adding popular differentiators like Coffee maker or Heating to increase appeal.
- Highlight unique or less common amenities you offer (e.g., hot tub, dedicated workspace, EV charger) in your listing description and photos.
- Regularly check competitor amenities in Baubigny to stay competitive.
Baubigny Airbnb Guest Demographics & Profile Analysis (2026)
Guest Profile Summary for Baubigny
- The typical guest profile for Airbnb in Baubigny consists of primarily domestic travelers (70%), often arriving from nearby Paris, typically belonging to the Post-2000s (Gen Z/Alpha) group (50%), primarily speaking English or French.
- Domestic travelers account for 70.2% of guests.
- Key international markets include France (70.2%) and Belgium (8.5%).
- Top languages spoken are English (36.8%) followed by French (33.7%).
- A significant demographic segment is the Post-2000s (Gen Z/Alpha) group, representing 50% of guests.
Recommendations for Hosts
- Target domestic marketing efforts towards travelers from Paris and Lyon.
- Tailor amenities and listing descriptions to appeal to the dominant Post-2000s (Gen Z/Alpha) demographic (e.g., highlight fast WiFi, smart home features, local guides).
- Highlight unique local experiences or amenities relevant to the primary guest profile.
- Consider seasonal promotions aligned with peak travel times for key origin markets.
Nearby Short-Term Rental Market Comparison
How does the Baubigny Airbnb market stack up against its neighbors? Compare key performance metrics like average monthly revenue, ADR, and occupancy rates in surrounding areas to understand the broader regional STR landscape.
| Market | Active Properties | Monthly Revenue | Daily Rate | Avg. Occupancy |
|---|---|---|---|---|
| Égreville | 12 | $4,969 | $447.83 | 40% |
| La Couture-Boussey | 11 | $4,086 | $464.04 | 28% |
| Menetou-Râtel | 10 | $3,844 | $353.11 | 34% |
| Achères-la-Forêt | 35 | $3,136 | $348.74 | 44% |
| Mesnils-sur-Iton | 24 | $3,099 | $348.65 | 41% |
| Paris | 39,295 | $3,085 | $257.47 | 52% |
| Maslives | 17 | $2,994 | $317.61 | 39% |
| Saint-Augustin | 17 | $2,985 | $313.19 | 35% |
| Verdelot | 14 | $2,758 | $319.99 | 36% |
| Saint-Martin-en-Bière | 14 | $2,745 | $247.02 | 49% |