Vienne Airbnb Market Analysis 2026: Short Term Rental Data & Vacation Rental Statistics in Auvergne-Rhône-Alpes, France
Is Airbnb profitable in Vienne in 2026? Explore comprehensive Airbnb analytics for Vienne, Auvergne-Rhône-Alpes, France to uncover income potential. This 2026 STR market report for Vienne, based on AirROI data from February 2025 to January 2026, reveals key trends in the market of 248 active listings.
Whether you're considering an Airbnb investment in Vienne, optimizing your existing vacation rental, or exploring rental arbitrage opportunities, understanding the Vienne Airbnb data is crucial. Leveraging the low regulation environment is key to maximizing your short term rental income potential. Let's dive into the specifics.
Key Vienne Airbnb Performance Metrics Overview
Monthly Airbnb Revenue Variations & Income Potential in Vienne (2026)
Understanding the monthly revenue variations for Airbnb listings in Vienne is key to maximizing your short term rental income potential. Seasonality significantly impacts earnings. Our analysis, based on data from the past 12 months, shows that the peak revenue month for STRs in Vienne is typically July, while January often presents the lowest earnings, highlighting opportunities for strategic pricing adjustments during shoulder and low seasons. Explore the typical Airbnb income in Vienne across different performance tiers:
- Best-in-class properties (Top 10%) achieve $2,267+ monthly, often utilizing dynamic pricing and superior guest experiences.
- Strong performing properties (Top 25%) earn $1,553 or more, indicating effective management and desirable locations/amenities.
- Typical properties (Median) generate around $942 per month, representing the average market performance.
- Entry-level properties (Bottom 25%) see earnings around $492, often with potential for optimization.
Average Monthly Airbnb Earnings Trend in Vienne
Vienne Airbnb Occupancy Rate Trends (2026)
Maximize your bookings by understanding the Vienne STR occupancy trends. Seasonal demand shifts significantly influence how often properties are booked. Typically, Julysees the highest demand (peak season occupancy), while January experiences the lowest (low season). Effective strategies, like adjusting minimum stays or offering promotions, can boost occupancy during slower periods. Here's how different property tiers perform in Vienne:
- Best-in-class properties (Top 10%) achieve 73%+ occupancy, indicating high desirability and potentially optimized availability.
- Strong performing properties (Top 25%) maintain 55% or higher occupancy, suggesting good market fit and guest satisfaction.
- Typical properties (Median) have an occupancy rate around 35%.
- Entry-level properties (Bottom 25%) average 18% occupancy, potentially facing higher vacancy.
Average Monthly Occupancy Rate Trend in Vienne
Average Daily Rate (ADR) Airbnb Trends in Vienne (2026)
Effective short term rental pricing strategy in Vienne involves understanding monthly ADR fluctuations. The Average Daily Rate (ADR) for Airbnb in Vienne typically peaks in July and dips lowest during March. Leveraging Airbnb dynamic pricing tools or strategies based on this seasonality can significantly boost revenue. Here's a look at the typical nightly rates achieved:
- Best-in-class properties (Top 10%) command rates of $171+ per night, often due to premium features or locations.
- Strong performing properties (Top 25%) achieve nightly rates of $116 or more.
- Typical properties (Median) charge around $86 per night.
- Entry-level properties (Bottom 25%) earn around $63 per night.
Average Daily Rate (ADR) Trend by Month in Vienne
Get Live Vienne Market Intelligence 👇

Explore Real-time Analytics
Airbnb Seasonality Analysis & Trends in Vienne (2026)
Peak Season (July, August, June)
- Revenue averages $1,553 per month
- Occupancy rates average 43.3%
- Daily rates average $107
Shoulder Season
- Revenue averages $1,129 per month
- Occupancy maintains around 37.3%
- Daily rates hold near $104
Low Season (January, February, March)
- Revenue drops to average $918 per month
- Occupancy decreases to average 34.7%
- Daily rates adjust to average $97
Seasonality Insights for Vienne
- The Airbnb seasonality in Vienne shows highly seasonal trends requiring careful strategy. While the sections above show seasonal averages, it's also insightful to look at the extremes:
- During the high season, the absolute peak month showcases Vienne's highest earning potential, with monthly revenues capable of climbing to $1,731, occupancy reaching a high of 46.9%, and ADRs peaking at $109.
- Conversely, the slowest single month of the year, typically falling within the low season, marks the market's lowest point. In this month, revenue might dip to $865, occupancy could drop to 26.7%, and ADRs may adjust down to $92.
- Understanding both the seasonal averages and these monthly peaks and troughs in revenue, occupancy, and ADR is crucial for maximizing your Airbnb profit potential in Vienne.
Seasonal Strategies for Maximizing Profit
- Peak Season: Maximize revenue through premium pricing and potentially longer minimum stays. Ensure high availability.
- Low Season: Offer competitive pricing, special promotions (e.g., extended stay discounts), and flexible cancellation policies. Target off-season travelers like remote workers or budget-conscious guests.
- Shoulder Seasons: Implement dynamic pricing that balances peak and low rates. Target weekend travelers or specific events. Offer slightly more flexible terms than peak season.
- Regularly analyze your own performance against these Vienne seasonality benchmarks and adjust your pricing and availability strategy accordingly.
Best Areas for Airbnb Investment in Vienne (2026)
Exploring the top neighborhoods for short-term rentals in Vienne? This section highlights key areas, outlining why they are attractive for hosts and guests, along with notable local attractions. Consider these locations based on your target guest profile and investment strategy.
| Neighborhood / Area | Why Host Here? (Target Guests & Appeal) | Key Attractions & Landmarks |
|---|---|---|
| Historic Vienne | A charming town with rich Roman history and well-preserved ruins, perfect for tourists interested in culture and history. The town hosts several festivals throughout the year, making it lively and attractive. | Roman Theater, Saint-Maurice Cathedral, Vienne Jazz Festival, Chateau de la Batie, Temple d'Auguste et de Livie |
| Le Parc des Oiseaux | Located in nearby Villars-les-Dombes, this park is a major attraction for families and nature lovers. Offering a unique experience with exotic birds, it draws many visitors and can benefit short-term rentals. | Bird Show, Themed Gardens, Play Areas for Kids, Walking Trails |
| Musée des Beaux-Arts et d'Archéologie | This museum holds extensive collections of art and archaeology, attracting art enthusiasts and families who visit Vienne to soak in local culture and history. | Fine Arts Collection, Archaeological Exhibits, Cultural Events, Guided Tours |
| Château de la Roche | This stunning castle in the region offers a glimpse into the area's feudal past and is surrounded by beautiful nature, attracting tourists seeking both history and outdoor activities. | Guided Castle Tours, Nature Trails, Picnic Areas |
| Coteaux du Lyonnais | This rural area surrounding Vienne is famous for its beautiful vineyards and wines, drawing wine lovers and nature enthusiasts looking for a tranquil retreat close to the city. | Wine Tours, Vineyard Walks, Local Wine Tastings, Bicycle Tours |
| Vienne's City Center | The heart of the town is vibrant with shops and restaurants, making it a prime location for tourists wanting to explore local cuisine and shopping. It's also the best spot for nightlife and events. | Shops and Boutiques, Local Restaurants, Nightlife Venues, Cafes |
| Roman Ruins | Explore the Roman legacy of Vienne with famous ruins that attract visitors interested in ancient history, architecture, and photography opportunities. | Temple of Augustus, Roman Amphitheater, Excavation Sites, Historical Tours |
| Isle de la Serre | This natural area is ideal for those looking to enjoy outdoor activities, including hiking and cycling, attracting nature enthusiasts and families looking for day trips. | Nature Trails, Picnic Areas, Fishing Spots, Kayaking |
Understanding Airbnb License Requirements & STR Laws in Vienne (2026)
While Vienne, Auvergne-Rhône-Alpes, France currently shows low STR regulations, specific Airbnb license requirements might still exist or change. Always verify the latest short term rental regulations and Airbnb license requirements directly with local government authorities for Vienne to ensure full compliance before hosting.
(Source: AirROI data, 2026, based on 4% licensed listings)
Top Performing Airbnb Properties in Vienne (2026)
Benchmark your potential! Explore examples of top-performing Airbnb properties in Viennebased on Trailing Twelve Month (TTM) revenue. Analyze their characteristics, revenue, occupancy rate, and ADR to understand what drives success in this market.
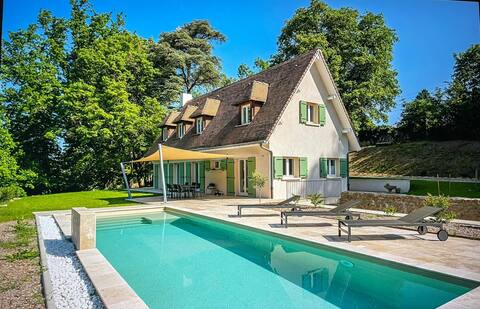
Charming Property with Pool
Entire Place • 4 bedrooms
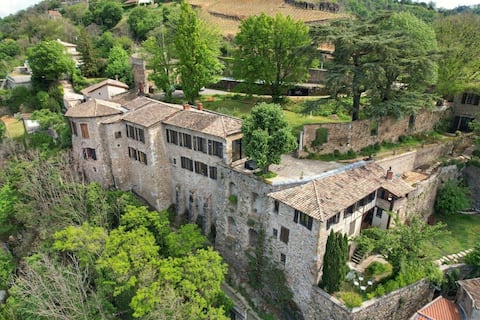
La Bâtie – La Loge
Entire Place • 1 bedroom

La Bâtie - La Tour
Entire Place • 1 bedroom

Movie theater & Hot tub
Entire Place • 1 bedroom

Very nice bright apartment in quiet 3 bedrooms
Entire Place • 3 bedrooms

*La Bulle Noire* Charming Suite & Balneo
Entire Place • 1 bedroom
Note: Performance varies based on location, size, amenities, seasonality, and management quality. Data reflects the past 12 months.
Top Performing Airbnb Hosts in Vienne (2026)
Learn from the best! This table showcases top-performing Airbnb hosts in Vienne based on the number of properties managed and estimated total revenue over the past year. Analyze their scale and performance metrics.
| Host Name | Properties | Grossing Revenue | Stay Reviews | Avg Rating |
|---|---|---|---|---|
| Marie-Alice | 11 | $165,373 | 367 | 4.89/5.0 |
| Maxime | 6 | $118,147 | 321 | 4.83/5.0 |
| William | 8 | $101,262 | 632 | 4.65/5.0 |
| La Bâtie | 2 | $85,134 | 222 | 4.97/5.0 |
| Nassim | 5 | $70,236 | 305 | 4.80/5.0 |
| Loic | 1 | $67,454 | 70 | 5.00/5.0 |
| Maj | 5 | $61,492 | 381 | 4.88/5.0 |
| Suites Jacuzzi | 3 | $57,278 | 180 | 4.84/5.0 |
| Lina | 3 | $53,863 | 417 | 4.86/5.0 |
| Xiao-Phie & Boris | 3 | $46,200 | 371 | 4.93/5.0 |
Analyzing the strategies of top hosts, such as their property selection, pricing, and guest communication, can offer valuable lessons for optimizing your own Airbnb operations in Vienne.
Dive Deeper: Advanced Vienne STR Market Data (2026)
Ready to unlock more insights? AirROI provides access to advanced metrics and comprehensive Airbnb data for Vienne. Explore detailed analytics beyond this report to refine your investment strategy, optimize pricing, and maximize your vacation rental profits.
Explore Advanced MetricsVienne Short-Term Rental Market Composition (2026): Property & Room Types
Room Type Distribution
Property Type Distribution
Market Composition Insights for Vienne
- The Vienne Airbnb market composition is heavily skewed towards Entire Home/Apt listings, which make up 87.5% of the 248 active rentals. This indicates strong guest preference for privacy and space.
- Looking at the property type distribution in Vienne, Apartment/Condo properties are the most common (80.6%), reflecting the local real estate landscape.
- Smaller segments like hotel/boutique, others (combined 5.6%) offer potential for unique stay experiences.
Vienne Airbnb Room Capacity Analysis (2026): Bedroom Distribution
Distribution of Listings by Number of Bedrooms
Room Capacity Insights for Vienne
- The dominant room capacity in Vienne is 1 bedroom listings, making up 48% of the market. This suggests a strong demand for properties suitable for couples or solo travelers.
- Together, 1 bedroom and 2 bedrooms properties represent 75.4% of the active Airbnb listings in Vienne, indicating a high concentration in these sizes.
- Listings with 3+ bedrooms (6.4%) represent a smaller niche, potentially indicating an underserved market for larger group accommodations in Vienne.
Vienne Vacation Rental Guest Capacity Trends (2026)
Distribution of Listings by Guest Capacity
Guest Capacity Insights for Vienne
- The most common guest capacity trend in Vienne vacation rentals is listings accommodating 2 guests (33.9%). This suggests the primary traveler segment is likely couples or solo travelers.
- Properties designed for 2 guests and 4 guests dominate the Vienne STR market, accounting for 66.6% of listings.
- 15.3% of properties accommodate 6+ guests, serving the market segment for larger families or group travel in Vienne.
- On average, properties in Vienne are equipped to host 3.2 guests.
Vienne Airbnb Booking Patterns (2026): Available vs. Booked Days
Available Days Distribution
Booked Days Distribution
Booking Pattern Insights for Vienne
- The most common availability pattern in Vienne falls within the 271-366 days range, representing 51.2% of listings. This suggests many properties have significant open periods on their calendars.
- Approximately 87.1% of listings show high availability (181+ days open annually), indicating potential for increased bookings or specific owner usage patterns.
- For booked days, the 91-180 days range is most frequent in Vienne (35.9%), reflecting common guest stay durations or potential owner blocking patterns.
- A notable 14.1% of properties secure long booking periods (181+ days booked per year), highlighting successful long-term rental strategies or significant owner usage.
Vienne Airbnb Minimum Stay Requirements Analysis
Distribution of Listings by Minimum Night Requirement
1 Night
111 listings
44.8% of total
2 Nights
42 listings
16.9% of total
3 Nights
8 listings
3.2% of total
4-6 Nights
6 listings
2.4% of total
7-29 Nights
4 listings
1.6% of total
30+ Nights
77 listings
31% of total
Key Insights
- The most prevalent minimum stay requirement in Vienne is 1 Night, adopted by 44.8% of listings. This highlights the market's preference for shorter, flexible bookings.
- A strong majority (61.7%) of the Vienne Airbnb data shows acceptance of very short stays (1-2 nights), indicating a dynamic, high-turnover market.
- A significant segment (31%) caters to monthly stays (30+ nights) in Vienne, pointing to opportunities in the extended-stay market.
Recommendations
- Align with the market by considering a 1 Night minimum stay, as 44.8% of Vienne hosts use this setting.
- Explore offering discounts for stays of 30+ nights to attract the 31% of the market seeking extended stays.
- Adjust minimum nights based on seasonality – potentially shorter during low season and longer during peak demand periods in Vienne.
Vienne Airbnb Cancellation Policy Trends Analysis (2026)
Refundable
1 listings
0.4% of total
Limited
5 listings
2% of total
Flexible
94 listings
37.9% of total
Moderate
97 listings
39.1% of total
Firm
40 listings
16.1% of total
Strict
11 listings
4.4% of total
Cancellation Policy Insights for Vienne
- The prevailing Airbnb cancellation policy trend in Vienne is Moderate, used by 39.1% of listings.
- The market strongly favors guest-friendly terms, with 77.0% of listings offering Flexible or Moderate policies. This suggests guests in Vienne may expect booking flexibility.
- Strict cancellation policies are quite rare (4.4%), potentially making listings with this policy less competitive unless justified by high demand or property type.
Recommendations for Hosts
- Consider adopting a Moderate policy to align with the 39.1% market standard in Vienne.
- Using a Strict policy might deter some guests, as only 4.4% of listings use it. Evaluate if potential revenue protection outweighs possible lower booking rates.
- Regularly review your cancellation policy against competitors and market demand shifts in Vienne.
Vienne STR Booking Lead Time Analysis (2026)
Average Booking Lead Time by Month
Booking Lead Time Insights for Vienne
- The overall average booking lead time for vacation rentals in Vienne is 42 days.
- Guests book furthest in advance for stays during June (average 69 days), likely coinciding with peak travel demand or local events.
- The shortest booking windows occur for stays in February (average 18 days), indicating more last-minute travel plans during this time.
- Seasonally, Summer (61 days avg.) sees the longest lead times, while Winter (22 days avg.) has the shortest, reflecting typical travel planning cycles.
Recommendations for Hosts
- Use the overall average lead time (42 days) as a baseline for your pricing and availability strategy in Vienne.
- For June stays, consider implementing length-of-stay discounts or slightly higher rates for bookings made less than 69 days out to capitalize on advance planning.
- Target marketing efforts for the Summer season well in advance (at least 61 days) to capture early planners.
- Monitor your own booking lead times against these Vienne averages to identify opportunities for dynamic pricing adjustments.
Popular & Essential Airbnb Amenities in Vienne (2026)
Amenity Prevalence
Amenity Insights for Vienne
- Popular amenities like Wifi, Kitchen, Heating are common but not universal. Offering these can provide a competitive edge.
- Warning: Wifi is not universally provided but is considered essential globally. Ensure reliable Wifi is offered.
Recommendations for Hosts
- Consider adding popular differentiators like Wifi or Kitchen to increase appeal.
- Highlight unique or less common amenities you offer (e.g., hot tub, dedicated workspace, EV charger) in your listing description and photos.
- Regularly check competitor amenities in Vienne to stay competitive.
Vienne Airbnb Guest Demographics & Profile Analysis (2026)
Guest Profile Summary for Vienne
- The typical guest profile for Airbnb in Vienne consists of primarily domestic travelers (79%), often arriving from nearby Lyon, typically belonging to the Post-2000s (Gen Z/Alpha) group (50%), primarily speaking French or English.
- Domestic travelers account for 79.2% of guests.
- Key international markets include France (79.2%) and Germany (3.4%).
- Top languages spoken are French (41%) followed by English (31.9%).
- A significant demographic segment is the Post-2000s (Gen Z/Alpha) group, representing 50% of guests.
Recommendations for Hosts
- Target domestic marketing efforts towards travelers from Lyon and Paris.
- Tailor amenities and listing descriptions to appeal to the dominant Post-2000s (Gen Z/Alpha) demographic (e.g., highlight fast WiFi, smart home features, local guides).
- Highlight unique local experiences or amenities relevant to the primary guest profile.
- Consider seasonal promotions aligned with peak travel times for key origin markets.
Nearby Short-Term Rental Market Comparison
How does the Vienne Airbnb market stack up against its neighbors? Compare key performance metrics like average monthly revenue, ADR, and occupancy rates in surrounding areas to understand the broader regional STR landscape.
| Market | Active Properties | Monthly Revenue | Daily Rate | Avg. Occupancy |
|---|---|---|---|---|
| Épinac | 18 | $8,488 | $539.65 | 36% |
| Saint-Trivier-sur-Moignans | 10 | $3,748 | $311.34 | 37% |
| Bourdeau | 13 | $3,327 | $260.60 | 50% |
| Cavillargues | 12 | $3,274 | $342.99 | 43% |
| Bligny-lès-Beaune | 23 | $3,066 | $279.17 | 43% |
| Divajeu | 20 | $3,061 | $421.97 | 32% |
| Suzette | 12 | $2,973 | $415.98 | 37% |
| Juliénas | 17 | $2,882 | $244.93 | 43% |
| Puligny-Montrachet | 16 | $2,859 | $368.33 | 35% |
| Lamotte-du-Rhône | 13 | $2,854 | $315.16 | 36% |