Les Adrets Airbnb Market Analysis 2026: Short Term Rental Data & Vacation Rental Statistics in Auvergne-Rhône-Alpes, France
Is Airbnb profitable in Les Adrets in 2026? Explore comprehensive Airbnb analytics for Les Adrets, Auvergne-Rhône-Alpes, France to uncover income potential. This 2026 STR market report for Les Adrets, based on AirROI data from February 2025 to January 2026, reveals key trends in the niche market of 172 active listings.
Whether you're considering an Airbnb investment in Les Adrets, optimizing your existing vacation rental, or exploring rental arbitrage opportunities, understanding the Les Adrets Airbnb data is crucial. Leveraging the low regulation environment is key to maximizing your short term rental income potential. Let's dive into the specifics.
Key Les Adrets Airbnb Performance Metrics Overview
Monthly Airbnb Revenue Variations & Income Potential in Les Adrets (2026)
Understanding the monthly revenue variations for Airbnb listings in Les Adrets is key to maximizing your short term rental income potential. Seasonality significantly impacts earnings. Our analysis, based on data from the past 12 months, shows that the peak revenue month for STRs in Les Adrets is typically February, while June often presents the lowest earnings, highlighting opportunities for strategic pricing adjustments during shoulder and low seasons. Explore the typical Airbnb income in Les Adrets across different performance tiers:
- Best-in-class properties (Top 10%) achieve $1,846+ monthly, often utilizing dynamic pricing and superior guest experiences.
- Strong performing properties (Top 25%) earn $1,168 or more, indicating effective management and desirable locations/amenities.
- Typical properties (Median) generate around $698 per month, representing the average market performance.
- Entry-level properties (Bottom 25%) see earnings around $415, often with potential for optimization.
Average Monthly Airbnb Earnings Trend in Les Adrets
Les Adrets Airbnb Occupancy Rate Trends (2026)
Maximize your bookings by understanding the Les Adrets STR occupancy trends. Seasonal demand shifts significantly influence how often properties are booked. Typically, Februarysees the highest demand (peak season occupancy), while October experiences the lowest (low season). Effective strategies, like adjusting minimum stays or offering promotions, can boost occupancy during slower periods. Here's how different property tiers perform in Les Adrets:
- Best-in-class properties (Top 10%) achieve 59%+ occupancy, indicating high desirability and potentially optimized availability.
- Strong performing properties (Top 25%) maintain 40% or higher occupancy, suggesting good market fit and guest satisfaction.
- Typical properties (Median) have an occupancy rate around 26%.
- Entry-level properties (Bottom 25%) average 16% occupancy, potentially facing higher vacancy.
Average Monthly Occupancy Rate Trend in Les Adrets
Average Daily Rate (ADR) Airbnb Trends in Les Adrets (2026)
Effective short term rental pricing strategy in Les Adrets involves understanding monthly ADR fluctuations. The Average Daily Rate (ADR) for Airbnb in Les Adrets typically peaks in January and dips lowest during June. Leveraging Airbnb dynamic pricing tools or strategies based on this seasonality can significantly boost revenue. Here's a look at the typical nightly rates achieved:
- Best-in-class properties (Top 10%) command rates of $199+ per night, often due to premium features or locations.
- Strong performing properties (Top 25%) achieve nightly rates of $126 or more.
- Typical properties (Median) charge around $86 per night.
- Entry-level properties (Bottom 25%) earn around $61 per night.
Average Daily Rate (ADR) Trend by Month in Les Adrets
Get Live Les Adrets Market Intelligence 👇

Explore Real-time Analytics
Airbnb Seasonality Analysis & Trends in Les Adrets (2026)
Peak Season (February, March, January)
- Revenue averages $1,707 per month
- Occupancy rates average 50.0%
- Daily rates average $117
Shoulder Season
- Revenue averages $757 per month
- Occupancy maintains around 26.3%
- Daily rates hold near $105
Low Season (June, September, October)
- Revenue drops to average $470 per month
- Occupancy decreases to average 18.7%
- Daily rates adjust to average $102
Seasonality Insights for Les Adrets
- The Airbnb seasonality in Les Adrets shows highly seasonal trends requiring careful strategy. While the sections above show seasonal averages, it's also insightful to look at the extremes:
- During the high season, the absolute peak month showcases Les Adrets's highest earning potential, with monthly revenues capable of climbing to $2,555, occupancy reaching a high of 72.8%, and ADRs peaking at $125.
- Conversely, the slowest single month of the year, typically falling within the low season, marks the market's lowest point. In this month, revenue might dip to $438, occupancy could drop to 18.0%, and ADRs may adjust down to $99.
- Understanding both the seasonal averages and these monthly peaks and troughs in revenue, occupancy, and ADR is crucial for maximizing your Airbnb profit potential in Les Adrets.
Seasonal Strategies for Maximizing Profit
- Peak Season: Maximize revenue through premium pricing and potentially longer minimum stays. Ensure high availability.
- Low Season: Offer competitive pricing, special promotions (e.g., extended stay discounts), and flexible cancellation policies. Target off-season travelers like remote workers or budget-conscious guests.
- Shoulder Seasons: Implement dynamic pricing that balances peak and low rates. Target weekend travelers or specific events. Offer slightly more flexible terms than peak season.
- Regularly analyze your own performance against these Les Adrets seasonality benchmarks and adjust your pricing and availability strategy accordingly.
Best Areas for Airbnb Investment in Les Adrets (2026)
Exploring the top neighborhoods for short-term rentals in Les Adrets? This section highlights key areas, outlining why they are attractive for hosts and guests, along with notable local attractions. Consider these locations based on your target guest profile and investment strategy.
| Neighborhood / Area | Why Host Here? (Target Guests & Appeal) | Key Attractions & Landmarks |
|---|---|---|
| Les Adrets Village | Charming village offering scenic views of the mountains and lakes. Ideal for guests seeking tranquility and nature, close to explorative hiking and biking routes. | Les Adrets Lake, Parc Naturel Régional du Vercors, Les Plages des Saisies, Hiking Trails, Local Vineyards |
| Chambéry | A historical town with rich culture, perfect for tourists interested in history, museums, and shopping. Attractive to a wide range of visitors throughout the year. | Château de Chambéry, Les Halles, Natural History Museum, Chambéry Cathedral, Le Phare |
| Alpe d'Huez | Famous ski resort attracting winter sports enthusiasts and summer hikers. An excellent choice for Airbnb hosts aiming for seasonal tourists. | Alpe d'Huez Ski Area, Pic Blanc Summit, Oisans, Eglise Notre-Dame-des-Neiges, Summer Cycling Events |
| Annecy | Known as the 'Venice of the Alps', Annecy is famous for its picturesque old town and lake. High demand for short-term rentals year-round. | Lake Annecy, Palais de l'Isle, Château d'Annecy, Gorges du Fier, Old Town |
| Échirolles | A suburban area close to Grenoble, offering affordable accommodations for business and leisure travelers. Less touristy, great for locals visiting. | Parc Paul Mistral, Stade des Alpes, Grenoble Museum, Local Pubs and Restaurants |
| Grenoble | A vibrant city surrounded by mountains, perfect for adventure seekers and culture lovers. Hosts many international events and fairs throughout the year. | Museum of Grenoble, Bastille Hill, Isère River, Grenoble's Public Gardens, La Caserne de Bonne |
| Les Deux Alpes | Another prime ski destination, popular for both winter and summer activities. Attracts a mix of outdoor enthusiasts year-round. | Les Deux Alpes Ski Resort, La Meije Glacier, Alpine Cycling Routes, Spring International Snowboard Event, Summer Skiing |
| Saint-Étienne | A city known for its industrial history and modern cultural scene. Affordable housing with potential growth for short-stay accommodation. | Cité du Design, Saint-Étienne Museum of Modern Art, Old City Centre, Local Cafés and Dining |
Understanding Airbnb License Requirements & STR Laws in Les Adrets (2026)
While Les Adrets, Auvergne-Rhône-Alpes, France currently shows low STR regulations, specific Airbnb license requirements might still exist or change. Always verify the latest short term rental regulations and Airbnb license requirements directly with local government authorities for Les Adrets to ensure full compliance before hosting.
(Source: AirROI data, 2026, based on 10% licensed listings)
Top Performing Airbnb Properties in Les Adrets (2026)
Benchmark your potential! Explore examples of top-performing Airbnb properties in Les Adretsbased on Trailing Twelve Month (TTM) revenue. Analyze their characteristics, revenue, occupancy rate, and ADR to understand what drives success in this market.
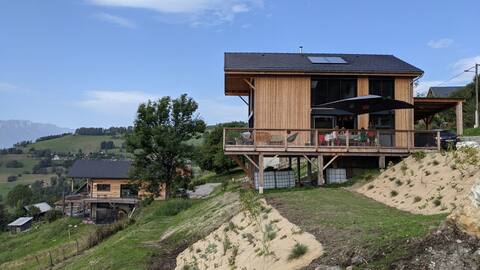
Eco-friendly wooden chalet, 120 m2 panoramic view
Entire Place • 3 bedrooms
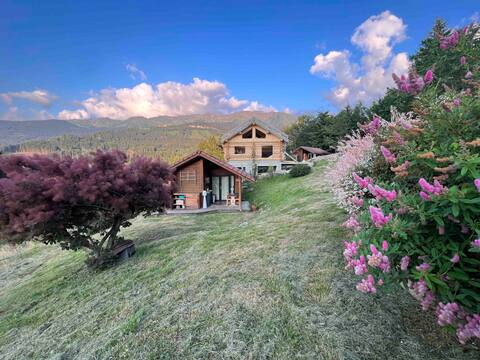
Shack Deluxe - Cozy Chalet, Les Adrets (7 Laux)
Entire Place • 2 bedrooms
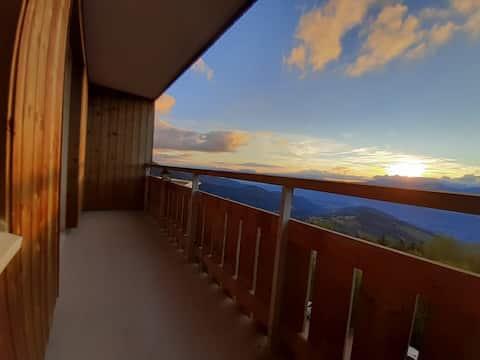
Charming apartment with a view.
Entire Place • N/A

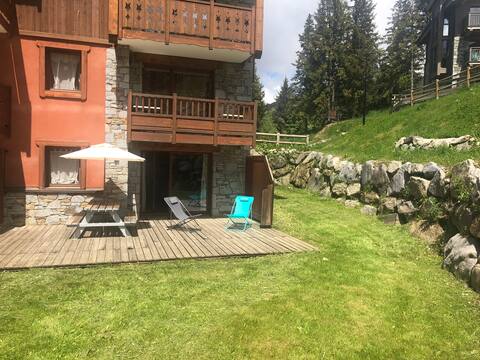
Individual chalet near the 7 Laux station
Entire Place • 2 bedrooms
My den in the 7 Laux 6/8 pers large south terrace
Entire Place • 3 bedrooms

Isa & Ludo's House
Entire Place • 3 bedrooms
Note: Performance varies based on location, size, amenities, seasonality, and management quality. Data reflects the past 12 months.
Top Performing Airbnb Hosts in Les Adrets (2026)
Learn from the best! This table showcases top-performing Airbnb hosts in Les Adrets based on the number of properties managed and estimated total revenue over the past year. Analyze their scale and performance metrics.
| Host Name | Properties | Grossing Revenue | Stay Reviews | Avg Rating |
|---|---|---|---|---|
| Les 7 Laux Immobilier Services | 20 | $141,663 | 42 | 4.47/5.0 |
| Mélanie | 1 | $34,604 | 18 | 5.00/5.0 |
| Amandine Et Franck | 3 | $30,402 | 190 | 4.98/5.0 |
| Marc-Antoine | 1 | $28,340 | 126 | 4.85/5.0 |
| Alexandre | 3 | $23,295 | 345 | 4.70/5.0 |
| Yoann | 1 | $22,149 | 50 | 4.96/5.0 |
| Laurent | 1 | $21,771 | 114 | 4.90/5.0 |
| Ludovic | 1 | $21,267 | 63 | 4.97/5.0 |
| Delphine | 3 | $20,226 | 219 | 4.80/5.0 |
| Ludovic | 1 | $19,072 | 20 | 4.95/5.0 |
Analyzing the strategies of top hosts, such as their property selection, pricing, and guest communication, can offer valuable lessons for optimizing your own Airbnb operations in Les Adrets.
Dive Deeper: Advanced Les Adrets STR Market Data (2026)
Ready to unlock more insights? AirROI provides access to advanced metrics and comprehensive Airbnb data for Les Adrets. Explore detailed analytics beyond this report to refine your investment strategy, optimize pricing, and maximize your vacation rental profits.
Explore Advanced MetricsLes Adrets Short-Term Rental Market Composition (2026): Property & Room Types
Room Type Distribution
Property Type Distribution
Market Composition Insights for Les Adrets
- The Les Adrets Airbnb market composition is heavily skewed towards Entire Home/Apt listings, which make up 98.8% of the 172 active rentals. This indicates strong guest preference for privacy and space.
- Looking at the property type distribution in Les Adrets, Apartment/Condo properties are the most common (92.4%), reflecting the local real estate landscape.
- Smaller segments like hotel/boutique, outdoor/unique (combined 1.2%) offer potential for unique stay experiences.
Les Adrets Airbnb Room Capacity Analysis (2026): Bedroom Distribution
Distribution of Listings by Number of Bedrooms
Room Capacity Insights for Les Adrets
- The dominant room capacity in Les Adrets is 1 bedroom listings, making up 41.9% of the market. This suggests a strong demand for properties suitable for couples or solo travelers.
- Together, 1 bedroom and 2 bedrooms properties represent 63.4% of the active Airbnb listings in Les Adrets, indicating a high concentration in these sizes.
- Listings with 3+ bedrooms (7.6%) represent a smaller niche, potentially indicating an underserved market for larger group accommodations in Les Adrets.
Les Adrets Vacation Rental Guest Capacity Trends (2026)
Distribution of Listings by Guest Capacity
Guest Capacity Insights for Les Adrets
- The most common guest capacity trend in Les Adrets vacation rentals is listings accommodating 4 guests (43%). This suggests the primary traveler segment is likely small families or groups.
- Properties designed for 4 guests and 6 guests dominate the Les Adrets STR market, accounting for 63.3% of listings.
- 30.2% of properties accommodate 6+ guests, serving the market segment for larger families or group travel in Les Adrets.
- On average, properties in Les Adrets are equipped to host 4.8 guests.
Les Adrets Airbnb Booking Patterns (2026): Available vs. Booked Days
Available Days Distribution
Booked Days Distribution
Booking Pattern Insights for Les Adrets
- The most common availability pattern in Les Adrets falls within the 271-366 days range, representing 75.6% of listings. This suggests many properties have significant open periods on their calendars.
- Approximately 95.9% of listings show high availability (181+ days open annually), indicating potential for increased bookings or specific owner usage patterns.
- For booked days, the 31-90 days range is most frequent in Les Adrets (55.8%), reflecting common guest stay durations or potential owner blocking patterns.
- A notable 4.1% of properties secure long booking periods (181+ days booked per year), highlighting successful long-term rental strategies or significant owner usage.
Les Adrets Airbnb Minimum Stay Requirements Analysis
Distribution of Listings by Minimum Night Requirement
1 Night
8 listings
4.7% of total
2 Nights
23 listings
13.4% of total
3 Nights
4 listings
2.3% of total
4-6 Nights
33 listings
19.2% of total
7-29 Nights
8 listings
4.7% of total
30+ Nights
96 listings
55.8% of total
Key Insights
- The most prevalent minimum stay requirement in Les Adrets is 30+ Nights, adopted by 55.8% of listings. This highlights the market's preference for longer commitments.
- Very short stays (1-2 nights) are less common (18.1%), suggesting hosts prefer slightly longer bookings to optimize turnover.
- A significant segment (55.8%) caters to monthly stays (30+ nights) in Les Adrets, pointing to opportunities in the extended-stay market.
Recommendations
- Align with the market by considering a 30+ Nights minimum stay, as 55.8% of Les Adrets hosts use this setting.
- If feasible, allowing 1-night stays, especially midweek or during low season, could capture last-minute bookings, as only 4.7% currently do.
- Explore offering discounts for stays of 30+ nights to attract the 55.8% of the market seeking extended stays.
- Adjust minimum nights based on seasonality – potentially shorter during low season and longer during peak demand periods in Les Adrets.
Les Adrets Airbnb Cancellation Policy Trends Analysis (2026)
Super Strict 30 Days
16 listings
9.3% of total
Limited
1 listings
0.6% of total
Flexible
22 listings
12.8% of total
Moderate
42 listings
24.4% of total
Firm
75 listings
43.6% of total
Strict
16 listings
9.3% of total
Cancellation Policy Insights for Les Adrets
- The prevailing Airbnb cancellation policy trend in Les Adrets is Firm, used by 43.6% of listings.
- A majority (52.9%) of hosts in Les Adrets utilize Firm or Strict policies, indicating a market where hosts prioritize booking security.
- Strict cancellation policies are quite rare (9.3%), potentially making listings with this policy less competitive unless justified by high demand or property type.
Recommendations for Hosts
- Consider adopting a Firm policy to align with the 43.6% market standard in Les Adrets.
- Using a Strict policy might deter some guests, as only 9.3% of listings use it. Evaluate if potential revenue protection outweighs possible lower booking rates.
- Regularly review your cancellation policy against competitors and market demand shifts in Les Adrets.
Les Adrets STR Booking Lead Time Analysis (2026)
Average Booking Lead Time by Month
Booking Lead Time Insights for Les Adrets
- The overall average booking lead time for vacation rentals in Les Adrets is 57 days.
- Guests book furthest in advance for stays during February (average 116 days), likely coinciding with peak travel demand or local events.
- The shortest booking windows occur for stays in October (average 15 days), indicating more last-minute travel plans during this time.
- Seasonally, Winter (80 days avg.) sees the longest lead times, while Fall (27 days avg.) has the shortest, reflecting typical travel planning cycles.
Recommendations for Hosts
- Use the overall average lead time (57 days) as a baseline for your pricing and availability strategy in Les Adrets.
- For February stays, consider implementing length-of-stay discounts or slightly higher rates for bookings made less than 116 days out to capitalize on advance planning.
- Target marketing efforts for the Winter season well in advance (at least 80 days) to capture early planners.
- Monitor your own booking lead times against these Les Adrets averages to identify opportunities for dynamic pricing adjustments.
Popular & Essential Airbnb Amenities in Les Adrets (2026)
Amenity Prevalence
Amenity Insights for Les Adrets
- Essential amenities in Les Adrets that guests expect include: Kitchen. Lacking these (this) could significantly impact bookings.
- Popular amenities like TV, Heating, Hot water are common but not universal. Offering these can provide a competitive edge.
Recommendations for Hosts
- Ensure your listing includes all essential amenities for Les Adrets: Kitchen.
- Prioritize adding missing essentials: Kitchen.
- Consider adding popular differentiators like TV or Heating to increase appeal.
- Highlight unique or less common amenities you offer (e.g., hot tub, dedicated workspace, EV charger) in your listing description and photos.
- Regularly check competitor amenities in Les Adrets to stay competitive.
Les Adrets Airbnb Guest Demographics & Profile Analysis (2026)
Guest Profile Summary for Les Adrets
- The typical guest profile for Airbnb in Les Adrets consists of primarily domestic travelers (92%), often arriving from nearby Lyon, typically belonging to the Post-2000s (Gen Z/Alpha) group (50%), primarily speaking French or English.
- Domestic travelers account for 92.1% of guests.
- Key international markets include France (92.1%) and United Kingdom (2.1%).
- Top languages spoken are French (45.3%) followed by English (33.7%).
- A significant demographic segment is the Post-2000s (Gen Z/Alpha) group, representing 50% of guests.
Recommendations for Hosts
- Target domestic marketing efforts towards travelers from Lyon and Paris.
- Tailor amenities and listing descriptions to appeal to the dominant Post-2000s (Gen Z/Alpha) demographic (e.g., highlight fast WiFi, smart home features, local guides).
- Highlight unique local experiences or amenities relevant to the primary guest profile.
- Consider seasonal promotions aligned with peak travel times for key origin markets.
Nearby Short-Term Rental Market Comparison
How does the Les Adrets Airbnb market stack up against its neighbors? Compare key performance metrics like average monthly revenue, ADR, and occupancy rates in surrounding areas to understand the broader regional STR landscape.
| Market | Active Properties | Monthly Revenue | Daily Rate | Avg. Occupancy |
|---|---|---|---|---|
| Épinac | 18 | $8,488 | $539.65 | 36% |
| Les Clefs | 34 | $5,585 | $314.08 | 47% |
| La Rivière-Enverse | 18 | $4,591 | $674.42 | 37% |
| Manigod | 221 | $4,273 | $460.37 | 38% |
| Saint-Trivier-sur-Moignans | 10 | $3,748 | $311.34 | 37% |
| Saint-Nicolas-la-Chapelle | 27 | $3,658 | $459.86 | 41% |
| Charvonnex | 11 | $3,610 | $266.39 | 45% |
| Bourdeau | 13 | $3,327 | $260.60 | 50% |
| Les Villards-sur-Thônes | 63 | $3,322 | $292.02 | 47% |
| Cavillargues | 12 | $3,274 | $342.99 | 43% |