Oulu Airbnb Market Analysis 2026: Short Term Rental Data & Vacation Rental Statistics in Mainland Finland, Finland
Is Airbnb profitable in Oulu in 2026? Explore comprehensive Airbnb analytics for Oulu, Mainland Finland, Finland to uncover income potential. This 2026 STR market report for Oulu, based on AirROI data from February 2025 to January 2026, reveals key trends in the market of 470 active listings.
Whether you're considering an Airbnb investment in Oulu, optimizing your existing vacation rental, or exploring rental arbitrage opportunities, understanding the Oulu Airbnb data is crucial. Leveraging the low regulation environment is key to maximizing your short term rental income potential. Let's dive into the specifics.
Key Oulu Airbnb Performance Metrics Overview
Monthly Airbnb Revenue Variations & Income Potential in Oulu (2026)
Understanding the monthly revenue variations for Airbnb listings in Oulu is key to maximizing your short term rental income potential. Seasonality significantly impacts earnings. Our analysis, based on data from the past 12 months, shows that the peak revenue month for STRs in Oulu is typically July, while January often presents the lowest earnings, highlighting opportunities for strategic pricing adjustments during shoulder and low seasons. Explore the typical Airbnb income in Oulu across different performance tiers:
- Best-in-class properties (Top 10%) achieve $2,397+ monthly, often utilizing dynamic pricing and superior guest experiences.
- Strong performing properties (Top 25%) earn $1,727 or more, indicating effective management and desirable locations/amenities.
- Typical properties (Median) generate around $1,070 per month, representing the average market performance.
- Entry-level properties (Bottom 25%) see earnings around $562, often with potential for optimization.
Average Monthly Airbnb Earnings Trend in Oulu
Oulu Airbnb Occupancy Rate Trends (2026)
Maximize your bookings by understanding the Oulu STR occupancy trends. Seasonal demand shifts significantly influence how often properties are booked. Typically, Julysees the highest demand (peak season occupancy), while January experiences the lowest (low season). Effective strategies, like adjusting minimum stays or offering promotions, can boost occupancy during slower periods. Here's how different property tiers perform in Oulu:
- Best-in-class properties (Top 10%) achieve 79%+ occupancy, indicating high desirability and potentially optimized availability.
- Strong performing properties (Top 25%) maintain 61% or higher occupancy, suggesting good market fit and guest satisfaction.
- Typical properties (Median) have an occupancy rate around 37%.
- Entry-level properties (Bottom 25%) average 18% occupancy, potentially facing higher vacancy.
Average Monthly Occupancy Rate Trend in Oulu
Average Daily Rate (ADR) Airbnb Trends in Oulu (2026)
Effective short term rental pricing strategy in Oulu involves understanding monthly ADR fluctuations. The Average Daily Rate (ADR) for Airbnb in Oulu typically peaks in July and dips lowest during March. Leveraging Airbnb dynamic pricing tools or strategies based on this seasonality can significantly boost revenue. Here's a look at the typical nightly rates achieved:
- Best-in-class properties (Top 10%) command rates of $160+ per night, often due to premium features or locations.
- Strong performing properties (Top 25%) achieve nightly rates of $119 or more.
- Typical properties (Median) charge around $92 per night.
- Entry-level properties (Bottom 25%) earn around $73 per night.
Average Daily Rate (ADR) Trend by Month in Oulu
Get Live Oulu Market Intelligence 👇

Explore Real-time Analytics
Airbnb Seasonality Analysis & Trends in Oulu (2026)
Peak Season (July, August, December)
- Revenue averages $1,539 per month
- Occupancy rates average 45.2%
- Daily rates average $113
Shoulder Season
- Revenue averages $1,223 per month
- Occupancy maintains around 42.3%
- Daily rates hold near $105
Low Season (January, April, May)
- Revenue drops to average $990 per month
- Occupancy decreases to average 33.8%
- Daily rates adjust to average $104
Seasonality Insights for Oulu
- The Airbnb seasonality in Oulu shows moderate seasonality with distinct peak and low periods. While the sections above show seasonal averages, it's also insightful to look at the extremes:
- During the high season, the absolute peak month showcases Oulu's highest earning potential, with monthly revenues capable of climbing to $1,693, occupancy reaching a high of 47.0%, and ADRs peaking at $119.
- Conversely, the slowest single month of the year, typically falling within the low season, marks the market's lowest point. In this month, revenue might dip to $932, occupancy could drop to 32.3%, and ADRs may adjust down to $101.
- Understanding both the seasonal averages and these monthly peaks and troughs in revenue, occupancy, and ADR is crucial for maximizing your Airbnb profit potential in Oulu.
Seasonal Strategies for Maximizing Profit
- Peak Season: Maximize revenue through premium pricing and potentially longer minimum stays. Ensure high availability.
- Low Season: Offer competitive pricing, special promotions (e.g., extended stay discounts), and flexible cancellation policies. Target off-season travelers like remote workers or budget-conscious guests.
- Shoulder Seasons: Implement dynamic pricing that balances peak and low rates. Target weekend travelers or specific events. Offer slightly more flexible terms than peak season.
- Regularly analyze your own performance against these Oulu seasonality benchmarks and adjust your pricing and availability strategy accordingly.
Best Areas for Airbnb Investment in Oulu (2026)
Exploring the top neighborhoods for short-term rentals in Oulu? This section highlights key areas, outlining why they are attractive for hosts and guests, along with notable local attractions. Consider these locations based on your target guest profile and investment strategy.
| Neighborhood / Area | Why Host Here? (Target Guests & Appeal) | Key Attractions & Landmarks |
|---|---|---|
| Oulu City Centre | The vibrant heart of Oulu with a mix of culture, shopping, and nightlife. Ideal location for tourists looking to explore local cafes, shops, and attractions. | Oulu Market Hall, Nallikari Beach, The Oulu Cathedral, Tietomaa Science Centre, Northern Ostrobothnia Museum |
| Linnansaari | A picturesque area with historical significance, home to the Oulu Castle ruins and great views of the Oulujoki River. Attracts visitors interested in history and nature. | Oulu Castle, Ainola Park, Riverside Promenade, Cafes along the river |
| Raksila | A residential area close to university and sports facilities, popular among students and families. Offers affordable accommodation options with access to local amenities. | Raksila Stadium, Oulu University of Applied Sciences, Market areas, Parks and playgrounds |
| Nallikari | A beachfront and recreational area known for its beautiful sandy beaches and outdoor activities. Great for families and tourists looking to enjoy leisure time by the water. | Nallikari Beach, Nallikari Lighthouse, Beachfront cafes, Camping and RV sites |
| Kumpulantie | A cozy residential area popular among nature lovers, located near outdoor trails and parks. Attracts visitors looking for a peaceful stay with easy access to nature. | Pikisaari Island, Nature trails, Local parks and green spaces |
| Hietasaari | An island area known for its recreational facilities, marina, and beautiful views. Ideal for visitors wanting a unique and tranquil living experience close to nature. | Hietasaari Beach, Marinas, Sporting facilities, Nature walks |
| Linnanmaa | A growing district that hosts the University of Oulu and offers modern apartments. Attracts university students and summer schools, providing good investment potential. | University of Oulu, Linnanmaa Church, Parks nearby |
| Soijärvi | A quieter area on the outskirts of Oulu, surrounded by forests and lakes. Offers a retreat from the city life, perfect for nature enthusiasts and those seeking tranquility. | Soijärvi Lake, Hiking trails, Fishing spots, Local wildlife |
Understanding Airbnb License Requirements & STR Laws in Oulu (2026)
While Oulu, Mainland Finland, Finland currently shows low STR regulations, specific Airbnb license requirements might still exist or change. Always verify the latest short term rental regulations and Airbnb license requirements directly with local government authorities for Oulu to ensure full compliance before hosting.
(Source: AirROI data, 2026, based on 0% licensed listings)
Top Performing Airbnb Properties in Oulu (2026)
Benchmark your potential! Explore examples of top-performing Airbnb properties in Oulubased on Trailing Twelve Month (TTM) revenue. Analyze their characteristics, revenue, occupancy rate, and ADR to understand what drives success in this market.

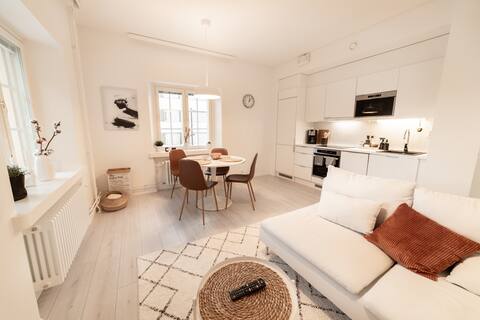
Bright spacious detached house in a quiet area
Entire Place • 5 bedrooms
Sauna | 61m2 | Lift | Keyless | City Center|Garage
Entire Place • 2 bedrooms
Half of a semi-detached house, 200m2
Entire Place • 5 bedrooms
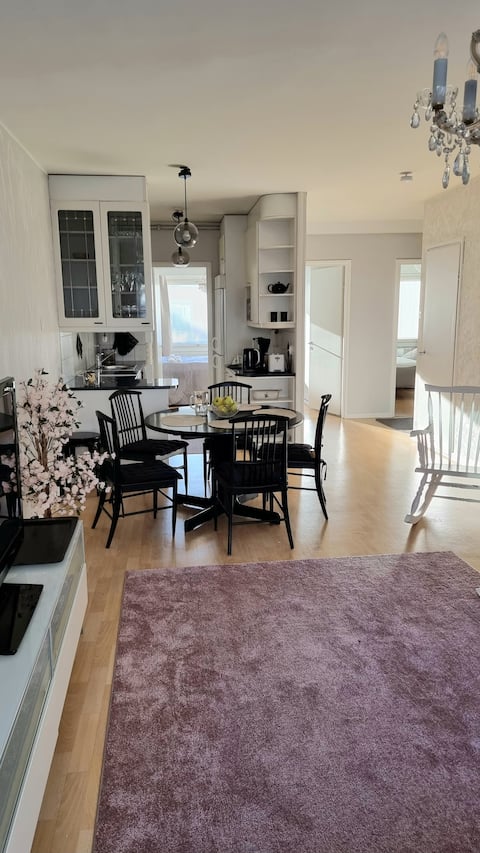
Charming home 2BR – free parking space in the garage
Entire Place • 2 bedrooms

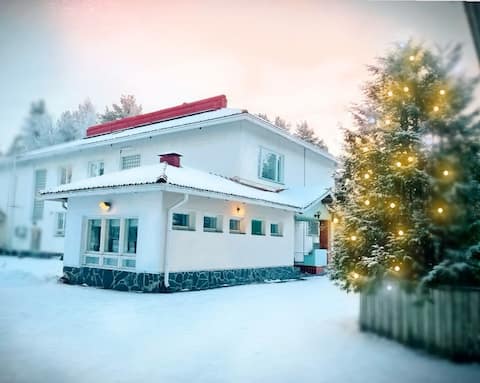
Arctic Culture Stay– Traditional Sauna | Oulu 2026
Entire Place • 3 bedrooms

Luxury Arctic Escape with private cinema & hot tub
Entire Place • 5 bedrooms
Note: Performance varies based on location, size, amenities, seasonality, and management quality. Data reflects the past 12 months.
Top Performing Airbnb Hosts in Oulu (2026)
Learn from the best! This table showcases top-performing Airbnb hosts in Oulu based on the number of properties managed and estimated total revenue over the past year. Analyze their scale and performance metrics.
| Host Name | Properties | Grossing Revenue | Stay Reviews | Avg Rating |
|---|---|---|---|---|
| Northern Apartments | 19 | $263,692 | 462 | 4.40/5.0 |
| Votel Oy | 11 | $199,686 | 2849 | 4.89/5.0 |
| Uleabo | 10 | $188,427 | 486 | 4.78/5.0 |
| JHO Housing Oy | 11 | $165,537 | 3899 | 4.85/5.0 |
| Harri | 16 | $103,205 | 610 | 4.82/5.0 |
| Jorma | 16 | $100,581 | 518 | 4.37/5.0 |
| Leila | 6 | $96,720 | 2564 | 4.87/5.0 |
| Henniina | 8 | $94,499 | 306 | 4.83/5.0 |
| Kotimaailma Oulu | 23 | $80,560 | 99 | 4.29/5.0 |
| Trendy Homes Oulu | 10 | $72,840 | 822 | 4.56/5.0 |
Analyzing the strategies of top hosts, such as their property selection, pricing, and guest communication, can offer valuable lessons for optimizing your own Airbnb operations in Oulu.
Dive Deeper: Advanced Oulu STR Market Data (2026)
Ready to unlock more insights? AirROI provides access to advanced metrics and comprehensive Airbnb data for Oulu. Explore detailed analytics beyond this report to refine your investment strategy, optimize pricing, and maximize your vacation rental profits.
Explore Advanced MetricsOulu Short-Term Rental Market Composition (2026): Property & Room Types
Room Type Distribution
Property Type Distribution
Market Composition Insights for Oulu
- The Oulu Airbnb market composition is heavily skewed towards Entire Home/Apt listings, which make up 92.8% of the 470 active rentals. This indicates strong guest preference for privacy and space.
- Looking at the property type distribution in Oulu, Apartment/Condo properties are the most common (76.6%), reflecting the local real estate landscape.
- Houses represent a significant 16.2% portion, catering likely to families or larger groups.
- Smaller segments like hotel/boutique, outdoor/unique, others, unique stays (combined 7.3%) offer potential for unique stay experiences.
Oulu Airbnb Room Capacity Analysis (2026): Bedroom Distribution
Distribution of Listings by Number of Bedrooms
Room Capacity Insights for Oulu
- The dominant room capacity in Oulu is 1 bedroom listings, making up 52.1% of the market. This suggests a strong demand for properties suitable for couples or solo travelers.
- Together, 1 bedroom and 2 bedrooms properties represent 73.4% of the active Airbnb listings in Oulu, indicating a high concentration in these sizes.
- With over half the market (52.1%) consisting of studios or 1-bedroom units, Oulu is particularly well-suited for individuals or couples.
Oulu Vacation Rental Guest Capacity Trends (2026)
Distribution of Listings by Guest Capacity
Guest Capacity Insights for Oulu
- The most common guest capacity trend in Oulu vacation rentals is listings accommodating 4 guests (28.3%). This suggests the primary traveler segment is likely small families or groups.
- Properties designed for 4 guests and 2 guests dominate the Oulu STR market, accounting for 50.2% of listings.
- 17.1% of properties accommodate 6+ guests, serving the market segment for larger families or group travel in Oulu.
- On average, properties in Oulu are equipped to host 3.7 guests.
Oulu Airbnb Booking Patterns (2026): Available vs. Booked Days
Available Days Distribution
Booked Days Distribution
Booking Pattern Insights for Oulu
- The most common availability pattern in Oulu falls within the 271-366 days range, representing 45.3% of listings. This suggests many properties have significant open periods on their calendars.
- Approximately 81.5% of listings show high availability (181+ days open annually), indicating potential for increased bookings or specific owner usage patterns.
- For booked days, the 91-180 days range is most frequent in Oulu (36.6%), reflecting common guest stay durations or potential owner blocking patterns.
- A notable 19.8% of properties secure long booking periods (181+ days booked per year), highlighting successful long-term rental strategies or significant owner usage.
Oulu Airbnb Minimum Stay Requirements Analysis
Distribution of Listings by Minimum Night Requirement
1 Night
204 listings
43.4% of total
2 Nights
113 listings
24% of total
3 Nights
8 listings
1.7% of total
4-6 Nights
5 listings
1.1% of total
7-29 Nights
16 listings
3.4% of total
30+ Nights
124 listings
26.4% of total
Key Insights
- The most prevalent minimum stay requirement in Oulu is 1 Night, adopted by 43.4% of listings. This highlights the market's preference for shorter, flexible bookings.
- A strong majority (67.4%) of the Oulu Airbnb data shows acceptance of very short stays (1-2 nights), indicating a dynamic, high-turnover market.
- A significant segment (26.4%) caters to monthly stays (30+ nights) in Oulu, pointing to opportunities in the extended-stay market.
Recommendations
- Align with the market by considering a 1 Night minimum stay, as 43.4% of Oulu hosts use this setting.
- Explore offering discounts for stays of 30+ nights to attract the 26.4% of the market seeking extended stays.
- Adjust minimum nights based on seasonality – potentially shorter during low season and longer during peak demand periods in Oulu.
Oulu Airbnb Cancellation Policy Trends Analysis (2026)
Limited
5 listings
1.1% of total
Flexible
217 listings
46.2% of total
Moderate
164 listings
34.9% of total
Firm
67 listings
14.3% of total
Strict
17 listings
3.6% of total
Cancellation Policy Insights for Oulu
- The prevailing Airbnb cancellation policy trend in Oulu is Flexible, used by 46.2% of listings.
- The market strongly favors guest-friendly terms, with 81.1% of listings offering Flexible or Moderate policies. This suggests guests in Oulu may expect booking flexibility.
- Strict cancellation policies are quite rare (3.6%), potentially making listings with this policy less competitive unless justified by high demand or property type.
Recommendations for Hosts
- Consider adopting a Flexible policy to align with the 46.2% market standard in Oulu.
- Using a Strict policy might deter some guests, as only 3.6% of listings use it. Evaluate if potential revenue protection outweighs possible lower booking rates.
- Regularly review your cancellation policy against competitors and market demand shifts in Oulu.
Oulu STR Booking Lead Time Analysis (2026)
Average Booking Lead Time by Month
Booking Lead Time Insights for Oulu
- The overall average booking lead time for vacation rentals in Oulu is 39 days.
- Guests book furthest in advance for stays during August (average 63 days), likely coinciding with peak travel demand or local events.
- The shortest booking windows occur for stays in October (average 27 days), indicating more last-minute travel plans during this time.
- Seasonally, Summer (48 days avg.) sees the longest lead times, while Fall (30 days avg.) has the shortest, reflecting typical travel planning cycles.
Recommendations for Hosts
- Use the overall average lead time (39 days) as a baseline for your pricing and availability strategy in Oulu.
- For August stays, consider implementing length-of-stay discounts or slightly higher rates for bookings made less than 63 days out to capitalize on advance planning.
- Target marketing efforts for the Summer season well in advance (at least 48 days) to capture early planners.
- Monitor your own booking lead times against these Oulu averages to identify opportunities for dynamic pricing adjustments.
Popular & Essential Airbnb Amenities in Oulu (2026)
Amenity Prevalence
Amenity Insights for Oulu
- Essential amenities in Oulu that guests expect include: Smoke alarm, Kitchen. Lacking these (any) could significantly impact bookings.
- Popular amenities like Heating, TV, Coffee maker are common but not universal. Offering these can provide a competitive edge.
Recommendations for Hosts
- Ensure your listing includes all essential amenities for Oulu: Smoke alarm, Kitchen.
- Prioritize adding missing essentials: Smoke alarm, Kitchen.
- Consider adding popular differentiators like Heating or TV to increase appeal.
- Highlight unique or less common amenities you offer (e.g., hot tub, dedicated workspace, EV charger) in your listing description and photos.
- Regularly check competitor amenities in Oulu to stay competitive.
Oulu Airbnb Guest Demographics & Profile Analysis (2026)
Guest Profile Summary for Oulu
- The typical guest profile for Airbnb in Oulu consists of primarily domestic travelers (79%), often arriving from nearby Helsinki, typically belonging to the Post-2000s (Gen Z/Alpha) group (50%), primarily speaking English or Finnish.
- Domestic travelers account for 78.7% of guests.
- Key international markets include Finland (78.7%) and Germany (3.7%).
- Top languages spoken are English (38.6%) followed by Finnish (33.2%).
- A significant demographic segment is the Post-2000s (Gen Z/Alpha) group, representing 50% of guests.
Recommendations for Hosts
- Target domestic marketing efforts towards travelers from Helsinki and Oulu.
- Tailor amenities and listing descriptions to appeal to the dominant Post-2000s (Gen Z/Alpha) demographic (e.g., highlight fast WiFi, smart home features, local guides).
- Highlight unique local experiences or amenities relevant to the primary guest profile.
- Consider seasonal promotions aligned with peak travel times for key origin markets.
Nearby Short-Term Rental Market Comparison
How does the Oulu Airbnb market stack up against its neighbors? Compare key performance metrics like average monthly revenue, ADR, and occupancy rates in surrounding areas to understand the broader regional STR landscape.
| Market | Active Properties | Monthly Revenue | Daily Rate | Avg. Occupancy |
|---|---|---|---|---|
| Rovaniemi | 1,497 | $2,507 | $384.79 | 44% |
| Ylitornio | 28 | $1,655 | $157.79 | 38% |
| Vaala | 11 | $1,542 | $170.95 | 40% |
| Ii | 39 | $1,508 | $172.84 | 33% |
| Ranua | 45 | $1,440 | $212.90 | 30% |
| Kempele | 20 | $1,380 | $144.04 | 36% |
| Tervola | 27 | $1,227 | $196.29 | 32% |
| Hailuoto | 17 | $1,205 | $123.18 | 39% |
| Pello | 39 | $1,195 | $163.16 | 35% |
| Keminmaa | 15 | $1,013 | $112.60 | 33% |