Kemi Airbnb Market Analysis 2026: Short Term Rental Data & Vacation Rental Statistics in Mainland Finland, Finland
Is Airbnb profitable in Kemi in 2026? Explore comprehensive Airbnb analytics for Kemi, Mainland Finland, Finland to uncover income potential. This 2026 STR market report for Kemi, based on AirROI data from February 2025 to January 2026, reveals key trends in the niche market of 94 active listings.
Whether you're considering an Airbnb investment in Kemi, optimizing your existing vacation rental, or exploring rental arbitrage opportunities, understanding the Kemi Airbnb data is crucial. Leveraging the low regulation environment is key to maximizing your short term rental income potential. Let's dive into the specifics.
Key Kemi Airbnb Performance Metrics Overview
Monthly Airbnb Revenue Variations & Income Potential in Kemi (2026)
Understanding the monthly revenue variations for Airbnb listings in Kemi is key to maximizing your short term rental income potential. Seasonality significantly impacts earnings. Our analysis, based on data from the past 12 months, shows that the peak revenue month for STRs in Kemi is typically December, while April often presents the lowest earnings, highlighting opportunities for strategic pricing adjustments during shoulder and low seasons. Explore the typical Airbnb income in Kemi across different performance tiers:
- Best-in-class properties (Top 10%) achieve $1,788+ monthly, often utilizing dynamic pricing and superior guest experiences.
- Strong performing properties (Top 25%) earn $1,222 or more, indicating effective management and desirable locations/amenities.
- Typical properties (Median) generate around $764 per month, representing the average market performance.
- Entry-level properties (Bottom 25%) see earnings around $380, often with potential for optimization.
Average Monthly Airbnb Earnings Trend in Kemi
Kemi Airbnb Occupancy Rate Trends (2026)
Maximize your bookings by understanding the Kemi STR occupancy trends. Seasonal demand shifts significantly influence how often properties are booked. Typically, Februarysees the highest demand (peak season occupancy), while October experiences the lowest (low season). Effective strategies, like adjusting minimum stays or offering promotions, can boost occupancy during slower periods. Here's how different property tiers perform in Kemi:
- Best-in-class properties (Top 10%) achieve 66%+ occupancy, indicating high desirability and potentially optimized availability.
- Strong performing properties (Top 25%) maintain 49% or higher occupancy, suggesting good market fit and guest satisfaction.
- Typical properties (Median) have an occupancy rate around 28%.
- Entry-level properties (Bottom 25%) average 15% occupancy, potentially facing higher vacancy.
Average Monthly Occupancy Rate Trend in Kemi
Average Daily Rate (ADR) Airbnb Trends in Kemi (2026)
Effective short term rental pricing strategy in Kemi involves understanding monthly ADR fluctuations. The Average Daily Rate (ADR) for Airbnb in Kemi typically peaks in December and dips lowest during April. Leveraging Airbnb dynamic pricing tools or strategies based on this seasonality can significantly boost revenue. Here's a look at the typical nightly rates achieved:
- Best-in-class properties (Top 10%) command rates of $153+ per night, often due to premium features or locations.
- Strong performing properties (Top 25%) achieve nightly rates of $110 or more.
- Typical properties (Median) charge around $86 per night.
- Entry-level properties (Bottom 25%) earn around $65 per night.
Average Daily Rate (ADR) Trend by Month in Kemi
Get Live Kemi Market Intelligence 👇

Explore Real-time Analytics
Airbnb Seasonality Analysis & Trends in Kemi (2026)
Peak Season (December, June, February)
- Revenue averages $1,265 per month
- Occupancy rates average 43.8%
- Daily rates average $105
Shoulder Season
- Revenue averages $874 per month
- Occupancy maintains around 31.7%
- Daily rates hold near $97
Low Season (April, October, November)
- Revenue drops to average $631 per month
- Occupancy decreases to average 25.5%
- Daily rates adjust to average $95
Seasonality Insights for Kemi
- The Airbnb seasonality in Kemi shows highly seasonal trends requiring careful strategy. While the sections above show seasonal averages, it's also insightful to look at the extremes:
- During the high season, the absolute peak month showcases Kemi's highest earning potential, with monthly revenues capable of climbing to $1,546, occupancy reaching a high of 45.9%, and ADRs peaking at $125.
- Conversely, the slowest single month of the year, typically falling within the low season, marks the market's lowest point. In this month, revenue might dip to $606, occupancy could drop to 23.5%, and ADRs may adjust down to $87.
- Understanding both the seasonal averages and these monthly peaks and troughs in revenue, occupancy, and ADR is crucial for maximizing your Airbnb profit potential in Kemi.
Seasonal Strategies for Maximizing Profit
- Peak Season: Maximize revenue through premium pricing and potentially longer minimum stays. Ensure high availability.
- Low Season: Offer competitive pricing, special promotions (e.g., extended stay discounts), and flexible cancellation policies. Target off-season travelers like remote workers or budget-conscious guests.
- Shoulder Seasons: Implement dynamic pricing that balances peak and low rates. Target weekend travelers or specific events. Offer slightly more flexible terms than peak season.
- Regularly analyze your own performance against these Kemi seasonality benchmarks and adjust your pricing and availability strategy accordingly.
Best Areas for Airbnb Investment in Kemi (2026)
Exploring the top neighborhoods for short-term rentals in Kemi? This section highlights key areas, outlining why they are attractive for hosts and guests, along with notable local attractions. Consider these locations based on your target guest profile and investment strategy.
| Neighborhood / Area | Why Host Here? (Target Guests & Appeal) | Key Attractions & Landmarks |
|---|---|---|
| Kemi City Center | The bustling heart of Kemi, offering a mix of shopping, dining, and local culture. Ideal for travelers looking for convenience and access to local attractions. | Kemi SnowCastle, Kemi Church, Kemi Marina, Sampo icebreaker, Kemi Market Square |
| Kemi Strand | A picturesque seaside area known for its beautiful shorelines and recreational activities. Perfect for those wanting to enjoy the outdoors and relax by the water. | Kemi Beach, Espanja beach, Pohjoisranta beach, Laitakari Island, Kemi Nature Trail |
| Kemi Isosaari | A serene island located near Kemi, offering a quiet escape with nature. Great for tourists seeking tranquility away from the city noise. | Isosaari Island trails, Camping facilities, Scenic views, Nature walks, Bird watching |
| Kemi Rautatieasema | Near the main railway station, making it an ideal location for travelers arriving by train. Access to regional destinations and easy public transport. | Kemi Railway Museum, Shopping centers nearby, Easy transport access, Restaurants, Local amenities |
| Kemi Shopping District | A vibrant area filled with shops, cafes, and local markets. A great place for visitors to shop for souvenirs and experience local Finnish culture. | Kemi Shopping Mall, Local artisanal shops, Food markets, Cafes, Cultural events |
| Ounasvaara | A scenic hilly area located a bit outside Kemi, famous for hiking and outdoor activities. Perfect for nature lovers and adventure seekers. | Hiking trails, Winter sports, Scenic lookout points, Outdoor recreational areas, Nature photography spots |
| Kemi Art Museum Area | Home to significant cultural institutions, this area attracts art lovers and those interested in local history. A good spot for the culturally inclined. | Kemi Art Museum, Art exhibitions, Cultural events, Historic buildings, Workshops |
| Salla-Kemi Nature Reserve | A beautiful and untouched nature reserve that attracts eco-tourists and outdoor enthusiasts. Ideal for guests interested in exploring nature and wildlife. | Nature trails, Wildlife watching, Photography opportunities, Camping, Outdoor sports |
Understanding Airbnb License Requirements & STR Laws in Kemi (2026)
While Kemi, Mainland Finland, Finland currently shows low STR regulations, specific Airbnb license requirements might still exist or change. Always verify the latest short term rental regulations and Airbnb license requirements directly with local government authorities for Kemi to ensure full compliance before hosting.
(Source: AirROI data, 2026, finding no licensed listings among those analyzed)
Top Performing Airbnb Properties in Kemi (2026)
Benchmark your potential! Explore examples of top-performing Airbnb properties in Kemibased on Trailing Twelve Month (TTM) revenue. Analyze their characteristics, revenue, occupancy rate, and ADR to understand what drives success in this market.
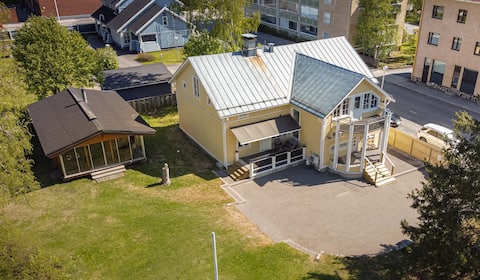
Big Villa in Sea Lapland
Entire Place • 5 bedrooms

Kemi city center 2 room apt, free private parking
Entire Place • 1 bedroom
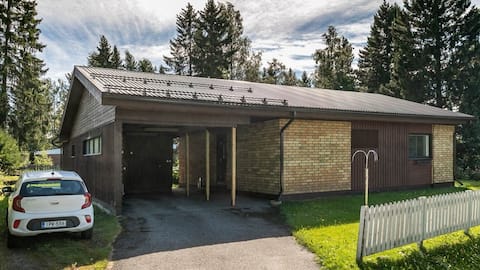
Detached house
Entire Place • 2 bedrooms
Lil Haven: Sauna, Balcony, Parking - No Hidden Fees
Entire Place • 1 bedroom

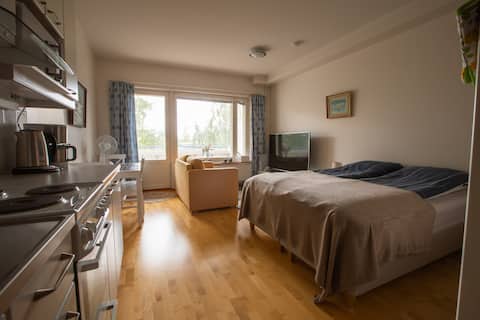
Studio in the center, free private parking
Entire Place • 1 bedroom

2 BR apartment Best Sea view, Free private parking
Entire Place • 2 bedrooms
Note: Performance varies based on location, size, amenities, seasonality, and management quality. Data reflects the past 12 months.
Top Performing Airbnb Hosts in Kemi (2026)
Learn from the best! This table showcases top-performing Airbnb hosts in Kemi based on the number of properties managed and estimated total revenue over the past year. Analyze their scale and performance metrics.
| Host Name | Properties | Grossing Revenue | Stay Reviews | Avg Rating |
|---|---|---|---|---|
| Villa Kemi Oy | 14 | $107,682 | 49 | 4.51/5.0 |
| Funit-Niina | 5 | $85,618 | 286 | 4.85/5.0 |
| Veli-Jussi | 8 | $79,562 | 357 | 4.59/5.0 |
| Rauli | 4 | $48,558 | 62 | 4.74/5.0 |
| Jarmo | 3 | $38,396 | 105 | 4.92/5.0 |
| Kauko | 1 | $31,318 | 12 | 5.00/5.0 |
| Jukka | 1 | $20,231 | 65 | 4.68/5.0 |
| Irma | 4 | $20,026 | 53 | 4.86/5.0 |
| Merja | 1 | $17,119 | 33 | 4.91/5.0 |
| Moona | 5 | $17,059 | 84 | 4.05/5.0 |
Analyzing the strategies of top hosts, such as their property selection, pricing, and guest communication, can offer valuable lessons for optimizing your own Airbnb operations in Kemi.
Dive Deeper: Advanced Kemi STR Market Data (2026)
Ready to unlock more insights? AirROI provides access to advanced metrics and comprehensive Airbnb data for Kemi. Explore detailed analytics beyond this report to refine your investment strategy, optimize pricing, and maximize your vacation rental profits.
Explore Advanced MetricsKemi Short-Term Rental Market Composition (2026): Property & Room Types
Room Type Distribution
Property Type Distribution
Market Composition Insights for Kemi
- The Kemi Airbnb market composition is heavily skewed towards Entire Home/Apt listings, which make up 79.8% of the 94 active rentals. This indicates strong guest preference for privacy and space.
- Looking at the property type distribution in Kemi, Apartment/Condo properties are the most common (70.2%), reflecting the local real estate landscape.
- The presence of 13.8% Hotel/Boutique listings indicates integration with traditional hospitality.
- Smaller segments like others (combined 2.1%) offer potential for unique stay experiences.
Kemi Airbnb Room Capacity Analysis (2026): Bedroom Distribution
Distribution of Listings by Number of Bedrooms
Room Capacity Insights for Kemi
- The dominant room capacity in Kemi is 1 bedroom listings, making up 61.7% of the market. This suggests a strong demand for properties suitable for couples or solo travelers.
- Together, 1 bedroom and 2 bedrooms properties represent 80.8% of the active Airbnb listings in Kemi, indicating a high concentration in these sizes.
- With over half the market (61.7%) consisting of studios or 1-bedroom units, Kemi is particularly well-suited for individuals or couples.
- Listings with 3+ bedrooms (8.6%) represent a smaller niche, potentially indicating an underserved market for larger group accommodations in Kemi.
Kemi Vacation Rental Guest Capacity Trends (2026)
Distribution of Listings by Guest Capacity
Guest Capacity Insights for Kemi
- The most common guest capacity trend in Kemi vacation rentals is listings accommodating 2 guests (25.5%). This suggests the primary traveler segment is likely couples or solo travelers.
- Properties designed for 2 guests and 4 guests dominate the Kemi STR market, accounting for 46.8% of listings.
- 14.9% of properties accommodate 6+ guests, serving the market segment for larger families or group travel in Kemi.
- On average, properties in Kemi are equipped to host 3.5 guests.
Kemi Airbnb Booking Patterns (2026): Available vs. Booked Days
Available Days Distribution
Booked Days Distribution
Booking Pattern Insights for Kemi
- The most common availability pattern in Kemi falls within the 271-366 days range, representing 57.4% of listings. This suggests many properties have significant open periods on their calendars.
- Approximately 89.3% of listings show high availability (181+ days open annually), indicating potential for increased bookings or specific owner usage patterns.
- For booked days, the 31-90 days range is most frequent in Kemi (41.5%), reflecting common guest stay durations or potential owner blocking patterns.
- A notable 11.7% of properties secure long booking periods (181+ days booked per year), highlighting successful long-term rental strategies or significant owner usage.
Kemi Airbnb Minimum Stay Requirements Analysis
Distribution of Listings by Minimum Night Requirement
1 Night
53 listings
56.4% of total
2 Nights
15 listings
16% of total
3 Nights
6 listings
6.4% of total
4-6 Nights
1 listings
1.1% of total
7-29 Nights
1 listings
1.1% of total
30+ Nights
18 listings
19.1% of total
Key Insights
- The most prevalent minimum stay requirement in Kemi is 1 Night, adopted by 56.4% of listings. This highlights the market's preference for shorter, flexible bookings.
- A strong majority (72.4%) of the Kemi Airbnb data shows acceptance of very short stays (1-2 nights), indicating a dynamic, high-turnover market.
- A significant segment (19.1%) caters to monthly stays (30+ nights) in Kemi, pointing to opportunities in the extended-stay market.
Recommendations
- Align with the market by considering a 1 Night minimum stay, as 56.4% of Kemi hosts use this setting.
- Explore offering discounts for stays of 30+ nights to attract the 19.1% of the market seeking extended stays.
- Adjust minimum nights based on seasonality – potentially shorter during low season and longer during peak demand periods in Kemi.
Kemi Airbnb Cancellation Policy Trends Analysis (2026)
Limited
1 listings
1.1% of total
Super Strict 30 Days
11 listings
11.8% of total
Flexible
42 listings
45.2% of total
Moderate
16 listings
17.2% of total
Firm
15 listings
16.1% of total
Strict
8 listings
8.6% of total
Cancellation Policy Insights for Kemi
- The prevailing Airbnb cancellation policy trend in Kemi is Flexible, used by 45.2% of listings.
- There's a relatively balanced mix between guest-friendly (62.4%) and stricter (24.7%) policies, offering choices for different guest needs.
- Strict cancellation policies are quite rare (8.6%), potentially making listings with this policy less competitive unless justified by high demand or property type.
Recommendations for Hosts
- Consider adopting a Flexible policy to align with the 45.2% market standard in Kemi.
- Using a Strict policy might deter some guests, as only 8.6% of listings use it. Evaluate if potential revenue protection outweighs possible lower booking rates.
- Regularly review your cancellation policy against competitors and market demand shifts in Kemi.
Kemi STR Booking Lead Time Analysis (2026)
Average Booking Lead Time by Month
Booking Lead Time Insights for Kemi
- The overall average booking lead time for vacation rentals in Kemi is 43 days.
- Guests book furthest in advance for stays during August (average 67 days), likely coinciding with peak travel demand or local events.
- The shortest booking windows occur for stays in September (average 24 days), indicating more last-minute travel plans during this time.
- Seasonally, Winter (45 days avg.) sees the longest lead times, while Fall (27 days avg.) has the shortest, reflecting typical travel planning cycles.
Recommendations for Hosts
- Use the overall average lead time (43 days) as a baseline for your pricing and availability strategy in Kemi.
- For August stays, consider implementing length-of-stay discounts or slightly higher rates for bookings made less than 67 days out to capitalize on advance planning.
- Target marketing efforts for the Winter season well in advance (at least 45 days) to capture early planners.
- Monitor your own booking lead times against these Kemi averages to identify opportunities for dynamic pricing adjustments.
Popular & Essential Airbnb Amenities in Kemi (2026)
Amenity Prevalence
Amenity Insights for Kemi
- Essential amenities in Kemi that guests expect include: Smoke alarm. Lacking these (this) could significantly impact bookings.
- Popular amenities like Kitchen, TV, Heating are common but not universal. Offering these can provide a competitive edge.
Recommendations for Hosts
- Ensure your listing includes all essential amenities for Kemi: Smoke alarm.
- Prioritize adding missing essentials: Smoke alarm.
- Consider adding popular differentiators like Kitchen or TV to increase appeal.
- Highlight unique or less common amenities you offer (e.g., hot tub, dedicated workspace, EV charger) in your listing description and photos.
- Regularly check competitor amenities in Kemi to stay competitive.
Kemi Airbnb Guest Demographics & Profile Analysis (2026)
Guest Profile Summary for Kemi
- The typical guest profile for Airbnb in Kemi consists of primarily domestic travelers (68%), often arriving from nearby Helsinki, typically belonging to the Post-2000s (Gen Z/Alpha) group (50%), primarily speaking English or Finnish.
- Domestic travelers account for 68.4% of guests.
- Key international markets include Finland (68.4%) and Germany (6.5%).
- Top languages spoken are English (38.9%) followed by Finnish (29.3%).
- A significant demographic segment is the Post-2000s (Gen Z/Alpha) group, representing 50% of guests.
Recommendations for Hosts
- Target domestic marketing efforts towards travelers from Helsinki and Oulu.
- Tailor amenities and listing descriptions to appeal to the dominant Post-2000s (Gen Z/Alpha) demographic (e.g., highlight fast WiFi, smart home features, local guides).
- Highlight unique local experiences or amenities relevant to the primary guest profile.
- Consider seasonal promotions aligned with peak travel times for key origin markets.
Nearby Short-Term Rental Market Comparison
How does the Kemi Airbnb market stack up against its neighbors? Compare key performance metrics like average monthly revenue, ADR, and occupancy rates in surrounding areas to understand the broader regional STR landscape.
| Market | Active Properties | Monthly Revenue | Daily Rate | Avg. Occupancy |
|---|---|---|---|---|
| Rovaniemi | 1,497 | $2,507 | $384.79 | 44% |
| Ylitornio | 28 | $1,655 | $157.79 | 38% |
| Ii | 39 | $1,508 | $172.84 | 33% |
| Kempele | 20 | $1,380 | $144.04 | 36% |
| Tervola | 27 | $1,227 | $196.29 | 32% |
| Hailuoto | 17 | $1,205 | $123.18 | 39% |
| Pello | 39 | $1,195 | $163.16 | 35% |
| Keminmaa | 15 | $1,013 | $112.60 | 33% |
| Kalajoki | 92 | $973 | $160.07 | 31% |
| Oulu | 470 | $922 | $105.08 | 39% |