Hollola Airbnb Market Analysis 2026: Short Term Rental Data & Vacation Rental Statistics in Mainland Finland, Finland
Is Airbnb profitable in Hollola in 2026? Explore comprehensive Airbnb analytics for Hollola, Mainland Finland, Finland to uncover income potential. This 2026 STR market report for Hollola, based on AirROI data from February 2025 to January 2026, reveals key trends in the niche market of 44 active listings.
Whether you're considering an Airbnb investment in Hollola, optimizing your existing vacation rental, or exploring rental arbitrage opportunities, understanding the Hollola Airbnb data is crucial. Leveraging the low regulation environment is key to maximizing your short term rental income potential. Let's dive into the specifics.
Key Hollola Airbnb Performance Metrics Overview
Monthly Airbnb Revenue Variations & Income Potential in Hollola (2026)
Understanding the monthly revenue variations for Airbnb listings in Hollola is key to maximizing your short term rental income potential. Seasonality significantly impacts earnings. Our analysis, based on data from the past 12 months, shows that the peak revenue month for STRs in Hollola is typically July, while January often presents the lowest earnings, highlighting opportunities for strategic pricing adjustments during shoulder and low seasons. Explore the typical Airbnb income in Hollola across different performance tiers:
- Best-in-class properties (Top 10%) achieve $5,603+ monthly, often utilizing dynamic pricing and superior guest experiences.
- Strong performing properties (Top 25%) earn $3,339 or more, indicating effective management and desirable locations/amenities.
- Typical properties (Median) generate around $1,448 per month, representing the average market performance.
- Entry-level properties (Bottom 25%) see earnings around $572, often with potential for optimization.
Average Monthly Airbnb Earnings Trend in Hollola
Hollola Airbnb Occupancy Rate Trends (2026)
Maximize your bookings by understanding the Hollola STR occupancy trends. Seasonal demand shifts significantly influence how often properties are booked. Typically, Julysees the highest demand (peak season occupancy), while January experiences the lowest (low season). Effective strategies, like adjusting minimum stays or offering promotions, can boost occupancy during slower periods. Here's how different property tiers perform in Hollola:
- Best-in-class properties (Top 10%) achieve 65%+ occupancy, indicating high desirability and potentially optimized availability.
- Strong performing properties (Top 25%) maintain 42% or higher occupancy, suggesting good market fit and guest satisfaction.
- Typical properties (Median) have an occupancy rate around 23%.
- Entry-level properties (Bottom 25%) average 11% occupancy, potentially facing higher vacancy.
Average Monthly Occupancy Rate Trend in Hollola
Average Daily Rate (ADR) Airbnb Trends in Hollola (2026)
Effective short term rental pricing strategy in Hollola involves understanding monthly ADR fluctuations. The Average Daily Rate (ADR) for Airbnb in Hollola typically peaks in July and dips lowest during March. Leveraging Airbnb dynamic pricing tools or strategies based on this seasonality can significantly boost revenue. Here's a look at the typical nightly rates achieved:
- Best-in-class properties (Top 10%) command rates of $634+ per night, often due to premium features or locations.
- Strong performing properties (Top 25%) achieve nightly rates of $357 or more.
- Typical properties (Median) charge around $195 per night.
- Entry-level properties (Bottom 25%) earn around $95 per night.
Average Daily Rate (ADR) Trend by Month in Hollola
Get Live Hollola Market Intelligence 👇

Explore Real-time Analytics
Airbnb Seasonality Analysis & Trends in Hollola (2026)
Peak Season (July, August, September)
- Revenue averages $3,593 per month
- Occupancy rates average 37.1%
- Daily rates average $276
Shoulder Season
- Revenue averages $2,119 per month
- Occupancy maintains around 29.4%
- Daily rates hold near $264
Low Season (January, March, November)
- Revenue drops to average $1,572 per month
- Occupancy decreases to average 23.0%
- Daily rates adjust to average $266
Seasonality Insights for Hollola
- The Airbnb seasonality in Hollola shows highly seasonal trends requiring careful strategy. While the sections above show seasonal averages, it's also insightful to look at the extremes:
- During the high season, the absolute peak month showcases Hollola's highest earning potential, with monthly revenues capable of climbing to $4,450, occupancy reaching a high of 46.6%, and ADRs peaking at $278.
- Conversely, the slowest single month of the year, typically falling within the low season, marks the market's lowest point. In this month, revenue might dip to $1,492, occupancy could drop to 18.8%, and ADRs may adjust down to $254.
- Understanding both the seasonal averages and these monthly peaks and troughs in revenue, occupancy, and ADR is crucial for maximizing your Airbnb profit potential in Hollola.
Seasonal Strategies for Maximizing Profit
- Peak Season: Maximize revenue through premium pricing and potentially longer minimum stays. Ensure high availability.
- Low Season: Offer competitive pricing, special promotions (e.g., extended stay discounts), and flexible cancellation policies. Target off-season travelers like remote workers or budget-conscious guests.
- Shoulder Seasons: Implement dynamic pricing that balances peak and low rates. Target weekend travelers or specific events. Offer slightly more flexible terms than peak season.
- Regularly analyze your own performance against these Hollola seasonality benchmarks and adjust your pricing and availability strategy accordingly.
Best Areas for Airbnb Investment in Hollola (2026)
Exploring the top neighborhoods for short-term rentals in Hollola? This section highlights key areas, outlining why they are attractive for hosts and guests, along with notable local attractions. Consider these locations based on your target guest profile and investment strategy.
| Neighborhood / Area | Why Host Here? (Target Guests & Appeal) | Key Attractions & Landmarks |
|---|---|---|
| Hollola Central | The heart of Hollola, featuring shops, cafes, and close access to historical sites. Ideal for tourists wanting to explore local culture and amenities. | Hollola Church, Hollola Old Wooden Church, Local shops and eateries, Cultural activities, Nearby nature trails |
| Päijänne National Park | A stunning natural landscape perfect for outdoor enthusiasts, featuring lakes and hiking trails. Attracts nature lovers and adventure seekers. | Päijänne Lake, Hiking trails, Camping sites, Fishing spots, Wildlife watching |
| Lahti City | Close proximity to Lahti, known for its events, culture, and sports facilities. Appeals to visitors attending events or exploring the city. | Lahti Symphony Orchestra, Ski Jumping Hills, Lahti Historical Museum, Sibelius Hall, Local markets |
| Tili-Mäen Ranta | A lakeside area offering a peaceful retreat for guests looking to relax by the water and enjoy recreational activities. | Beach access, Water sports, Picnic areas, Tranquil surroundings, Biking trails |
| Hollolan Taika | A unique arts and crafts area showcasing local artisans. Perfect for tourists looking for authentic Finnish crafts and workshops. | Local artisan shops, Craft workshops, Cultural exhibitions, Art events, Community activities |
| Ruuhijärvi | Known for its serene lakes and natural beauty, this area is great for families and nature activities. Attracts tourists seeking relaxation and exploration. | Outdoor swimming, Fishing activities, Scenic picnic spots, Nature trails, Birdwatching |
| Mäntsälä | A nearby district with rich historical significance and cultural sites. Ideal for history buffs and those exploring the region's heritage. | Historical sites, Cultural museums, Local events, Archery and sport events, Dining options |
| Kumpsi-Päivi | A suburban area that offers a quiet stay with easy access to larger city attractions. Suitable for families and long-term visitors. | Community parks, Quiet residential zones, Proximity to Lahti, Family-friendly activities, Local dining |
Understanding Airbnb License Requirements & STR Laws in Hollola (2026)
While Hollola, Mainland Finland, Finland currently shows low STR regulations, specific Airbnb license requirements might still exist or change. Always verify the latest short term rental regulations and Airbnb license requirements directly with local government authorities for Hollola to ensure full compliance before hosting.
(Source: AirROI data, 2026, finding no licensed listings among those analyzed)
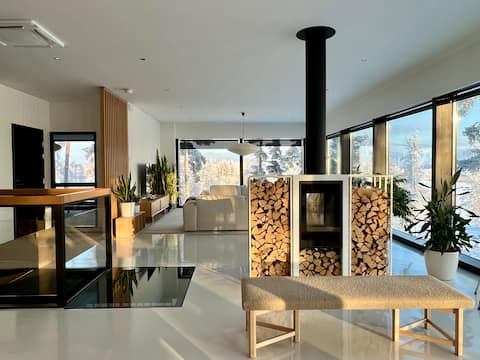
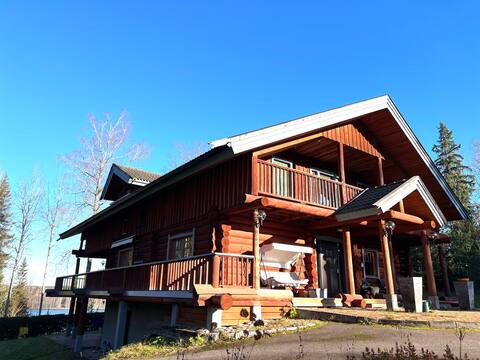
Top Performing Airbnb Properties in Hollola (2026)
Benchmark your potential! Explore examples of top-performing Airbnb properties in Hollolabased on Trailing Twelve Month (TTM) revenue. Analyze their characteristics, revenue, occupancy rate, and ADR to understand what drives success in this market.

Villa Micael - A bright and gorgeous home spa
Entire Place • 6 bedrooms

Beach cottage near Messilä (about 2 km)
Entire Place • 3 bedrooms
*Unique and luxury Villa Valo*
Entire Place • 4 bedrooms

Nature peace on the lake - cottage & beach sauna
Entire Place • 2 bedrooms
Kiviranta huvila
Entire Place • 5 bedrooms
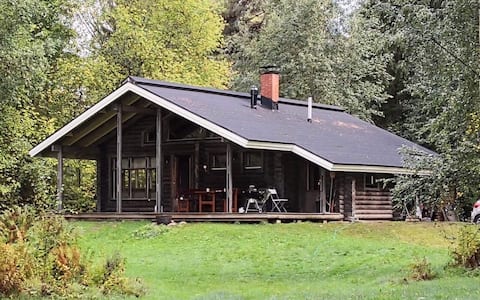
Cozy Log Cabin on Vesijärvi Lake
Entire Place • 3 bedrooms
Note: Performance varies based on location, size, amenities, seasonality, and management quality. Data reflects the past 12 months.
Top Performing Airbnb Hosts in Hollola (2026)
Learn from the best! This table showcases top-performing Airbnb hosts in Hollola based on the number of properties managed and estimated total revenue over the past year. Analyze their scale and performance metrics.
| Host Name | Properties | Grossing Revenue | Stay Reviews | Avg Rating |
|---|---|---|---|---|
| Jorma | 1 | $104,184 | 67 | 4.60/5.0 |
| Elina | 1 | $56,780 | 109 | 4.90/5.0 |
| Roosa | 4 | $55,884 | 61 | 4.47/5.0 |
| Janne | 1 | $53,266 | 4 | 5.00/5.0 |
| Netta | 1 | $46,167 | 64 | 4.81/5.0 |
| Timo | 1 | $38,206 | 33 | 5.00/5.0 |
| Tarmo | 1 | $34,419 | 1 | Not Rated |
| Elina | 1 | $33,654 | 8 | 5.00/5.0 |
| Villa Kurpitsa At Messilä | 2 | $32,681 | 178 | 4.53/5.0 |
| Jon | 1 | $31,863 | 3 | 5.00/5.0 |
Analyzing the strategies of top hosts, such as their property selection, pricing, and guest communication, can offer valuable lessons for optimizing your own Airbnb operations in Hollola.
Dive Deeper: Advanced Hollola STR Market Data (2026)
Ready to unlock more insights? AirROI provides access to advanced metrics and comprehensive Airbnb data for Hollola. Explore detailed analytics beyond this report to refine your investment strategy, optimize pricing, and maximize your vacation rental profits.
Explore Advanced MetricsHollola Short-Term Rental Market Composition (2026): Property & Room Types
Room Type Distribution
Property Type Distribution
Market Composition Insights for Hollola
- The Hollola Airbnb market composition is heavily skewed towards Entire Home/Apt listings, which make up 86.4% of the 44 active rentals. This indicates strong guest preference for privacy and space.
- Looking at the property type distribution in Hollola, House properties are the most common (61.4%), reflecting the local real estate landscape.
- Houses represent a significant 61.4% portion, catering likely to families or larger groups.
- The presence of 9.1% Hotel/Boutique listings indicates integration with traditional hospitality.
- Smaller segments like others (combined 2.3%) offer potential for unique stay experiences.
Hollola Airbnb Room Capacity Analysis (2026): Bedroom Distribution
Distribution of Listings by Number of Bedrooms
Room Capacity Insights for Hollola
- The dominant room capacity in Hollola is 3 bedrooms listings, making up 25% of the market. This suggests a strong demand for properties suitable for families or small groups.
- Together, 3 bedrooms and 2 bedrooms properties represent 47.7% of the active Airbnb listings in Hollola, indicating a high concentration in these sizes.
- A significant 50.0% of listings offer 3+ bedrooms, catering to larger groups and families seeking more space in Hollola.
Hollola Vacation Rental Guest Capacity Trends (2026)
Distribution of Listings by Guest Capacity
Guest Capacity Insights for Hollola
- The most common guest capacity trend in Hollola vacation rentals is listings accommodating 8+ guests (27.3%). This suggests the primary traveler segment is likely larger groups.
- Properties designed for 8+ guests and 6 guests dominate the Hollola STR market, accounting for 47.8% of listings.
- 54.6% of properties accommodate 6+ guests, serving the market segment for larger families or group travel in Hollola.
- On average, properties in Hollola are equipped to host 5.3 guests.
Hollola Airbnb Booking Patterns (2026): Available vs. Booked Days
Available Days Distribution
Booked Days Distribution
Booking Pattern Insights for Hollola
- The most common availability pattern in Hollola falls within the 271-366 days range, representing 75% of listings. This suggests many properties have significant open periods on their calendars.
- Approximately 95.5% of listings show high availability (181+ days open annually), indicating potential for increased bookings or specific owner usage patterns.
- For booked days, the 31-90 days range is most frequent in Hollola (54.5%), reflecting common guest stay durations or potential owner blocking patterns.
- A notable 4.5% of properties secure long booking periods (181+ days booked per year), highlighting successful long-term rental strategies or significant owner usage.
Hollola Airbnb Minimum Stay Requirements Analysis
Distribution of Listings by Minimum Night Requirement
1 Night
20 listings
45.5% of total
2 Nights
13 listings
29.5% of total
3 Nights
2 listings
4.5% of total
4-6 Nights
3 listings
6.8% of total
30+ Nights
6 listings
13.6% of total
Key Insights
- The most prevalent minimum stay requirement in Hollola is 1 Night, adopted by 45.5% of listings. This highlights the market's preference for shorter, flexible bookings.
- A strong majority (75.0%) of the Hollola Airbnb data shows acceptance of very short stays (1-2 nights), indicating a dynamic, high-turnover market.
- A significant segment (13.6%) caters to monthly stays (30+ nights) in Hollola, pointing to opportunities in the extended-stay market.
Recommendations
- Align with the market by considering a 1 Night minimum stay, as 45.5% of Hollola hosts use this setting.
- Explore offering discounts for stays of 30+ nights to attract the 13.6% of the market seeking extended stays.
- Adjust minimum nights based on seasonality – potentially shorter during low season and longer during peak demand periods in Hollola.
Hollola Airbnb Cancellation Policy Trends Analysis (2026)
Flexible
17 listings
38.6% of total
Moderate
14 listings
31.8% of total
Firm
9 listings
20.5% of total
Strict
4 listings
9.1% of total
Cancellation Policy Insights for Hollola
- The prevailing Airbnb cancellation policy trend in Hollola is Flexible, used by 38.6% of listings.
- The market strongly favors guest-friendly terms, with 70.4% of listings offering Flexible or Moderate policies. This suggests guests in Hollola may expect booking flexibility.
- Strict cancellation policies are quite rare (9.1%), potentially making listings with this policy less competitive unless justified by high demand or property type.
Recommendations for Hosts
- Consider adopting a Flexible policy to align with the 38.6% market standard in Hollola.
- Using a Strict policy might deter some guests, as only 9.1% of listings use it. Evaluate if potential revenue protection outweighs possible lower booking rates.
- Regularly review your cancellation policy against competitors and market demand shifts in Hollola.
Hollola STR Booking Lead Time Analysis (2026)
Average Booking Lead Time by Month
Booking Lead Time Insights for Hollola
- The overall average booking lead time for vacation rentals in Hollola is 46 days.
- Guests book furthest in advance for stays during December (average 75 days), likely coinciding with peak travel demand or local events.
- The shortest booking windows occur for stays in September (average 32 days), indicating more last-minute travel plans during this time.
- Seasonally, Winter (58 days avg.) sees the longest lead times, while Fall (41 days avg.) has the shortest, reflecting typical travel planning cycles.
Recommendations for Hosts
- Use the overall average lead time (46 days) as a baseline for your pricing and availability strategy in Hollola.
- For December stays, consider implementing length-of-stay discounts or slightly higher rates for bookings made less than 75 days out to capitalize on advance planning.
- Target marketing efforts for the Winter season well in advance (at least 58 days) to capture early planners.
- Monitor your own booking lead times against these Hollola averages to identify opportunities for dynamic pricing adjustments.
Popular & Essential Airbnb Amenities in Hollola (2026)
Amenity Prevalence
Amenity Insights for Hollola
- Essential amenities in Hollola that guests expect include: Free parking on premises, Smoke alarm. Lacking these (any) could significantly impact bookings.
- Popular amenities like Coffee maker, Dishes and silverware, Cooking basics are common but not universal. Offering these can provide a competitive edge.
Recommendations for Hosts
- Ensure your listing includes all essential amenities for Hollola: Free parking on premises, Smoke alarm.
- Prioritize adding missing essentials: Free parking on premises, Smoke alarm.
- Consider adding popular differentiators like Coffee maker or Dishes and silverware to increase appeal.
- Highlight unique or less common amenities you offer (e.g., hot tub, dedicated workspace, EV charger) in your listing description and photos.
- Regularly check competitor amenities in Hollola to stay competitive.
Hollola Airbnb Guest Demographics & Profile Analysis (2026)
Guest Profile Summary for Hollola
- The typical guest profile for Airbnb in Hollola consists of a mix of domestic (63%) and international guests, often arriving from nearby Helsinki, typically belonging to the Post-2000s (Gen Z/Alpha) group (50%), primarily speaking English or Finnish.
- Domestic travelers account for 62.7% of guests.
- Key international markets include Finland (62.7%) and Germany (8.7%).
- Top languages spoken are English (38.3%) followed by Finnish (29%).
- A significant demographic segment is the Post-2000s (Gen Z/Alpha) group, representing 50% of guests.
Recommendations for Hosts
- Target domestic marketing efforts towards travelers from Helsinki and Espoo.
- Tailor amenities and listing descriptions to appeal to the dominant Post-2000s (Gen Z/Alpha) demographic (e.g., highlight fast WiFi, smart home features, local guides).
- Highlight unique local experiences or amenities relevant to the primary guest profile.
- Consider seasonal promotions aligned with peak travel times for key origin markets.
Nearby Short-Term Rental Market Comparison
How does the Hollola Airbnb market stack up against its neighbors? Compare key performance metrics like average monthly revenue, ADR, and occupancy rates in surrounding areas to understand the broader regional STR landscape.
| Market | Active Properties | Monthly Revenue | Daily Rate | Avg. Occupancy |
|---|---|---|---|---|
| Sysmä | 16 | $2,882 | $287.09 | 40% |
| Kirkkonummi | 65 | $2,123 | $221.41 | 41% |
| Hattula | 11 | $1,860 | $192.87 | 33% |
| Ingå | 30 | $1,821 | $214.59 | 40% |
| Sipoo | 29 | $1,734 | $254.67 | 33% |
| Vihti | 32 | $1,732 | $196.45 | 35% |
| Loppi | 24 | $1,717 | $226.22 | 37% |
| Jämsä | 67 | $1,683 | $318.39 | 25% |
| Padasjoki | 11 | $1,671 | $171.08 | 37% |
| Pyhtää | 21 | $1,526 | $215.79 | 26% |