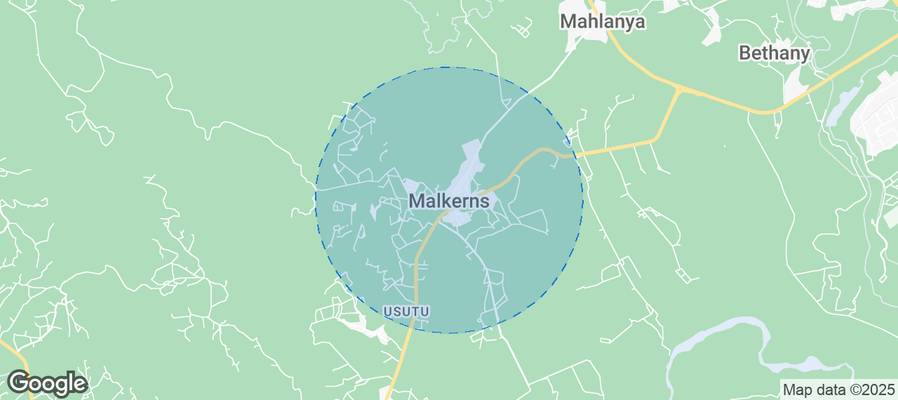
Malkerns Airbnb Market Analysis 2026: Short Term Rental Data & Vacation Rental Statistics in Manzini Region, Eswatini
Is Airbnb profitable in Malkerns in 2026? Explore comprehensive Airbnb analytics for Malkerns, Manzini Region, Eswatini to uncover income potential. This 2026 STR market report for Malkerns, based on AirROI data from February 2025 to January 2026, reveals key trends in the niche market of 24 active listings.
Whether you're considering an Airbnb investment in Malkerns, optimizing your existing vacation rental, or exploring rental arbitrage opportunities, understanding the Malkerns Airbnb data is crucial. Leveraging the low regulation environment is key to maximizing your short term rental income potential. Let's dive into the specifics.
Key Malkerns Airbnb Performance Metrics Overview
Monthly Airbnb Revenue Variations & Income Potential in Malkerns (2026)
Understanding the monthly revenue variations for Airbnb listings in Malkerns is key to maximizing your short term rental income potential. Seasonality significantly impacts earnings. Our analysis, based on data from the past 12 months, shows that the peak revenue month for STRs in Malkerns is typically April, while June often presents the lowest earnings, highlighting opportunities for strategic pricing adjustments during shoulder and low seasons. Explore the typical Airbnb income in Malkerns across different performance tiers:
- Best-in-class properties (Top 10%) achieve $1,490+ monthly, often utilizing dynamic pricing and superior guest experiences.
- Strong performing properties (Top 25%) earn $1,129 or more, indicating effective management and desirable locations/amenities.
- Typical properties (Median) generate around $720 per month, representing the average market performance.
- Entry-level properties (Bottom 25%) see earnings around $366, often with potential for optimization.
Average Monthly Airbnb Earnings Trend in Malkerns
Malkerns Airbnb Occupancy Rate Trends (2026)
Maximize your bookings by understanding the Malkerns STR occupancy trends. Seasonal demand shifts significantly influence how often properties are booked. Typically, Aprilsees the highest demand (peak season occupancy), while June experiences the lowest (low season). Effective strategies, like adjusting minimum stays or offering promotions, can boost occupancy during slower periods. Here's how different property tiers perform in Malkerns:
- Best-in-class properties (Top 10%) achieve 57%+ occupancy, indicating high desirability and potentially optimized availability.
- Strong performing properties (Top 25%) maintain 41% or higher occupancy, suggesting good market fit and guest satisfaction.
- Typical properties (Median) have an occupancy rate around 24%.
- Entry-level properties (Bottom 25%) average 14% occupancy, potentially facing higher vacancy.
Average Monthly Occupancy Rate Trend in Malkerns
Average Daily Rate (ADR) Airbnb Trends in Malkerns (2026)
Effective short term rental pricing strategy in Malkerns involves understanding monthly ADR fluctuations. The Average Daily Rate (ADR) for Airbnb in Malkerns typically peaks in December and dips lowest during March. Leveraging Airbnb dynamic pricing tools or strategies based on this seasonality can significantly boost revenue. Here's a look at the typical nightly rates achieved:
- Best-in-class properties (Top 10%) command rates of $144+ per night, often due to premium features or locations.
- Strong performing properties (Top 25%) achieve nightly rates of $94 or more.
- Typical properties (Median) charge around $77 per night.
- Entry-level properties (Bottom 25%) earn around $68 per night.
Average Daily Rate (ADR) Trend by Month in Malkerns
Get Live Malkerns Market Intelligence 👇
Explore Real-time Analytics
Airbnb Seasonality Analysis & Trends in Malkerns (2026)
Peak Season (April, December, May)
- Revenue averages $1,021 per month
- Occupancy rates average 33.7%
- Daily rates average $94
Shoulder Season
- Revenue averages $818 per month
- Occupancy maintains around 31.5%
- Daily rates hold near $96
Low Season (February, June, July)
- Revenue drops to average $638 per month
- Occupancy decreases to average 23.3%
- Daily rates adjust to average $89
Seasonality Insights for Malkerns
- The Airbnb seasonality in Malkerns shows moderate seasonality with distinct peak and low periods. While the sections above show seasonal averages, it's also insightful to look at the extremes:
- During the high season, the absolute peak month showcases Malkerns's highest earning potential, with monthly revenues capable of climbing to $1,071, occupancy reaching a high of 40.2%, and ADRs peaking at $105.
- Conversely, the slowest single month of the year, typically falling within the low season, marks the market's lowest point. In this month, revenue might dip to $587, occupancy could drop to 16.7%, and ADRs may adjust down to $85.
- Understanding both the seasonal averages and these monthly peaks and troughs in revenue, occupancy, and ADR is crucial for maximizing your Airbnb profit potential in Malkerns.
Seasonal Strategies for Maximizing Profit
- Peak Season: Maximize revenue through premium pricing and potentially longer minimum stays. Ensure high availability.
- Low Season: Offer competitive pricing, special promotions (e.g., extended stay discounts), and flexible cancellation policies. Target off-season travelers like remote workers or budget-conscious guests.
- Shoulder Seasons: Implement dynamic pricing that balances peak and low rates. Target weekend travelers or specific events. Offer slightly more flexible terms than peak season.
- Regularly analyze your own performance against these Malkerns seasonality benchmarks and adjust your pricing and availability strategy accordingly.
Best Areas for Airbnb Investment in Malkerns (2026)
Exploring the top neighborhoods for short-term rentals in Malkerns? This section highlights key areas, outlining why they are attractive for hosts and guests, along with notable local attractions. Consider these locations based on your target guest profile and investment strategy.
| Neighborhood / Area | Why Host Here? (Target Guests & Appeal) | Key Attractions & Landmarks |
|---|---|---|
| Malkerns Town | A growing town known for its beautiful lush landscapes and proximity to local attractions. Ideal for tourists looking to experience the natural beauty and cultural heritage of Eswatini. | Hlane Royal National Park, Malkerns Arts & Crafts Centre, Mlilwane Wildlife Sanctuary, Swazi Candles, Local Markets |
| Mbabane | The capital city of Eswatini, offering a mix of urban and cultural experiences. Attracts business travelers and tourists seeking local history and culture. | National Museum, Swazi Cultural Village, Mbabane Market, Lugogo Sun, Royal Swazi Spa |
| Lobamba | Historical and cultural hub of Eswatini, featuring significant sites and attractions. Perfect for those interested in Swazi culture and tradition. | Lobamba Royal Village, Ngwenya Glass, House of Parliament, King Sobhuza II Memorial Park, Traditional Swazi ceremonies |
| Hlatikulu | Located in the mountainous region, known for stunning views and cooler climate. A great base for nature lovers and hikers. | Hlatikulu Nature Reserve, Sibebe Rock, Base Camp, Hiking Trails, Bird Watching Spots |
| Piggs Peak | Known for its scenic beauty and proximity to the famous Piggs Peak Hotel. Attractive for visitors seeking tranquility and nature. | Piggs Peak Hotel, Nature Trails, Scenic Views, Local Artisans, Cultural Events |
| Siteki | Gateway to the eastern part of Eswatini, rich in farmlands and natural beauty. Great for visitors looking for an authentic Swazi experience. | Siteki Market, Local Farms, Nature Trails, Cultural Experiences, Traditional Swazi Cuisine |
| Thlangano | Quaint town close to nature reserves, favored by eco-tourists and those seeking a quieter getaway. | Local Nature Trails, Eco-lodges, Bird Watching, Community Projects, Cultural Experiences |
| Nhlangano | A vibrant town located in the southern part of Eswatini, known for its warm hospitality and local crafts. Ideal for cultural tourism. | Nhlangano Market, Local Handicrafts, Cultural Sites, Charming Guesthouses, Friendly Locals |
Understanding Airbnb License Requirements & STR Laws in Malkerns (2026)
While Malkerns, Manzini Region, Eswatini currently shows low STR regulations, specific Airbnb license requirements might still exist or change. Always verify the latest short term rental regulations and Airbnb license requirements directly with local government authorities for Malkerns to ensure full compliance before hosting.
(Source: AirROI data, 2026, finding no licensed listings among those analyzed)
Top Performing Airbnb Properties in Malkerns (2026)
Benchmark your potential! Explore examples of top-performing Airbnb properties in Malkernsbased on Trailing Twelve Month (TTM) revenue. Analyze their characteristics, revenue, occupancy rate, and ADR to understand what drives success in this market.

RoDo mountain view 1
Entire Place • 3 bedrooms

Modern Countryside Cottage
Entire Place • 2 bedrooms

Ligwalagwala Cottage
Entire Place • 3 bedrooms

The Pod House: An oasis of peace and green
Entire Place • 1 bedroom
Ngwempisi Mountain View House
Entire Place • 5 bedrooms

RoDo mountain view 3
Entire Place • 2 bedrooms
Note: Performance varies based on location, size, amenities, seasonality, and management quality. Data reflects the past 12 months.
Top Performing Airbnb Hosts in Malkerns (2026)
Learn from the best! This table showcases top-performing Airbnb hosts in Malkerns based on the number of properties managed and estimated total revenue over the past year. Analyze their scale and performance metrics.
| Host Name | Properties | Grossing Revenue | Stay Reviews | Avg Rating |
|---|---|---|---|---|
| Guy | 5 | $48,093 | 159 | 4.92/5.0 |
| Bartjan | 5 | $34,366 | 241 | 4.92/5.0 |
| Claudia | 3 | $28,515 | 447 | 4.83/5.0 |
| Els | 1 | $15,392 | 109 | 4.90/5.0 |
| Jane | 1 | $15,197 | 34 | 5.00/5.0 |
| Gerda | 1 | $10,161 | 26 | 4.69/5.0 |
| Wide Horizons | 2 | $7,313 | 11 | 5.00/5.0 |
| Stacy | 1 | $6,965 | 228 | 4.91/5.0 |
| Philippa | 1 | $6,081 | 72 | 4.89/5.0 |
| Iolanthe | 1 | $3,785 | 9 | 5.00/5.0 |
Analyzing the strategies of top hosts, such as their property selection, pricing, and guest communication, can offer valuable lessons for optimizing your own Airbnb operations in Malkerns.
Dive Deeper: Advanced Malkerns STR Market Data (2026)
Ready to unlock more insights? AirROI provides access to advanced metrics and comprehensive Airbnb data for Malkerns. Explore detailed analytics beyond this report to refine your investment strategy, optimize pricing, and maximize your vacation rental profits.
Explore Advanced MetricsMalkerns Short-Term Rental Market Composition (2026): Property & Room Types
Room Type Distribution
Property Type Distribution
Market Composition Insights for Malkerns
- The Malkerns Airbnb market composition is heavily skewed towards Entire Home/Apt listings, which make up 95.8% of the 24 active rentals. This indicates strong guest preference for privacy and space.
- Looking at the property type distribution in Malkerns, House properties are the most common (66.7%), reflecting the local real estate landscape.
- Houses represent a significant 66.7% portion, catering likely to families or larger groups.
- Smaller segments like hotel/boutique (combined 4.2%) offer potential for unique stay experiences.
Malkerns Airbnb Room Capacity Analysis (2026): Bedroom Distribution
Distribution of Listings by Number of Bedrooms
Room Capacity Insights for Malkerns
- The dominant room capacity in Malkerns is 1 bedroom listings, making up 45.8% of the market. This suggests a strong demand for properties suitable for couples or solo travelers.
- Together, 1 bedroom and 2 bedrooms properties represent 87.5% of the active Airbnb listings in Malkerns, indicating a high concentration in these sizes.
Malkerns Vacation Rental Guest Capacity Trends (2026)
Distribution of Listings by Guest Capacity
Guest Capacity Insights for Malkerns
- The most common guest capacity trend in Malkerns vacation rentals is listings accommodating 2 guests (37.5%). This suggests the primary traveler segment is likely couples or solo travelers.
- Properties designed for 2 guests and 4 guests dominate the Malkerns STR market, accounting for 75.0% of listings.
- 12.5% of properties accommodate 6+ guests, serving the market segment for larger families or group travel in Malkerns.
- On average, properties in Malkerns are equipped to host 3.5 guests.
Malkerns Airbnb Booking Patterns (2026): Available vs. Booked Days
Available Days Distribution
Booked Days Distribution
Booking Pattern Insights for Malkerns
- The most common availability pattern in Malkerns falls within the 271-366 days range, representing 70.8% of listings. This suggests many properties have significant open periods on their calendars.
- Approximately 95.8% of listings show high availability (181+ days open annually), indicating potential for increased bookings or specific owner usage patterns.
- For booked days, the 31-90 days range is most frequent in Malkerns (58.3%), reflecting common guest stay durations or potential owner blocking patterns.
- A notable 4.2% of properties secure long booking periods (181+ days booked per year), highlighting successful long-term rental strategies or significant owner usage.
Malkerns Airbnb Minimum Stay Requirements Analysis
Distribution of Listings by Minimum Night Requirement
1 Night
19 listings
79.2% of total
2 Nights
3 listings
12.5% of total
30+ Nights
2 listings
8.3% of total
Key Insights
- The most prevalent minimum stay requirement in Malkerns is 1 Night, adopted by 79.2% of listings. This highlights the market's preference for shorter, flexible bookings.
- A strong majority (91.7%) of the Malkerns Airbnb data shows acceptance of very short stays (1-2 nights), indicating a dynamic, high-turnover market.
Recommendations
- Align with the market by considering a 1 Night minimum stay, as 79.2% of Malkerns hosts use this setting.
- Explore offering discounts for stays of 30+ nights to attract the 8.3% of the market seeking extended stays.
- Adjust minimum nights based on seasonality – potentially shorter during low season and longer during peak demand periods in Malkerns.
Malkerns Airbnb Cancellation Policy Trends Analysis (2026)
Non-refundable
1 listings
4.2% of total
Refundable
2 listings
8.3% of total
Flexible
11 listings
45.8% of total
Moderate
8 listings
33.3% of total
Firm
2 listings
8.3% of total
Cancellation Policy Insights for Malkerns
- The prevailing Airbnb cancellation policy trend in Malkerns is Flexible, used by 45.8% of listings.
- The market strongly favors guest-friendly terms, with 79.1% of listings offering Flexible or Moderate policies. This suggests guests in Malkerns may expect booking flexibility.
Recommendations for Hosts
- Consider adopting a Flexible policy to align with the 45.8% market standard in Malkerns.
- Regularly review your cancellation policy against competitors and market demand shifts in Malkerns.
Malkerns STR Booking Lead Time Analysis (2026)
Average Booking Lead Time by Month
Booking Lead Time Insights for Malkerns
- The overall average booking lead time for vacation rentals in Malkerns is 65 days.
- Guests book furthest in advance for stays during May (average 130 days), likely coinciding with peak travel demand or local events.
- The shortest booking windows occur for stays in February (average 23 days), indicating more last-minute travel plans during this time.
- Seasonally, Spring (82 days avg.) sees the longest lead times, while Fall (37 days avg.) has the shortest, reflecting typical travel planning cycles.
Recommendations for Hosts
- Use the overall average lead time (65 days) as a baseline for your pricing and availability strategy in Malkerns.
- For May stays, consider implementing length-of-stay discounts or slightly higher rates for bookings made less than 130 days out to capitalize on advance planning.
- Target marketing efforts for the Spring season well in advance (at least 82 days) to capture early planners.
- Monitor your own booking lead times against these Malkerns averages to identify opportunities for dynamic pricing adjustments.
Popular & Essential Airbnb Amenities in Malkerns (2026)
Amenity Prevalence
Amenity Insights for Malkerns
- Essential amenities in Malkerns that guests expect include: Free parking on premises, Wifi, Kitchen, Cooking basics. Lacking these (any) could significantly impact bookings.
- Popular amenities like Hangers, BBQ grill, Iron are common but not universal. Offering these can provide a competitive edge.
Recommendations for Hosts
- Ensure your listing includes all essential amenities for Malkerns: Free parking on premises, Wifi, Kitchen, Cooking basics.
- Prioritize adding missing essentials: Wifi, Kitchen, Cooking basics.
- Consider adding popular differentiators like Hangers or BBQ grill to increase appeal.
- Highlight unique or less common amenities you offer (e.g., hot tub, dedicated workspace, EV charger) in your listing description and photos.
- Regularly check competitor amenities in Malkerns to stay competitive.
Malkerns Airbnb Guest Demographics & Profile Analysis (2026)
Guest Profile Summary for Malkerns
- The typical guest profile for Airbnb in Malkerns consists of predominantly international visitors (94%), with top international origins including Mozambique, typically belonging to the Post-2000s (Gen Z/Alpha) group (50%), primarily speaking English or French.
- Domestic travelers account for 5.6% of guests.
- Key international markets include South Africa (42.1%) and Mozambique (8.2%).
- Top languages spoken are English (51%) followed by French (10.1%).
- A significant demographic segment is the Post-2000s (Gen Z/Alpha) group, representing 50% of guests.
Recommendations for Hosts
- Focus marketing internationally, particularly towards travelers from Mozambique.
- Tailor amenities and listing descriptions to appeal to the dominant Post-2000s (Gen Z/Alpha) demographic (e.g., highlight fast WiFi, smart home features, local guides).
- Highlight unique local experiences or amenities relevant to the primary guest profile.
- Consider seasonal promotions aligned with peak travel times for key origin markets.
Nearby Short-Term Rental Market Comparison
How does the Malkerns Airbnb market stack up against its neighbors? Compare key performance metrics like average monthly revenue, ADR, and occupancy rates in surrounding areas to understand the broader regional STR landscape.
| Market | Active Properties | Monthly Revenue | Daily Rate | Avg. Occupancy |
|---|---|---|---|---|
| Nkomazi | 476 | $1,591 | $160.35 | 36% |
| Malongane | 53 | $1,325 | $218.75 | 25% |
| Emakhazeni Local Municipality | 343 | $1,141 | $158.07 | 25% |
| Ponta do Ouro | 133 | $972 | $190.96 | 22% |
| Dullstroom | 10 | $936 | $213.06 | 27% |
| The Big Five False Bay Local Municipality | 55 | $763 | $109.36 | 27% |
| Marloth Park | 19 | $694 | $150.22 | 30% |
| Mbombela | 539 | $613 | $100.48 | 25% |
| Lobamba | 11 | $481 | $105.75 | 17% |
| Umjindi Local Municipality | 11 | $465 | $65.57 | 22% |