Pärnu linn Airbnb Market Analysis 2026: Short Term Rental Data & Vacation Rental Statistics in Pärnu County, Estonia
Is Airbnb profitable in Pärnu linn in 2026? Explore comprehensive Airbnb analytics for Pärnu linn, Pärnu County, Estonia to uncover income potential. This 2026 STR market report for Pärnu linn, based on AirROI data from February 2025 to January 2026, reveals key trends in the market of 424 active listings.
Whether you're considering an Airbnb investment in Pärnu linn, optimizing your existing vacation rental, or exploring rental arbitrage opportunities, understanding the Pärnu linn Airbnb data is crucial. Leveraging the low regulation environment is key to maximizing your short term rental income potential. Let's dive into the specifics.
Key Pärnu linn Airbnb Performance Metrics Overview
Monthly Airbnb Revenue Variations & Income Potential in Pärnu linn (2026)
Understanding the monthly revenue variations for Airbnb listings in Pärnu linn is key to maximizing your short term rental income potential. Seasonality significantly impacts earnings. Our analysis, based on data from the past 12 months, shows that the peak revenue month for STRs in Pärnu linn is typically July, while January often presents the lowest earnings, highlighting opportunities for strategic pricing adjustments during shoulder and low seasons. Explore the typical Airbnb income in Pärnu linn across different performance tiers:
- Best-in-class properties (Top 10%) achieve $2,266+ monthly, often utilizing dynamic pricing and superior guest experiences.
- Strong performing properties (Top 25%) earn $1,376 or more, indicating effective management and desirable locations/amenities.
- Typical properties (Median) generate around $747 per month, representing the average market performance.
- Entry-level properties (Bottom 25%) see earnings around $373, often with potential for optimization.
Average Monthly Airbnb Earnings Trend in Pärnu linn
Pärnu linn Airbnb Occupancy Rate Trends (2026)
Maximize your bookings by understanding the Pärnu linn STR occupancy trends. Seasonal demand shifts significantly influence how often properties are booked. Typically, Julysees the highest demand (peak season occupancy), while January experiences the lowest (low season). Effective strategies, like adjusting minimum stays or offering promotions, can boost occupancy during slower periods. Here's how different property tiers perform in Pärnu linn:
- Best-in-class properties (Top 10%) achieve 60%+ occupancy, indicating high desirability and potentially optimized availability.
- Strong performing properties (Top 25%) maintain 42% or higher occupancy, suggesting good market fit and guest satisfaction.
- Typical properties (Median) have an occupancy rate around 24%.
- Entry-level properties (Bottom 25%) average 11% occupancy, potentially facing higher vacancy.
Average Monthly Occupancy Rate Trend in Pärnu linn
Average Daily Rate (ADR) Airbnb Trends in Pärnu linn (2026)
Effective short term rental pricing strategy in Pärnu linn involves understanding monthly ADR fluctuations. The Average Daily Rate (ADR) for Airbnb in Pärnu linn typically peaks in July and dips lowest during March. Leveraging Airbnb dynamic pricing tools or strategies based on this seasonality can significantly boost revenue. Here's a look at the typical nightly rates achieved:
- Best-in-class properties (Top 10%) command rates of $217+ per night, often due to premium features or locations.
- Strong performing properties (Top 25%) achieve nightly rates of $143 or more.
- Typical properties (Median) charge around $101 per night.
- Entry-level properties (Bottom 25%) earn around $74 per night.
Average Daily Rate (ADR) Trend by Month in Pärnu linn
Get Live Pärnu linn Market Intelligence 👇

Explore Real-time Analytics
Airbnb Seasonality Analysis & Trends in Pärnu linn (2026)
Peak Season (July, June, August)
- Revenue averages $1,927 per month
- Occupancy rates average 42.3%
- Daily rates average $143
Shoulder Season
- Revenue averages $874 per month
- Occupancy maintains around 26.0%
- Daily rates hold near $124
Low Season (January, February, November)
- Revenue drops to average $567 per month
- Occupancy decreases to average 20.9%
- Daily rates adjust to average $123
Seasonality Insights for Pärnu linn
- The Airbnb seasonality in Pärnu linn shows highly seasonal trends requiring careful strategy. While the sections above show seasonal averages, it's also insightful to look at the extremes:
- During the high season, the absolute peak month showcases Pärnu linn's highest earning potential, with monthly revenues capable of climbing to $2,787, occupancy reaching a high of 55.7%, and ADRs peaking at $152.
- Conversely, the slowest single month of the year, typically falling within the low season, marks the market's lowest point. In this month, revenue might dip to $476, occupancy could drop to 17.4%, and ADRs may adjust down to $114.
- Understanding both the seasonal averages and these monthly peaks and troughs in revenue, occupancy, and ADR is crucial for maximizing your Airbnb profit potential in Pärnu linn.
Seasonal Strategies for Maximizing Profit
- Peak Season: Maximize revenue through premium pricing and potentially longer minimum stays. Ensure high availability.
- Low Season: Offer competitive pricing, special promotions (e.g., extended stay discounts), and flexible cancellation policies. Target off-season travelers like remote workers or budget-conscious guests.
- Shoulder Seasons: Implement dynamic pricing that balances peak and low rates. Target weekend travelers or specific events. Offer slightly more flexible terms than peak season.
- Regularly analyze your own performance against these Pärnu linn seasonality benchmarks and adjust your pricing and availability strategy accordingly.
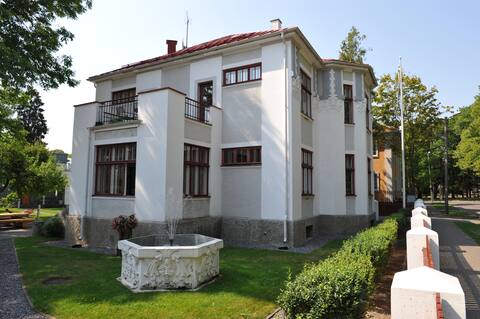
Best Areas for Airbnb Investment in Pärnu linn (2026)
Exploring the top neighborhoods for short-term rentals in Pärnu linn? This section highlights key areas, outlining why they are attractive for hosts and guests, along with notable local attractions. Consider these locations based on your target guest profile and investment strategy.
| Neighborhood / Area | Why Host Here? (Target Guests & Appeal) | Key Attractions & Landmarks |
|---|---|---|
| Pärnu Beach | Pärnu Beach is the most popular resort area in Estonia, known for its sandy beaches and bustling summer atmosphere. Ideal for families and beach goers looking for sun, relaxation, and a vibrant local culture. | Pärnu Beach, Pärnu Promenade, Pärnu water park, Endla Theatre, Pärnu Museum, Vabaaking Beach |
| Old Town | The Old Town of Pärnu features charming historical architecture and a quaint atmosphere. It's popular with tourists interested in culture and history, providing access to local cafes, boutiques, and the scenic Old City. | Pärnu Cathedrals, Red Tower, Tallinn Gate, Rüütli Street, Pärnu Museum, Old Town Hall |
| Vana-Pärnu | An area known for its peaceful environment and proximity to nature, Vana-Pärnu appeals to those looking for a quiet retreat while being close to the city center. Great for vacationers who appreciate tranquility and scenic views. | Pärnu River, Vana-Pärnu Park, Koidula Park, Kihnu Island connections, Nature trails |
| Sillaotsa | A burgeoning neighborhood known for its diverse housing and local amenities. It's become increasingly popular among young professionals looking for affordable yet convenient living options close to the beach and city center. | Public parks, Local cafes, Shopping facilities, Proximity to beaches |
| Kihnu Street | Kihnu Street runs through the heart of Pärnu and is bustling with local shops, restaurants, and cafes. It's a vibrant area that attracts both tourists and locals, making it a prime spot for Airbnb investments. | Cafés and restaurants, Local shops, Art galleries, Cultural events, Easy beach access |
| Rääma | This residential area is known for its family-friendly environment and community feel. It appeals to larger groups and families looking for spacious accommodation away from the tourist crowds. | Residential parks, Family activities, Close to local amenities, Quiet environment |
| Pärnu Port | Pärnu Port is known for its charming marina and waterfront activities. It attracts visitors interested in boating, sailing, and enjoying a picturesque harbor atmosphere. | Pärnu Marina, Boat rentals, Fish markets, Nearby restaurants, Waterfront parks |
| Pärnu Spa District | Famous for its health and wellness tourism, the Pärnu Spa District offers various wellness centers and hotels. Ideal for guests seeking relaxation and spa treatments, making it a high-demand area. | SPA hotels, Wellness centers, Saunas, Beach access, Health tourism activities |
Understanding Airbnb License Requirements & STR Laws in Pärnu linn (2026)
While Pärnu linn, Pärnu County, Estonia currently shows low STR regulations, specific Airbnb license requirements might still exist or change. Always verify the latest short term rental regulations and Airbnb license requirements directly with local government authorities for Pärnu linn to ensure full compliance before hosting.
(Source: AirROI data, 2026, finding no licensed listings among those analyzed)
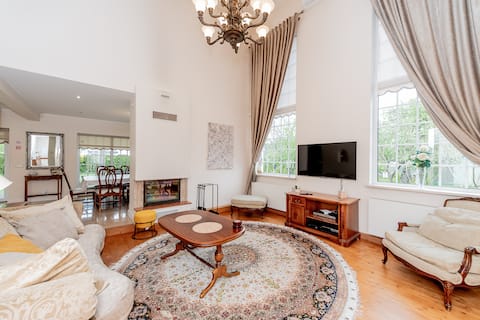
Top Performing Airbnb Properties in Pärnu linn (2026)
Benchmark your potential! Explore examples of top-performing Airbnb properties in Pärnu linnbased on Trailing Twelve Month (TTM) revenue. Analyze their characteristics, revenue, occupancy rate, and ADR to understand what drives success in this market.
Villa Meri
Entire Place • 8 bedrooms

2 BR Penthouse for 6 pax w/ Kitchen & Roof Terrace
Entire Place • N/A
3- bedroom Villa, walking distance from the beach.
Entire Place • 3 bedrooms

2-bedroom, huge fenced yard, sauna, 10 min - Pärnu
Entire Place • 2 bedrooms

Pärnu Luxury Penthouse
Entire Place • 3 bedrooms

Cozy, private sauna house in Pärnu
Entire Place • 4 bedrooms
Note: Performance varies based on location, size, amenities, seasonality, and management quality. Data reflects the past 12 months.
Top Performing Airbnb Hosts in Pärnu linn (2026)
Learn from the best! This table showcases top-performing Airbnb hosts in Pärnu linn based on the number of properties managed and estimated total revenue over the past year. Analyze their scale and performance metrics.
| Host Name | Properties | Grossing Revenue | Stay Reviews | Avg Rating |
|---|---|---|---|---|
| Elena | 11 | $96,482 | 191 | 4.84/5.0 |
| Bob W Pärnu | 3 | $70,543 | 146 | 4.83/5.0 |
| Pille | 4 | $67,243 | 40 | 4.73/5.0 |
| Kaidi | 4 | $65,024 | 458 | 4.80/5.0 |
| Marten | 2 | $48,040 | 458 | 4.84/5.0 |
| Heike | 3 | $45,356 | 150 | 4.92/5.0 |
| Liine | 3 | $40,612 | 129 | 4.91/5.0 |
| Tempus Te | 3 | $39,225 | 34 | 4.88/5.0 |
| Zlata | 1 | $36,758 | 25 | 5.00/5.0 |
| Eleri | 1 | $36,726 | 99 | 4.89/5.0 |
Analyzing the strategies of top hosts, such as their property selection, pricing, and guest communication, can offer valuable lessons for optimizing your own Airbnb operations in Pärnu linn.
Dive Deeper: Advanced Pärnu linn STR Market Data (2026)
Ready to unlock more insights? AirROI provides access to advanced metrics and comprehensive Airbnb data for Pärnu linn. Explore detailed analytics beyond this report to refine your investment strategy, optimize pricing, and maximize your vacation rental profits.
Explore Advanced MetricsPärnu linn Short-Term Rental Market Composition (2026): Property & Room Types
Room Type Distribution
Property Type Distribution
Market Composition Insights for Pärnu linn
- The Pärnu linn Airbnb market composition is heavily skewed towards Entire Home/Apt listings, which make up 95.8% of the 424 active rentals. This indicates strong guest preference for privacy and space.
- Looking at the property type distribution in Pärnu linn, Apartment/Condo properties are the most common (80.7%), reflecting the local real estate landscape.
- Smaller segments like hotel/boutique, outdoor/unique, others, unique stays (combined 6.5%) offer potential for unique stay experiences.
Pärnu linn Airbnb Room Capacity Analysis (2026): Bedroom Distribution
Distribution of Listings by Number of Bedrooms
Room Capacity Insights for Pärnu linn
- The dominant room capacity in Pärnu linn is 1 bedroom listings, making up 56.1% of the market. This suggests a strong demand for properties suitable for couples or solo travelers.
- Together, 1 bedroom and 2 bedrooms properties represent 77.6% of the active Airbnb listings in Pärnu linn, indicating a high concentration in these sizes.
- With over half the market (56.1%) consisting of studios or 1-bedroom units, Pärnu linn is particularly well-suited for individuals or couples.
Pärnu linn Vacation Rental Guest Capacity Trends (2026)
Distribution of Listings by Guest Capacity
Guest Capacity Insights for Pärnu linn
- The most common guest capacity trend in Pärnu linn vacation rentals is listings accommodating 4 guests (37%). This suggests the primary traveler segment is likely small families or groups.
- Properties designed for 4 guests and 2 guests dominate the Pärnu linn STR market, accounting for 55.9% of listings.
- 22.7% of properties accommodate 6+ guests, serving the market segment for larger families or group travel in Pärnu linn.
- On average, properties in Pärnu linn are equipped to host 4.1 guests.
Pärnu linn Airbnb Booking Patterns (2026): Available vs. Booked Days
Available Days Distribution
Booked Days Distribution
Booking Pattern Insights for Pärnu linn
- The most common availability pattern in Pärnu linn falls within the 271-366 days range, representing 78.3% of listings. This suggests many properties have significant open periods on their calendars.
- Approximately 98.1% of listings show high availability (181+ days open annually), indicating potential for increased bookings or specific owner usage patterns.
- For booked days, the 31-90 days range is most frequent in Pärnu linn (48.8%), reflecting common guest stay durations or potential owner blocking patterns.
- A notable 2.4% of properties secure long booking periods (181+ days booked per year), highlighting successful long-term rental strategies or significant owner usage.
Pärnu linn Airbnb Minimum Stay Requirements Analysis
Distribution of Listings by Minimum Night Requirement
1 Night
129 listings
30.4% of total
2 Nights
132 listings
31.1% of total
3 Nights
21 listings
5% of total
4-6 Nights
9 listings
2.1% of total
7-29 Nights
3 listings
0.7% of total
30+ Nights
130 listings
30.7% of total
Key Insights
- The most prevalent minimum stay requirement in Pärnu linn is 2 Nights, adopted by 31.1% of listings. This highlights the market's preference for shorter, flexible bookings.
- A strong majority (61.5%) of the Pärnu linn Airbnb data shows acceptance of very short stays (1-2 nights), indicating a dynamic, high-turnover market.
- A significant segment (30.7%) caters to monthly stays (30+ nights) in Pärnu linn, pointing to opportunities in the extended-stay market.
Recommendations
- Align with the market by considering a 2 Nights minimum stay, as 31.1% of Pärnu linn hosts use this setting.
- Explore offering discounts for stays of 30+ nights to attract the 30.7% of the market seeking extended stays.
- Adjust minimum nights based on seasonality – potentially shorter during low season and longer during peak demand periods in Pärnu linn.
Pärnu linn Airbnb Cancellation Policy Trends Analysis (2026)
Flexible
145 listings
34.3% of total
Moderate
161 listings
38.1% of total
Firm
92 listings
21.7% of total
Strict
25 listings
5.9% of total
Cancellation Policy Insights for Pärnu linn
- The prevailing Airbnb cancellation policy trend in Pärnu linn is Moderate, used by 38.1% of listings.
- The market strongly favors guest-friendly terms, with 72.4% of listings offering Flexible or Moderate policies. This suggests guests in Pärnu linn may expect booking flexibility.
- Strict cancellation policies are quite rare (5.9%), potentially making listings with this policy less competitive unless justified by high demand or property type.
Recommendations for Hosts
- Consider adopting a Moderate policy to align with the 38.1% market standard in Pärnu linn.
- Using a Strict policy might deter some guests, as only 5.9% of listings use it. Evaluate if potential revenue protection outweighs possible lower booking rates.
- Regularly review your cancellation policy against competitors and market demand shifts in Pärnu linn.
Pärnu linn STR Booking Lead Time Analysis (2026)
Average Booking Lead Time by Month
Booking Lead Time Insights for Pärnu linn
- The overall average booking lead time for vacation rentals in Pärnu linn is 47 days.
- Guests book furthest in advance for stays during July (average 68 days), likely coinciding with peak travel demand or local events.
- The shortest booking windows occur for stays in February (average 15 days), indicating more last-minute travel plans during this time.
- Seasonally, Summer (57 days avg.) sees the longest lead times, while Fall (26 days avg.) has the shortest, reflecting typical travel planning cycles.
Recommendations for Hosts
- Use the overall average lead time (47 days) as a baseline for your pricing and availability strategy in Pärnu linn.
- For July stays, consider implementing length-of-stay discounts or slightly higher rates for bookings made less than 68 days out to capitalize on advance planning.
- Target marketing efforts for the Summer season well in advance (at least 57 days) to capture early planners.
- Monitor your own booking lead times against these Pärnu linn averages to identify opportunities for dynamic pricing adjustments.
Popular & Essential Airbnb Amenities in Pärnu linn (2026)
Amenity Prevalence
Amenity Insights for Pärnu linn
- Popular amenities like Kitchen, Wifi, Smoke alarm are common but not universal. Offering these can provide a competitive edge.
- Warning: Wifi is not universally provided but is considered essential globally. Ensure reliable Wifi is offered.
Recommendations for Hosts
- Consider adding popular differentiators like Kitchen or Wifi to increase appeal.
- Highlight unique or less common amenities you offer (e.g., hot tub, dedicated workspace, EV charger) in your listing description and photos.
- Regularly check competitor amenities in Pärnu linn to stay competitive.
Pärnu linn Airbnb Guest Demographics & Profile Analysis (2026)
Guest Profile Summary for Pärnu linn
- The typical guest profile for Airbnb in Pärnu linn consists of predominantly international visitors (74%), with top international origins including Estonia, typically belonging to the Post-2000s (Gen Z/Alpha) group (50%), primarily speaking English or Finnish.
- Domestic travelers account for 25.8% of guests.
- Key international markets include Finland (37.1%) and Estonia (25.8%).
- Top languages spoken are English (39.9%) followed by Finnish (16.2%).
- A significant demographic segment is the Post-2000s (Gen Z/Alpha) group, representing 50% of guests.
Recommendations for Hosts
- Focus marketing internationally, particularly towards travelers from Estonia.
- Tailor amenities and listing descriptions to appeal to the dominant Post-2000s (Gen Z/Alpha) demographic (e.g., highlight fast WiFi, smart home features, local guides).
- Highlight unique local experiences or amenities relevant to the primary guest profile.
- Consider seasonal promotions aligned with peak travel times for key origin markets.
Nearby Short-Term Rental Market Comparison
How does the Pärnu linn Airbnb market stack up against its neighbors? Compare key performance metrics like average monthly revenue, ADR, and occupancy rates in surrounding areas to understand the broader regional STR landscape.
| Market | Active Properties | Monthly Revenue | Daily Rate | Avg. Occupancy |
|---|---|---|---|---|
| Vārzas | 11 | $1,793 | $146.74 | 42% |
| Līgatnes pagasts | 12 | $1,617 | $303.62 | 33% |
| Lääne-Harju vald | 44 | $1,563 | $202.17 | 32% |
| Krimuldas pagasts | 15 | $1,317 | $218.71 | 27% |
| Häädemeeste vald | 19 | $1,306 | $153.81 | 38% |
| Jõelähtme vald | 23 | $1,297 | $173.06 | 29% |
| Lääneranna vald | 24 | $1,273 | $175.69 | 27% |
| Drabešu pagasts | 31 | $1,237 | $175.64 | 28% |
| Harku vald | 30 | $1,195 | $135.14 | 37% |
| Viljandi vald | 11 | $1,178 | $233.03 | 25% |