Dahab Airbnb Market Analysis 2026: Short Term Rental Data & Vacation Rental Statistics in South Sinai, Egypt
Is Airbnb profitable in Dahab in 2026? Explore comprehensive Airbnb analytics for Dahab, South Sinai, Egypt to uncover income potential. This 2026 STR market report for Dahab, based on AirROI data from February 2025 to January 2026, reveals key trends in the market of 837 active listings.
Whether you're considering an Airbnb investment in Dahab, optimizing your existing vacation rental, or exploring rental arbitrage opportunities, understanding the Dahab Airbnb data is crucial. Leveraging the low regulation environment is key to maximizing your short term rental income potential. Let's dive into the specifics.
Key Dahab Airbnb Performance Metrics Overview
Monthly Airbnb Revenue Variations & Income Potential in Dahab (2026)
Understanding the monthly revenue variations for Airbnb listings in Dahab is key to maximizing your short term rental income potential. Seasonality significantly impacts earnings. Our analysis, based on data from the past 12 months, shows that the peak revenue month for STRs in Dahab is typically November, while June often presents the lowest earnings, highlighting opportunities for strategic pricing adjustments during shoulder and low seasons. Explore the typical Airbnb income in Dahab across different performance tiers:
- Best-in-class properties (Top 10%) achieve $1,346+ monthly, often utilizing dynamic pricing and superior guest experiences.
- Strong performing properties (Top 25%) earn $813 or more, indicating effective management and desirable locations/amenities.
- Typical properties (Median) generate around $419 per month, representing the average market performance.
- Entry-level properties (Bottom 25%) see earnings around $178, often with potential for optimization.
Average Monthly Airbnb Earnings Trend in Dahab
Dahab Airbnb Occupancy Rate Trends (2026)
Maximize your bookings by understanding the Dahab STR occupancy trends. Seasonal demand shifts significantly influence how often properties are booked. Typically, Novembersees the highest demand (peak season occupancy), while July experiences the lowest (low season). Effective strategies, like adjusting minimum stays or offering promotions, can boost occupancy during slower periods. Here's how different property tiers perform in Dahab:
- Best-in-class properties (Top 10%) achieve 83%+ occupancy, indicating high desirability and potentially optimized availability.
- Strong performing properties (Top 25%) maintain 64% or higher occupancy, suggesting good market fit and guest satisfaction.
- Typical properties (Median) have an occupancy rate around 37%.
- Entry-level properties (Bottom 25%) average 17% occupancy, potentially facing higher vacancy.
Average Monthly Occupancy Rate Trend in Dahab
Average Daily Rate (ADR) Airbnb Trends in Dahab (2026)
Effective short term rental pricing strategy in Dahab involves understanding monthly ADR fluctuations. The Average Daily Rate (ADR) for Airbnb in Dahab typically peaks in September and dips lowest during March. Leveraging Airbnb dynamic pricing tools or strategies based on this seasonality can significantly boost revenue. Here's a look at the typical nightly rates achieved:
- Best-in-class properties (Top 10%) command rates of $82+ per night, often due to premium features or locations.
- Strong performing properties (Top 25%) achieve nightly rates of $52 or more.
- Typical properties (Median) charge around $35 per night.
- Entry-level properties (Bottom 25%) earn around $24 per night.
Average Daily Rate (ADR) Trend by Month in Dahab
Get Live Dahab Market Intelligence 👇

Explore Real-time Analytics
Airbnb Seasonality Analysis & Trends in Dahab (2026)
Peak Season (November, October, April)
- Revenue averages $748 per month
- Occupancy rates average 50.0%
- Daily rates average $45
Shoulder Season
- Revenue averages $581 per month
- Occupancy maintains around 40.4%
- Daily rates hold near $44
Low Season (January, June, July)
- Revenue drops to average $531 per month
- Occupancy decreases to average 34.4%
- Daily rates adjust to average $45
Seasonality Insights for Dahab
- The Airbnb seasonality in Dahab shows moderate seasonality with distinct peak and low periods. While the sections above show seasonal averages, it's also insightful to look at the extremes:
- During the high season, the absolute peak month showcases Dahab's highest earning potential, with monthly revenues capable of climbing to $800, occupancy reaching a high of 52.6%, and ADRs peaking at $46.
- Conversely, the slowest single month of the year, typically falling within the low season, marks the market's lowest point. In this month, revenue might dip to $523, occupancy could drop to 34.0%, and ADRs may adjust down to $43.
- Understanding both the seasonal averages and these monthly peaks and troughs in revenue, occupancy, and ADR is crucial for maximizing your Airbnb profit potential in Dahab.
Seasonal Strategies for Maximizing Profit
- Peak Season: Maximize revenue through premium pricing and potentially longer minimum stays. Ensure high availability.
- Low Season: Offer competitive pricing, special promotions (e.g., extended stay discounts), and flexible cancellation policies. Target off-season travelers like remote workers or budget-conscious guests.
- Shoulder Seasons: Implement dynamic pricing that balances peak and low rates. Target weekend travelers or specific events. Offer slightly more flexible terms than peak season.
- Regularly analyze your own performance against these Dahab seasonality benchmarks and adjust your pricing and availability strategy accordingly.
Best Areas for Airbnb Investment in Dahab (2026)
Exploring the top neighborhoods for short-term rentals in Dahab? This section highlights key areas, outlining why they are attractive for hosts and guests, along with notable local attractions. Consider these locations based on your target guest profile and investment strategy.
| Neighborhood / Area | Why Host Here? (Target Guests & Appeal) | Key Attractions & Landmarks |
|---|---|---|
| Blue Hole | A world-renowned diving site attracting divers from around the globe. The stunning natural beauty and rich marine life make it ideal for tourists seeking adventure and exploration. | Blue Hole Diving Site, Canyon Dive Site, Dahab's Coral Reefs, Mount Sinai, Wadi Rum excursions |
| Laguna Beach | A tranquil area known for its stunning beaches and relaxed atmosphere. Popular among families and those looking to unwind in a picturesque setting. | Laguna Beach, Desert Divers, Laguna Coral Reef, Nearby Bedouin Camps, Camel Rides |
| Mashraba | A vibrant area filled with shops, cafes, and a lively atmosphere. It’s a central spot for tourists to enjoy local culture and cuisine. | Mashraba Market, Cafes and Restaurants, Dahab City Center, Local Art Shops, Cultural Festivals |
| Assalah | A charming area with beachfront access, perfect for visitors looking for a laid-back vibe and natural beauty. Offers great sunset views and local eateries. | Assalah Beach, Sunset Views, Local Fish Restaurants, Yoga Retreats, Snorkeling Spots |
| Dahab Town Center | The heart of Dahab, bustling with shops, restaurants, and entertainment. Ideal for attracting tourists who want to be close to all the action. | Shopping District, The Lagoon, Dahab's Nightlife, Local Markets, Cultural Experiences |
| Blue Lagoon | A serene spot known for its stunning views and clear waters. Great for those looking for a quieter stay near beautiful natural settings. | Blue Lagoon Beach, Snorkeling Areas, Camping Spots, Kayaking Tours, Natural Springs |
| The Lighthouse | An iconic location known for its vibrant atmosphere and water sports, particularly windsurfing. Attracts adventure enthusiasts and water sport lovers. | The Lighthouse Beach, Windsurfing Lessons, Local Restaurants, Water Sports Rentals, Boardwalk |
| Dahab Bay | A picturesque bay area known for its calm waters and natural beauty. Perfect for families and couples seeking a relaxing getaway. | Dahab Bay Beach, Waterfront Dining, Beach Clubs, Cultural Sites, Recreational Activities |
Understanding Airbnb License Requirements & STR Laws in Dahab (2026)
While Dahab, South Sinai, Egypt currently shows low STR regulations, specific Airbnb license requirements might still exist or change. Always verify the latest short term rental regulations and Airbnb license requirements directly with local government authorities for Dahab to ensure full compliance before hosting.
(Source: AirROI data, 2026, based on 0% licensed listings)
Top Performing Airbnb Properties in Dahab (2026)
Benchmark your potential! Explore examples of top-performing Airbnb properties in Dahabbased on Trailing Twelve Month (TTM) revenue. Analyze their characteristics, revenue, occupancy rate, and ADR to understand what drives success in this market.

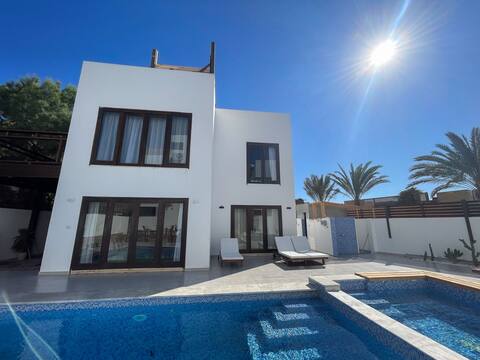
Villa Faris, Beach Villa with Pool, Dahab Asalah
Entire Place • 3 bedrooms
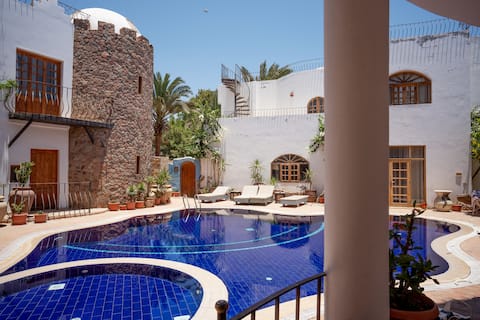
Villa Blanca Assala
Entire Place • 4 bedrooms

American Villa Dahab
Entire Place • 3 bedrooms

Stand alone(Blueberry&Raspberry)
Entire Place • 4 bedrooms

Beit Theresa - Tree House (Panorama Sea View)
Private Room • N/A
Redrock Poolside & Beachside Oasis Apartment
Entire Place • 3 bedrooms
Note: Performance varies based on location, size, amenities, seasonality, and management quality. Data reflects the past 12 months.
Top Performing Airbnb Hosts in Dahab (2026)
Learn from the best! This table showcases top-performing Airbnb hosts in Dahab based on the number of properties managed and estimated total revenue over the past year. Analyze their scale and performance metrics.
| Host Name | Properties | Grossing Revenue | Stay Reviews | Avg Rating |
|---|---|---|---|---|
| Peno | 13 | $193,326 | 346 | 4.89/5.0 |
| Mahmoud | 19 | $118,871 | 199 | 4.90/5.0 |
| Micheal | 15 | $113,896 | 749 | 4.98/5.0 |
| Nadja | 6 | $105,689 | 167 | 4.98/5.0 |
| Mo | 7 | $85,616 | 722 | 4.99/5.0 |
| Mohamed | 11 | $81,112 | 301 | 4.77/5.0 |
| Mimi & Mamdouh | 4 | $80,793 | 142 | 4.92/5.0 |
| Aid | 13 | $80,613 | 625 | 4.78/5.0 |
| Rasha | 5 | $79,266 | 606 | 4.81/5.0 |
| Kamal | 6 | $78,278 | 212 | 4.88/5.0 |
Analyzing the strategies of top hosts, such as their property selection, pricing, and guest communication, can offer valuable lessons for optimizing your own Airbnb operations in Dahab.
Dive Deeper: Advanced Dahab STR Market Data (2026)
Ready to unlock more insights? AirROI provides access to advanced metrics and comprehensive Airbnb data for Dahab. Explore detailed analytics beyond this report to refine your investment strategy, optimize pricing, and maximize your vacation rental profits.
Explore Advanced MetricsDahab Short-Term Rental Market Composition (2026): Property & Room Types
Room Type Distribution
Property Type Distribution
Market Composition Insights for Dahab
- The Dahab Airbnb market composition is heavily skewed towards Entire Home/Apt listings, which make up 81.6% of the 837 active rentals. This indicates strong guest preference for privacy and space.
- Looking at the property type distribution in Dahab, Apartment/Condo properties are the most common (49.9%), reflecting the local real estate landscape.
- Houses represent a significant 37.8% portion, catering likely to families or larger groups.
- The presence of 7.9% Hotel/Boutique listings indicates integration with traditional hospitality.
- Smaller segments like outdoor/unique, unique stays, others (combined 4.5%) offer potential for unique stay experiences.
Dahab Airbnb Room Capacity Analysis (2026): Bedroom Distribution
Distribution of Listings by Number of Bedrooms
Room Capacity Insights for Dahab
- The dominant room capacity in Dahab is 1 bedroom listings, making up 53.9% of the market. This suggests a strong demand for properties suitable for couples or solo travelers.
- Together, 1 bedroom and 2 bedrooms properties represent 79.2% of the active Airbnb listings in Dahab, indicating a high concentration in these sizes.
- With over half the market (53.9%) consisting of studios or 1-bedroom units, Dahab is particularly well-suited for individuals or couples.
- Listings with 3+ bedrooms (7.6%) represent a smaller niche, potentially indicating an underserved market for larger group accommodations in Dahab.
Dahab Vacation Rental Guest Capacity Trends (2026)
Distribution of Listings by Guest Capacity
Guest Capacity Insights for Dahab
- The most common guest capacity trend in Dahab vacation rentals is listings accommodating 2 guests (36.9%). This suggests the primary traveler segment is likely couples or solo travelers.
- Properties designed for 2 guests and 4 guests dominate the Dahab STR market, accounting for 57.7% of listings.
- On average, properties in Dahab are equipped to host 3.0 guests.
Dahab Airbnb Booking Patterns (2026): Available vs. Booked Days
Available Days Distribution
Booked Days Distribution
Booking Pattern Insights for Dahab
- The most common availability pattern in Dahab falls within the 271-366 days range, representing 60.1% of listings. This suggests many properties have significant open periods on their calendars.
- Approximately 82.3% of listings show high availability (181+ days open annually), indicating potential for increased bookings or specific owner usage patterns.
- For booked days, the 1-30 days range is most frequent in Dahab (30.8%), reflecting common guest stay durations or potential owner blocking patterns.
- A notable 18.5% of properties secure long booking periods (181+ days booked per year), highlighting successful long-term rental strategies or significant owner usage.
Dahab Airbnb Minimum Stay Requirements Analysis
Distribution of Listings by Minimum Night Requirement
1 Night
296 listings
35.4% of total
2 Nights
146 listings
17.4% of total
3 Nights
134 listings
16% of total
4-6 Nights
61 listings
7.3% of total
7-29 Nights
23 listings
2.7% of total
30+ Nights
177 listings
21.1% of total
Key Insights
- The most prevalent minimum stay requirement in Dahab is 1 Night, adopted by 35.4% of listings. This highlights the market's preference for shorter, flexible bookings.
- A significant segment (21.1%) caters to monthly stays (30+ nights) in Dahab, pointing to opportunities in the extended-stay market.
Recommendations
- Align with the market by considering a 1 Night minimum stay, as 35.4% of Dahab hosts use this setting.
- Explore offering discounts for stays of 30+ nights to attract the 21.1% of the market seeking extended stays.
- Adjust minimum nights based on seasonality – potentially shorter during low season and longer during peak demand periods in Dahab.
Dahab Airbnb Cancellation Policy Trends Analysis (2026)
Super Strict 30 Days
1 listings
0.1% of total
Limited
8 listings
1% of total
Flexible
248 listings
29.8% of total
Moderate
241 listings
28.9% of total
Firm
219 listings
26.3% of total
Strict
116 listings
13.9% of total
Cancellation Policy Insights for Dahab
- The prevailing Airbnb cancellation policy trend in Dahab is Flexible, used by 29.8% of listings.
- There's a relatively balanced mix between guest-friendly (58.7%) and stricter (40.2%) policies, offering choices for different guest needs.
Recommendations for Hosts
- Consider adopting a Flexible policy to align with the 29.8% market standard in Dahab.
- Using a Strict policy might deter some guests, as only 13.9% of listings use it. Evaluate if potential revenue protection outweighs possible lower booking rates.
- Regularly review your cancellation policy against competitors and market demand shifts in Dahab.
Dahab STR Booking Lead Time Analysis (2026)
Average Booking Lead Time by Month
Booking Lead Time Insights for Dahab
- The overall average booking lead time for vacation rentals in Dahab is 25 days.
- Guests book furthest in advance for stays during November (average 42 days), likely coinciding with peak travel demand or local events.
- The shortest booking windows occur for stays in June (average 16 days), indicating more last-minute travel plans during this time.
- Seasonally, Fall (34 days avg.) sees the longest lead times, while Summer (19 days avg.) has the shortest, reflecting typical travel planning cycles.
Recommendations for Hosts
- Use the overall average lead time (25 days) as a baseline for your pricing and availability strategy in Dahab.
- For November stays, consider implementing length-of-stay discounts or slightly higher rates for bookings made less than 42 days out to capitalize on advance planning.
- Target marketing efforts for the Fall season well in advance (at least 34 days) to capture early planners.
- Monitor your own booking lead times against these Dahab averages to identify opportunities for dynamic pricing adjustments.
Popular & Essential Airbnb Amenities in Dahab (2026)
Amenity Prevalence
Amenity Insights for Dahab
- Essential amenities in Dahab that guests expect include: Air conditioning, Wifi. Lacking these (any) could significantly impact bookings.
- Popular amenities like Kitchen, Hot water, Cooking basics are common but not universal. Offering these can provide a competitive edge.
Recommendations for Hosts
- Ensure your listing includes all essential amenities for Dahab: Air conditioning, Wifi.
- Prioritize adding missing essentials: Air conditioning, Wifi.
- Consider adding popular differentiators like Kitchen or Hot water to increase appeal.
- Highlight unique or less common amenities you offer (e.g., hot tub, dedicated workspace, EV charger) in your listing description and photos.
- Regularly check competitor amenities in Dahab to stay competitive.
Dahab Airbnb Guest Demographics & Profile Analysis (2026)
Guest Profile Summary for Dahab
- The typical guest profile for Airbnb in Dahab consists of predominantly international visitors (86%), with top international origins including United Kingdom, typically belonging to the Post-2000s (Gen Z/Alpha) group (50%), primarily speaking English or Arabic.
- Domestic travelers account for 13.8% of guests.
- Key international markets include Egypt (13.8%) and United Kingdom (12.9%).
- Top languages spoken are English (38.9%) followed by Arabic (13.3%).
- A significant demographic segment is the Post-2000s (Gen Z/Alpha) group, representing 50% of guests.
Recommendations for Hosts
- Focus marketing internationally, particularly towards travelers from United Kingdom.
- Tailor amenities and listing descriptions to appeal to the dominant Post-2000s (Gen Z/Alpha) demographic (e.g., highlight fast WiFi, smart home features, local guides).
- Highlight unique local experiences or amenities relevant to the primary guest profile.
- Consider seasonal promotions aligned with peak travel times for key origin markets.
Nearby Short-Term Rental Market Comparison
How does the Dahab Airbnb market stack up against its neighbors? Compare key performance metrics like average monthly revenue, ADR, and occupancy rates in surrounding areas to understand the broader regional STR landscape.
| Market | Active Properties | Monthly Revenue | Daily Rate | Avg. Occupancy |
|---|---|---|---|---|
| Eilat | 1,036 | $2,212 | $342.26 | 29% |
| El Gouna | 15 | $2,195 | $224.55 | 47% |
| Gamsha | 1,138 | $1,209 | $144.47 | 35% |
| Hurghada 2 | 107 | $841 | $148.22 | 32% |
| Sharm Ash Sheikh | 261 | $628 | $82.14 | 37% |
| Hevel Eilot Regional Council | 14 | $586 | $155.46 | 24% |
| Sharm Al Shiekh | 15 | $545 | $72.35 | 41% |
| Aqaba | 103 | $527 | $110.06 | 22% |
| الغردقة | 21 | $506 | $67.93 | 34% |
| Tala Bay | 27 | $458 | $229.92 | 17% |