Al Baairat Village Airbnb Market Analysis 2026: Short Term Rental Data & Vacation Rental Statistics in Luxor, Egypt
Is Airbnb profitable in Al Baairat Village in 2026? Explore comprehensive Airbnb analytics for Al Baairat Village, Luxor, Egypt to uncover income potential. This 2026 STR market report for Al Baairat Village, based on AirROI data from February 2025 to January 2026, reveals key trends in the market of 259 active listings.
Whether you're considering an Airbnb investment in Al Baairat Village, optimizing your existing vacation rental, or exploring rental arbitrage opportunities, understanding the Al Baairat Village Airbnb data is crucial. Leveraging the low regulation environment is key to maximizing your short term rental income potential. Let's dive into the specifics.
Key Al Baairat Village Airbnb Performance Metrics Overview
Monthly Airbnb Revenue Variations & Income Potential in Al Baairat Village (2026)
Understanding the monthly revenue variations for Airbnb listings in Al Baairat Village is key to maximizing your short term rental income potential. Seasonality significantly impacts earnings. Our analysis, based on data from the past 12 months, shows that the peak revenue month for STRs in Al Baairat Village is typically October, while June often presents the lowest earnings, highlighting opportunities for strategic pricing adjustments during shoulder and low seasons. Explore the typical Airbnb income in Al Baairat Village across different performance tiers:
- Best-in-class properties (Top 10%) achieve $1,434+ monthly, often utilizing dynamic pricing and superior guest experiences.
- Strong performing properties (Top 25%) earn $720 or more, indicating effective management and desirable locations/amenities.
- Typical properties (Median) generate around $334 per month, representing the average market performance.
- Entry-level properties (Bottom 25%) see earnings around $153, often with potential for optimization.
Average Monthly Airbnb Earnings Trend in Al Baairat Village
Al Baairat Village Airbnb Occupancy Rate Trends (2026)
Maximize your bookings by understanding the Al Baairat Village STR occupancy trends. Seasonal demand shifts significantly influence how often properties are booked. Typically, Februarysees the highest demand (peak season occupancy), while June experiences the lowest (low season). Effective strategies, like adjusting minimum stays or offering promotions, can boost occupancy during slower periods. Here's how different property tiers perform in Al Baairat Village:
- Best-in-class properties (Top 10%) achieve 70%+ occupancy, indicating high desirability and potentially optimized availability.
- Strong performing properties (Top 25%) maintain 51% or higher occupancy, suggesting good market fit and guest satisfaction.
- Typical properties (Median) have an occupancy rate around 29%.
- Entry-level properties (Bottom 25%) average 15% occupancy, potentially facing higher vacancy.
Average Monthly Occupancy Rate Trend in Al Baairat Village
Average Daily Rate (ADR) Airbnb Trends in Al Baairat Village (2026)
Effective short term rental pricing strategy in Al Baairat Village involves understanding monthly ADR fluctuations. The Average Daily Rate (ADR) for Airbnb in Al Baairat Village typically peaks in January and dips lowest during August. Leveraging Airbnb dynamic pricing tools or strategies based on this seasonality can significantly boost revenue. Here's a look at the typical nightly rates achieved:
- Best-in-class properties (Top 10%) command rates of $78+ per night, often due to premium features or locations.
- Strong performing properties (Top 25%) achieve nightly rates of $52 or more.
- Typical properties (Median) charge around $35 per night.
- Entry-level properties (Bottom 25%) earn around $24 per night.
Average Daily Rate (ADR) Trend by Month in Al Baairat Village
Get Live Al Baairat Village Market Intelligence 👇

Explore Real-time Analytics
Airbnb Seasonality Analysis & Trends in Al Baairat Village (2026)
Peak Season (October, November, December)
- Revenue averages $747 per month
- Occupancy rates average 39.6%
- Daily rates average $47
Shoulder Season
- Revenue averages $613 per month
- Occupancy maintains around 37.0%
- Daily rates hold near $46
Low Season (June, July, September)
- Revenue drops to average $437 per month
- Occupancy decreases to average 25.1%
- Daily rates adjust to average $46
Seasonality Insights for Al Baairat Village
- The Airbnb seasonality in Al Baairat Village shows moderate seasonality with distinct peak and low periods. While the sections above show seasonal averages, it's also insightful to look at the extremes:
- During the high season, the absolute peak month showcases Al Baairat Village's highest earning potential, with monthly revenues capable of climbing to $801, occupancy reaching a high of 46.8%, and ADRs peaking at $48.
- Conversely, the slowest single month of the year, typically falling within the low season, marks the market's lowest point. In this month, revenue might dip to $419, occupancy could drop to 24.6%, and ADRs may adjust down to $45.
- Understanding both the seasonal averages and these monthly peaks and troughs in revenue, occupancy, and ADR is crucial for maximizing your Airbnb profit potential in Al Baairat Village.
Seasonal Strategies for Maximizing Profit
- Peak Season: Maximize revenue through premium pricing and potentially longer minimum stays. Ensure high availability.
- Low Season: Offer competitive pricing, special promotions (e.g., extended stay discounts), and flexible cancellation policies. Target off-season travelers like remote workers or budget-conscious guests.
- Shoulder Seasons: Implement dynamic pricing that balances peak and low rates. Target weekend travelers or specific events. Offer slightly more flexible terms than peak season.
- Regularly analyze your own performance against these Al Baairat Village seasonality benchmarks and adjust your pricing and availability strategy accordingly.
Best Areas for Airbnb Investment in Al Baairat Village (2026)
Exploring the top neighborhoods for short-term rentals in Al Baairat Village? This section highlights key areas, outlining why they are attractive for hosts and guests, along with notable local attractions. Consider these locations based on your target guest profile and investment strategy.
| Neighborhood / Area | Why Host Here? (Target Guests & Appeal) | Key Attractions & Landmarks |
|---|---|---|
| Nile Corniche | A scenic waterfront area offering stunning views of the Nile River. It's popular among tourists visiting Luxor's historical sites, making it ideal for Airbnb investments. | Luxor Temple, Karnak Temple, Nile River boat rides, Luxor Museum, Valley of the Kings |
| Luxor Temple Area | This area is rich in history and close to the Luxor Temple, attracting many visitors. It's perfect for tourists looking to explore ancient Egyptian heritage. | Luxor Temple, Souk of Luxor, local restaurants, historical sites, nighttime sound and light show |
| West Bank | Known for its archaeological sites and quieter atmosphere. A good choice for travelers who want to explore the Valley of the Kings and other ancient tombs. | Valley of the Kings, Valley of the Queens, Hatshepsut Temple, Colossi of Memnon, local village experience |
| East Bank | Home to major attractions like Karnak Temple and Luxor Temple, this bustling area is a hub for tourists, offering various amenities. | Karnak Temple, Luxor Museum, Souks and markets, restaurants, cultural experiences |
| Al Baairat | A charming village known for its tranquil environment and proximity to the Nile, making it appealing for those seeking a peaceful retreat with access to Luxor's attractions. | Nile views, traditional village life, local eateries, walking paths along the river |
| Deir el-Medina | An archaeological site with a rich history, attracting those interested in ancient Egyptian culture. Offers a unique stay for history enthusiasts. | Valley of the Artisans, temples, museums, guided tours |
| Karnak | An impressive archaeological site attracting tourists from around the globe. Provides opportunities for hosting visitors who wish to stay near one of the most famous temples in Egypt. | Karnak Temple, sound and light show at Karnak, local dining options, cultural tours |
| Esna | A small town located south of Luxor, offers a glimpse of local life and authentic experiences. It's a charming base for exploring nearby attractions. | Esna Temple, local markets, Nile River cruise starting points, cultural heritage |
Understanding Airbnb License Requirements & STR Laws in Al Baairat Village (2026)
While Al Baairat Village, Luxor, Egypt currently shows low STR regulations, specific Airbnb license requirements might still exist or change. Always verify the latest short term rental regulations and Airbnb license requirements directly with local government authorities for Al Baairat Village to ensure full compliance before hosting.
(Source: AirROI data, 2026, finding no licensed listings among those analyzed)
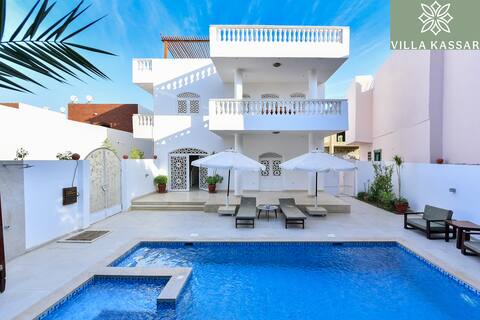
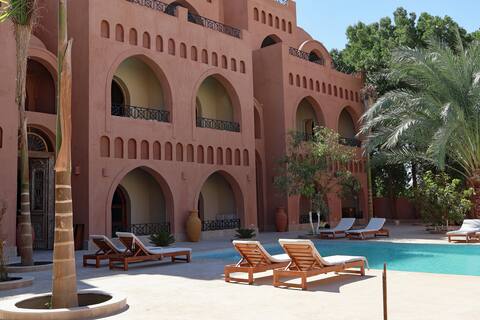
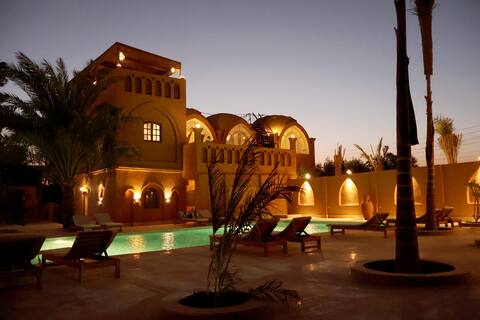
Top Performing Airbnb Properties in Al Baairat Village (2026)
Benchmark your potential! Explore examples of top-performing Airbnb properties in Al Baairat Villagebased on Trailing Twelve Month (TTM) revenue. Analyze their characteristics, revenue, occupancy rate, and ADR to understand what drives success in this market.
Entirely Private Luxurious Villa - Near Old Sites!
Entire Place • 6 bedrooms
Luxe Suite at Malkata House: Pool & Dine
Private Room • 1 bedroom
Malkata House - Pool - On-Site Dining & Tours
Entire Place • 2 bedrooms

Mado luxury villa with private pool
Entire Place • 7 bedrooms

Exclusive, Modern Villa in Ancient Charm - Luxury
Entire Place • 3 bedrooms
Desert top floor Suite: Pool & Dine
Private Room • 1 bedroom
Note: Performance varies based on location, size, amenities, seasonality, and management quality. Data reflects the past 12 months.
Top Performing Airbnb Hosts in Al Baairat Village (2026)
Learn from the best! This table showcases top-performing Airbnb hosts in Al Baairat Village based on the number of properties managed and estimated total revenue over the past year. Analyze their scale and performance metrics.
| Host Name | Properties | Grossing Revenue | Stay Reviews | Avg Rating |
|---|---|---|---|---|
| Mohamed | 7 | $187,198 | 171 | 4.96/5.0 |
| Abdol | 11 | $119,111 | 1570 | 4.91/5.0 |
| Ali | 5 | $79,554 | 494 | 4.99/5.0 |
| Mohamed Sayed | 8 | $77,901 | 122 | 4.84/5.0 |
| Cohotel | 2 | $68,838 | 338 | 4.88/5.0 |
| Ali | 10 | $46,981 | 460 | 4.95/5.0 |
| Momo | 2 | $33,338 | 49 | 5.00/5.0 |
| Arianna | 6 | $32,085 | 168 | 4.89/5.0 |
| Mohamed Hussien | 3 | $31,920 | 80 | 4.81/5.0 |
| Ineke And Azzab | 3 | $27,731 | 237 | 4.90/5.0 |
Analyzing the strategies of top hosts, such as their property selection, pricing, and guest communication, can offer valuable lessons for optimizing your own Airbnb operations in Al Baairat Village.
Dive Deeper: Advanced Al Baairat Village STR Market Data (2026)
Ready to unlock more insights? AirROI provides access to advanced metrics and comprehensive Airbnb data for Al Baairat Village. Explore detailed analytics beyond this report to refine your investment strategy, optimize pricing, and maximize your vacation rental profits.
Explore Advanced MetricsAl Baairat Village Short-Term Rental Market Composition (2026): Property & Room Types
Room Type Distribution
Property Type Distribution
Market Composition Insights for Al Baairat Village
- The Al Baairat Village Airbnb market composition is heavily skewed towards Entire Home/Apt listings, which make up 75.3% of the 259 active rentals. This indicates strong guest preference for privacy and space.
- Looking at the property type distribution in Al Baairat Village, Apartment/Condo properties are the most common (66.4%), reflecting the local real estate landscape.
- Houses represent a significant 17.8% portion, catering likely to families or larger groups.
- The presence of 13.9% Hotel/Boutique listings indicates integration with traditional hospitality.
- Smaller segments like outdoor/unique, unique stays, others (combined 2.0%) offer potential for unique stay experiences.
Al Baairat Village Airbnb Room Capacity Analysis (2026): Bedroom Distribution
Distribution of Listings by Number of Bedrooms
Room Capacity Insights for Al Baairat Village
- The dominant room capacity in Al Baairat Village is 2 bedrooms listings, making up 39.8% of the market. This suggests a strong demand for properties suitable for couples or solo travelers.
- Together, 2 bedrooms and 1 bedroom properties represent 78.4% of the active Airbnb listings in Al Baairat Village, indicating a high concentration in these sizes.
Al Baairat Village Vacation Rental Guest Capacity Trends (2026)
Distribution of Listings by Guest Capacity
Guest Capacity Insights for Al Baairat Village
- The most common guest capacity trend in Al Baairat Village vacation rentals is listings accommodating 4 guests (33.6%). This suggests the primary traveler segment is likely small families or groups.
- Properties designed for 4 guests and 2 guests dominate the Al Baairat Village STR market, accounting for 65.3% of listings.
- 13.1% of properties accommodate 6+ guests, serving the market segment for larger families or group travel in Al Baairat Village.
- On average, properties in Al Baairat Village are equipped to host 3.3 guests.
Al Baairat Village Airbnb Booking Patterns (2026): Available vs. Booked Days
Available Days Distribution
Booked Days Distribution
Booking Pattern Insights for Al Baairat Village
- The most common availability pattern in Al Baairat Village falls within the 271-366 days range, representing 62.9% of listings. This suggests many properties have significant open periods on their calendars.
- Approximately 88.4% of listings show high availability (181+ days open annually), indicating potential for increased bookings or specific owner usage patterns.
- For booked days, the 1-30 days range is most frequent in Al Baairat Village (30.9%), reflecting common guest stay durations or potential owner blocking patterns.
- A notable 12.4% of properties secure long booking periods (181+ days booked per year), highlighting successful long-term rental strategies or significant owner usage.
Al Baairat Village Airbnb Minimum Stay Requirements Analysis
Distribution of Listings by Minimum Night Requirement
1 Night
201 listings
77.6% of total
2 Nights
30 listings
11.6% of total
3 Nights
2 listings
0.8% of total
4-6 Nights
1 listings
0.4% of total
7-29 Nights
1 listings
0.4% of total
30+ Nights
24 listings
9.3% of total
Key Insights
- The most prevalent minimum stay requirement in Al Baairat Village is 1 Night, adopted by 77.6% of listings. This highlights the market's preference for shorter, flexible bookings.
- A strong majority (89.2%) of the Al Baairat Village Airbnb data shows acceptance of very short stays (1-2 nights), indicating a dynamic, high-turnover market.
Recommendations
- Align with the market by considering a 1 Night minimum stay, as 77.6% of Al Baairat Village hosts use this setting.
- Explore offering discounts for stays of 30+ nights to attract the 9.3% of the market seeking extended stays.
- Adjust minimum nights based on seasonality – potentially shorter during low season and longer during peak demand periods in Al Baairat Village.
Al Baairat Village Airbnb Cancellation Policy Trends Analysis (2026)
Flexible
127 listings
49.2% of total
Moderate
82 listings
31.8% of total
Firm
42 listings
16.3% of total
Strict
7 listings
2.7% of total
Cancellation Policy Insights for Al Baairat Village
- The prevailing Airbnb cancellation policy trend in Al Baairat Village is Flexible, used by 49.2% of listings.
- The market strongly favors guest-friendly terms, with 81.0% of listings offering Flexible or Moderate policies. This suggests guests in Al Baairat Village may expect booking flexibility.
- Strict cancellation policies are quite rare (2.7%), potentially making listings with this policy less competitive unless justified by high demand or property type.
Recommendations for Hosts
- Consider adopting a Flexible policy to align with the 49.2% market standard in Al Baairat Village.
- Using a Strict policy might deter some guests, as only 2.7% of listings use it. Evaluate if potential revenue protection outweighs possible lower booking rates.
- Regularly review your cancellation policy against competitors and market demand shifts in Al Baairat Village.
Al Baairat Village STR Booking Lead Time Analysis (2026)
Average Booking Lead Time by Month
Booking Lead Time Insights for Al Baairat Village
- The overall average booking lead time for vacation rentals in Al Baairat Village is 42 days.
- Guests book furthest in advance for stays during October (average 68 days), likely coinciding with peak travel demand or local events.
- The shortest booking windows occur for stays in June (average 33 days), indicating more last-minute travel plans during this time.
- Seasonally, Fall (61 days avg.) sees the longest lead times, while Spring (38 days avg.) has the shortest, reflecting typical travel planning cycles.
Recommendations for Hosts
- Use the overall average lead time (42 days) as a baseline for your pricing and availability strategy in Al Baairat Village.
- For October stays, consider implementing length-of-stay discounts or slightly higher rates for bookings made less than 68 days out to capitalize on advance planning.
- Target marketing efforts for the Fall season well in advance (at least 61 days) to capture early planners.
- Monitor your own booking lead times against these Al Baairat Village averages to identify opportunities for dynamic pricing adjustments.
Popular & Essential Airbnb Amenities in Al Baairat Village (2026)
Amenity Prevalence
Amenity Insights for Al Baairat Village
- Essential amenities in Al Baairat Village that guests expect include: Wifi, Air conditioning. Lacking these (any) could significantly impact bookings.
- Popular amenities like TV, Hot water, Kitchen are common but not universal. Offering these can provide a competitive edge.
Recommendations for Hosts
- Ensure your listing includes all essential amenities for Al Baairat Village: Wifi, Air conditioning.
- Prioritize adding missing essentials: Wifi, Air conditioning.
- Consider adding popular differentiators like TV or Hot water to increase appeal.
- Highlight unique or less common amenities you offer (e.g., hot tub, dedicated workspace, EV charger) in your listing description and photos.
- Regularly check competitor amenities in Al Baairat Village to stay competitive.
Al Baairat Village Airbnb Guest Demographics & Profile Analysis (2026)
Guest Profile Summary for Al Baairat Village
- The typical guest profile for Airbnb in Al Baairat Village consists of predominantly international visitors (99%), with top international origins including France, typically belonging to the Post-2000s (Gen Z/Alpha) group (50%), primarily speaking English or Spanish.
- Domestic travelers account for 0.7% of guests.
- Key international markets include United States (20.4%) and France (19%).
- Top languages spoken are English (40.7%) followed by Spanish (14.2%).
- A significant demographic segment is the Post-2000s (Gen Z/Alpha) group, representing 50% of guests.
Recommendations for Hosts
- Focus marketing internationally, particularly towards travelers from France.
- Tailor amenities and listing descriptions to appeal to the dominant Post-2000s (Gen Z/Alpha) demographic (e.g., highlight fast WiFi, smart home features, local guides).
- Highlight unique local experiences or amenities relevant to the primary guest profile.
- Consider seasonal promotions aligned with peak travel times for key origin markets.
Nearby Short-Term Rental Market Comparison
How does the Al Baairat Village Airbnb market stack up against its neighbors? Compare key performance metrics like average monthly revenue, ADR, and occupancy rates in surrounding areas to understand the broader regional STR landscape.
| Market | Active Properties | Monthly Revenue | Daily Rate | Avg. Occupancy |
|---|---|---|---|---|
| Ras Abu Soma | 54 | $884 | $160.33 | 30% |
| Safaga | 48 | $545 | $92.33 | 32% |
| Saleh Gahin | 10 | $522 | $59.70 | 30% |
| Aswan | 20 | $409 | $84.44 | 25% |
| Jazirat al Awamiya | 14 | $269 | $41.92 | 29% |
| Red Sea Governorate | 10 | $233 | $72.88 | 23% |
| Nagaa Al Mahata | 15 | $231 | $52.06 | 25% |
| New Al Qarnh City | 21 | $221 | $54.86 | 21% |
| Taqouk Mountain | 24 | $185 | $38.62 | 22% |
| Al Bairat | 11 | $174 | $45.79 | 30% |