Ulba Airbnb Market Analysis 2026: Short Term Rental Data & Vacation Rental Statistics in Tungurahua, Ecuador
Is Airbnb profitable in Ulba in 2026? Explore comprehensive Airbnb analytics for Ulba, Tungurahua, Ecuador to uncover income potential. This 2026 STR market report for Ulba, based on AirROI data from February 2025 to January 2026, reveals key trends in the niche market of 35 active listings.
Whether you're considering an Airbnb investment in Ulba, optimizing your existing vacation rental, or exploring rental arbitrage opportunities, understanding the Ulba Airbnb data is crucial. Leveraging the low regulation environment is key to maximizing your short term rental income potential. Let's dive into the specifics.
Key Ulba Airbnb Performance Metrics Overview
Monthly Airbnb Revenue Variations & Income Potential in Ulba (2026)
Understanding the monthly revenue variations for Airbnb listings in Ulba is key to maximizing your short term rental income potential. Seasonality significantly impacts earnings. Our analysis, based on data from the past 12 months, shows that the peak revenue month for STRs in Ulba is typically August, while November often presents the lowest earnings, highlighting opportunities for strategic pricing adjustments during shoulder and low seasons. Explore the typical Airbnb income in Ulba across different performance tiers:
- Best-in-class properties (Top 10%) achieve $1,254+ monthly, often utilizing dynamic pricing and superior guest experiences.
- Strong performing properties (Top 25%) earn $863 or more, indicating effective management and desirable locations/amenities.
- Typical properties (Median) generate around $401 per month, representing the average market performance.
- Entry-level properties (Bottom 25%) see earnings around $198, often with potential for optimization.
Average Monthly Airbnb Earnings Trend in Ulba
Ulba Airbnb Occupancy Rate Trends (2026)
Maximize your bookings by understanding the Ulba STR occupancy trends. Seasonal demand shifts significantly influence how often properties are booked. Typically, Augustsees the highest demand (peak season occupancy), while April experiences the lowest (low season). Effective strategies, like adjusting minimum stays or offering promotions, can boost occupancy during slower periods. Here's how different property tiers perform in Ulba:
- Best-in-class properties (Top 10%) achieve 44%+ occupancy, indicating high desirability and potentially optimized availability.
- Strong performing properties (Top 25%) maintain 29% or higher occupancy, suggesting good market fit and guest satisfaction.
- Typical properties (Median) have an occupancy rate around 16%.
- Entry-level properties (Bottom 25%) average 8% occupancy, potentially facing higher vacancy.
Average Monthly Occupancy Rate Trend in Ulba
Average Daily Rate (ADR) Airbnb Trends in Ulba (2026)
Effective short term rental pricing strategy in Ulba involves understanding monthly ADR fluctuations. The Average Daily Rate (ADR) for Airbnb in Ulba typically peaks in June and dips lowest during January. Leveraging Airbnb dynamic pricing tools or strategies based on this seasonality can significantly boost revenue. Here's a look at the typical nightly rates achieved:
- Best-in-class properties (Top 10%) command rates of $139+ per night, often due to premium features or locations.
- Strong performing properties (Top 25%) achieve nightly rates of $112 or more.
- Typical properties (Median) charge around $89 per night.
- Entry-level properties (Bottom 25%) earn around $55 per night.
Average Daily Rate (ADR) Trend by Month in Ulba
Get Live Ulba Market Intelligence 👇

Explore Real-time Analytics
Airbnb Seasonality Analysis & Trends in Ulba (2026)
Peak Season (August, September, December)
- Revenue averages $709 per month
- Occupancy rates average 24.1%
- Daily rates average $94
Shoulder Season
- Revenue averages $582 per month
- Occupancy maintains around 20.8%
- Daily rates hold near $97
Low Season (January, April, November)
- Revenue drops to average $450 per month
- Occupancy decreases to average 17.2%
- Daily rates adjust to average $92
Seasonality Insights for Ulba
- The Airbnb seasonality in Ulba shows moderate seasonality with distinct peak and low periods. While the sections above show seasonal averages, it's also insightful to look at the extremes:
- During the high season, the absolute peak month showcases Ulba's highest earning potential, with monthly revenues capable of climbing to $746, occupancy reaching a high of 25.3%, and ADRs peaking at $101.
- Conversely, the slowest single month of the year, typically falling within the low season, marks the market's lowest point. In this month, revenue might dip to $432, occupancy could drop to 17.0%, and ADRs may adjust down to $90.
- Understanding both the seasonal averages and these monthly peaks and troughs in revenue, occupancy, and ADR is crucial for maximizing your Airbnb profit potential in Ulba.
Seasonal Strategies for Maximizing Profit
- Peak Season: Maximize revenue through premium pricing and potentially longer minimum stays. Ensure high availability.
- Low Season: Offer competitive pricing, special promotions (e.g., extended stay discounts), and flexible cancellation policies. Target off-season travelers like remote workers or budget-conscious guests.
- Shoulder Seasons: Implement dynamic pricing that balances peak and low rates. Target weekend travelers or specific events. Offer slightly more flexible terms than peak season.
- Regularly analyze your own performance against these Ulba seasonality benchmarks and adjust your pricing and availability strategy accordingly.
Best Areas for Airbnb Investment in Ulba (2026)
Exploring the top neighborhoods for short-term rentals in Ulba? This section highlights key areas, outlining why they are attractive for hosts and guests, along with notable local attractions. Consider these locations based on your target guest profile and investment strategy.
| Neighborhood / Area | Why Host Here? (Target Guests & Appeal) | Key Attractions & Landmarks |
|---|---|---|
| Baños de Agua Santa | Popular tourist destination known for its hot springs and stunning waterfalls. It offers various adventure sports and attracts tourists seeking relaxation and outdoor activities. | Pailón del Diablo, Termas de la Virgen, Casa del Arbol, Agua Santa Waterfalls, Canyoning, Bungee Jumping |
| Ambato | Cultural hub and economic center of Tungurahua with rich history and vibrant markets. Known for its agricultural products and lively festivals, making it a good location for travelers. | Parque Cevallos, Ambato Cathedral, Casa del Cuy, Museo de Historia, Feria de Ambato |
| Patate | Charming town with beautiful scenery and a quieter ambiance. Ideal for travelers looking for nature and local culture, known for its agricultural heritage and landscapes. | Chimborazo Volcano, Natural Springs, Local markets, Hiking trails |
| Pueblo chico | Scenic village near Baños, offers tranquil environment and stunning views. Great for those seeking peace and proximity to nature, it’s often overlooked but offers unique experiences. | Hiking trails to waterfalls, Nature views, Local artisan crafts |
| Capiro | Residential area with access to natural beauty and outdoor activities. Attracts visitors interested in eco-friendly tourism and local culture just outside Baños. | Capiro Waterfalls, Hiking opportunities, Local fauna and flora |
| Llanganates National Park | National park offering stunning biodiversity and outdoor activities. Ideal for eco-tourists and adventure seekers looking to explore untouched nature. | Birdwatching, Hiking, Camping sites |
| El Salado | Known for its natural hot springs and tranquil environment. Suitable for relaxation and wellness tourism, attracting visitors looking to unwind. | Hot springs, Spa centers, Hiking areas |
| Palma Real | Residential area with local charm and access to nearby attractions. Provides an authentic experience for visitors wanting a taste of local life. | Local markets, Cultural experiences, Scenic countryside |
Understanding Airbnb License Requirements & STR Laws in Ulba (2026)
While Ulba, Tungurahua, Ecuador currently shows low STR regulations, specific Airbnb license requirements might still exist or change. Always verify the latest short term rental regulations and Airbnb license requirements directly with local government authorities for Ulba to ensure full compliance before hosting.
(Source: AirROI data, 2026, finding no licensed listings among those analyzed)
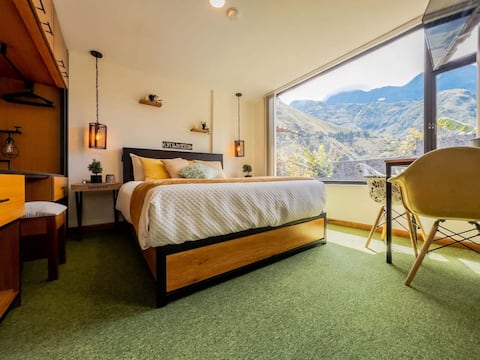
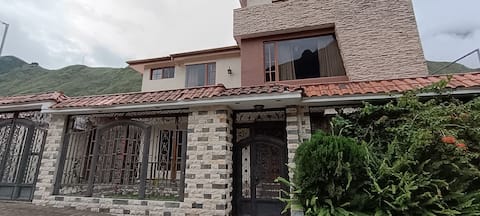
Top Performing Airbnb Properties in Ulba (2026)
Benchmark your potential! Explore examples of top-performing Airbnb properties in Ulbabased on Trailing Twelve Month (TTM) revenue. Analyze their characteristics, revenue, occupancy rate, and ADR to understand what drives success in this market.
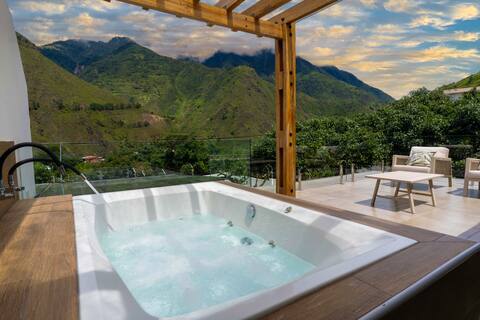
Luxury Cabin with Jacuzzi and Unique View in Baños
Entire Place • 2 bedrooms
Modern and peaceful house with an breahtaking view
Entire Place • 2 bedrooms
Nestled in paradise SLEEPS 19 by Pastaza River
Entire Place • 6 bedrooms
Mountain Suite
Entire Place • 2 bedrooms
Relax Suite, patio, orchard, waterfalls, near city
Entire Place • 1 bedroom
Villa Capairón
Entire Place • 4 bedrooms
Note: Performance varies based on location, size, amenities, seasonality, and management quality. Data reflects the past 12 months.
Top Performing Airbnb Hosts in Ulba (2026)
Learn from the best! This table showcases top-performing Airbnb hosts in Ulba based on the number of properties managed and estimated total revenue over the past year. Analyze their scale and performance metrics.
| Host Name | Properties | Grossing Revenue | Stay Reviews | Avg Rating |
|---|---|---|---|---|
| Gabriela | 2 | $32,489 | 87 | 4.75/5.0 |
| Oliver | 4 | $26,321 | 110 | 4.96/5.0 |
| Gerson | 3 | $22,409 | 104 | 4.86/5.0 |
| Simón Alberto | 7 | $17,350 | 43 | 4.88/5.0 |
| George | 3 | $13,892 | 62 | 4.88/5.0 |
| Jean | 2 | $10,781 | 137 | 4.87/5.0 |
| Eliana | 2 | $8,894 | 79 | 4.75/5.0 |
| Andres | 1 | $8,699 | 50 | 4.94/5.0 |
| Gabriela | 1 | $7,593 | 28 | 4.86/5.0 |
| Darwin | 1 | $4,534 | 73 | 4.77/5.0 |
Analyzing the strategies of top hosts, such as their property selection, pricing, and guest communication, can offer valuable lessons for optimizing your own Airbnb operations in Ulba.
Dive Deeper: Advanced Ulba STR Market Data (2026)
Ready to unlock more insights? AirROI provides access to advanced metrics and comprehensive Airbnb data for Ulba. Explore detailed analytics beyond this report to refine your investment strategy, optimize pricing, and maximize your vacation rental profits.
Explore Advanced MetricsUlba Short-Term Rental Market Composition (2026): Property & Room Types
Room Type Distribution
Property Type Distribution
Market Composition Insights for Ulba
- The Ulba Airbnb market composition is heavily skewed towards Entire Home/Apt listings, which make up 77.1% of the 35 active rentals. This indicates strong guest preference for privacy and space.
- Looking at the property type distribution in Ulba, House properties are the most common (42.9%), reflecting the local real estate landscape.
- Houses represent a significant 42.9% portion, catering likely to families or larger groups.
- The presence of 25.7% Hotel/Boutique listings indicates integration with traditional hospitality.
Ulba Airbnb Room Capacity Analysis (2026): Bedroom Distribution
Distribution of Listings by Number of Bedrooms
Room Capacity Insights for Ulba
- The dominant room capacity in Ulba is 1 bedroom listings, making up 31.4% of the market. This suggests a strong demand for properties suitable for couples or solo travelers.
- Together, 1 bedroom and 2 bedrooms properties represent 57.1% of the active Airbnb listings in Ulba, indicating a high concentration in these sizes.
- A significant 37.1% of listings offer 3+ bedrooms, catering to larger groups and families seeking more space in Ulba.
Ulba Vacation Rental Guest Capacity Trends (2026)
Distribution of Listings by Guest Capacity
Guest Capacity Insights for Ulba
- The most common guest capacity trend in Ulba vacation rentals is listings accommodating 8+ guests (37.1%). This suggests the primary traveler segment is likely larger groups.
- Properties designed for 8+ guests and 6 guests dominate the Ulba STR market, accounting for 54.2% of listings.
- 54.2% of properties accommodate 6+ guests, serving the market segment for larger families or group travel in Ulba.
- On average, properties in Ulba are equipped to host 5.4 guests.
Ulba Airbnb Booking Patterns (2026): Available vs. Booked Days
Available Days Distribution
Booked Days Distribution
Booking Pattern Insights for Ulba
- The most common availability pattern in Ulba falls within the 271-366 days range, representing 88.6% of listings. This suggests many properties have significant open periods on their calendars.
- Approximately 97.2% of listings show high availability (181+ days open annually), indicating potential for increased bookings or specific owner usage patterns.
- For booked days, the 31-90 days range is most frequent in Ulba (45.7%), reflecting common guest stay durations or potential owner blocking patterns.
- A notable 2.9% of properties secure long booking periods (181+ days booked per year), highlighting successful long-term rental strategies or significant owner usage.
Ulba Airbnb Minimum Stay Requirements Analysis
Distribution of Listings by Minimum Night Requirement
1 Night
30 listings
85.7% of total
2 Nights
1 listings
2.9% of total
30+ Nights
4 listings
11.4% of total
Key Insights
- The most prevalent minimum stay requirement in Ulba is 1 Night, adopted by 85.7% of listings. This highlights the market's preference for shorter, flexible bookings.
- A strong majority (88.6%) of the Ulba Airbnb data shows acceptance of very short stays (1-2 nights), indicating a dynamic, high-turnover market.
- A significant segment (11.4%) caters to monthly stays (30+ nights) in Ulba, pointing to opportunities in the extended-stay market.
Recommendations
- Align with the market by considering a 1 Night minimum stay, as 85.7% of Ulba hosts use this setting.
- Explore offering discounts for stays of 30+ nights to attract the 11.4% of the market seeking extended stays.
- Adjust minimum nights based on seasonality – potentially shorter during low season and longer during peak demand periods in Ulba.
Ulba Airbnb Cancellation Policy Trends Analysis (2026)
Flexible
14 listings
40% of total
Moderate
15 listings
42.9% of total
Firm
6 listings
17.1% of total
Cancellation Policy Insights for Ulba
- The prevailing Airbnb cancellation policy trend in Ulba is Moderate, used by 42.9% of listings.
- The market strongly favors guest-friendly terms, with 82.9% of listings offering Flexible or Moderate policies. This suggests guests in Ulba may expect booking flexibility.
Recommendations for Hosts
- Consider adopting a Moderate policy to align with the 42.9% market standard in Ulba.
- Regularly review your cancellation policy against competitors and market demand shifts in Ulba.
Ulba STR Booking Lead Time Analysis (2026)
Average Booking Lead Time by Month
Booking Lead Time Insights for Ulba
- The overall average booking lead time for vacation rentals in Ulba is 34 days.
- Guests book furthest in advance for stays during October (average 70 days), likely coinciding with peak travel demand or local events.
- The shortest booking windows occur for stays in July (average 23 days), indicating more last-minute travel plans during this time.
- Seasonally, Fall (49 days avg.) sees the longest lead times, while Spring (28 days avg.) has the shortest, reflecting typical travel planning cycles.
Recommendations for Hosts
- Use the overall average lead time (34 days) as a baseline for your pricing and availability strategy in Ulba.
- For October stays, consider implementing length-of-stay discounts or slightly higher rates for bookings made less than 70 days out to capitalize on advance planning.
- Target marketing efforts for the Fall season well in advance (at least 49 days) to capture early planners.
- Monitor your own booking lead times against these Ulba averages to identify opportunities for dynamic pricing adjustments.
Popular & Essential Airbnb Amenities in Ulba (2026)
Amenity Prevalence
Amenity Insights for Ulba
- Essential amenities in Ulba that guests expect include: Wifi, Free parking on premises, Hot water. Lacking these (any) could significantly impact bookings.
- Popular amenities like Essentials, Shampoo, TV are common but not universal. Offering these can provide a competitive edge.
Recommendations for Hosts
- Ensure your listing includes all essential amenities for Ulba: Wifi, Free parking on premises, Hot water.
- Prioritize adding missing essentials: Free parking on premises, Hot water.
- Consider adding popular differentiators like Essentials or Shampoo to increase appeal.
- Highlight unique or less common amenities you offer (e.g., hot tub, dedicated workspace, EV charger) in your listing description and photos.
- Regularly check competitor amenities in Ulba to stay competitive.
Ulba Airbnb Guest Demographics & Profile Analysis (2026)
Guest Profile Summary for Ulba
- The typical guest profile for Airbnb in Ulba consists of a mix of domestic (59%) and international guests, often arriving from nearby Quito, typically belonging to the Post-2000s (Gen Z/Alpha) group (50%), primarily speaking Spanish or English.
- Domestic travelers account for 58.9% of guests.
- Key international markets include Ecuador (58.9%) and United States (20%).
- Top languages spoken are Spanish (48.5%) followed by English (37.4%).
- A significant demographic segment is the Post-2000s (Gen Z/Alpha) group, representing 50% of guests.
Recommendations for Hosts
- Balance marketing efforts between domestic and international channels based on the guest mix.
- Tailor amenities and listing descriptions to appeal to the dominant Post-2000s (Gen Z/Alpha) demographic (e.g., highlight fast WiFi, smart home features, local guides).
- Highlight unique local experiences or amenities relevant to the primary guest profile.
- Consider seasonal promotions aligned with peak travel times for key origin markets.
Nearby Short-Term Rental Market Comparison
How does the Ulba Airbnb market stack up against its neighbors? Compare key performance metrics like average monthly revenue, ADR, and occupancy rates in surrounding areas to understand the broader regional STR landscape.