Olón Airbnb Market Analysis 2026: Short Term Rental Data & Vacation Rental Statistics in Santa Elena Province, Ecuador
Is Airbnb profitable in Olón in 2026? Explore comprehensive Airbnb analytics for Olón, Santa Elena Province, Ecuador to uncover income potential. This 2026 STR market report for Olón, based on AirROI data from February 2025 to January 2026, reveals key trends in the niche market of 178 active listings.
Whether you're considering an Airbnb investment in Olón, optimizing your existing vacation rental, or exploring rental arbitrage opportunities, understanding the Olón Airbnb data is crucial. Leveraging the low regulation environment is key to maximizing your short term rental income potential. Let's dive into the specifics.
Key Olón Airbnb Performance Metrics Overview
Monthly Airbnb Revenue Variations & Income Potential in Olón (2026)
Understanding the monthly revenue variations for Airbnb listings in Olón is key to maximizing your short term rental income potential. Seasonality significantly impacts earnings. Our analysis, based on data from the past 12 months, shows that the peak revenue month for STRs in Olón is typically March, while September often presents the lowest earnings, highlighting opportunities for strategic pricing adjustments during shoulder and low seasons. Explore the typical Airbnb income in Olón across different performance tiers:
- Best-in-class properties (Top 10%) achieve $2,242+ monthly, often utilizing dynamic pricing and superior guest experiences.
- Strong performing properties (Top 25%) earn $1,365 or more, indicating effective management and desirable locations/amenities.
- Typical properties (Median) generate around $629 per month, representing the average market performance.
- Entry-level properties (Bottom 25%) see earnings around $264, often with potential for optimization.
Average Monthly Airbnb Earnings Trend in Olón
Olón Airbnb Occupancy Rate Trends (2026)
Maximize your bookings by understanding the Olón STR occupancy trends. Seasonal demand shifts significantly influence how often properties are booked. Typically, Marchsees the highest demand (peak season occupancy), while September experiences the lowest (low season). Effective strategies, like adjusting minimum stays or offering promotions, can boost occupancy during slower periods. Here's how different property tiers perform in Olón:
- Best-in-class properties (Top 10%) achieve 54%+ occupancy, indicating high desirability and potentially optimized availability.
- Strong performing properties (Top 25%) maintain 34% or higher occupancy, suggesting good market fit and guest satisfaction.
- Typical properties (Median) have an occupancy rate around 18%.
- Entry-level properties (Bottom 25%) average 9% occupancy, potentially facing higher vacancy.
Average Monthly Occupancy Rate Trend in Olón
Average Daily Rate (ADR) Airbnb Trends in Olón (2026)
Effective short term rental pricing strategy in Olón involves understanding monthly ADR fluctuations. The Average Daily Rate (ADR) for Airbnb in Olón typically peaks in March and dips lowest during November. Leveraging Airbnb dynamic pricing tools or strategies based on this seasonality can significantly boost revenue. Here's a look at the typical nightly rates achieved:
- Best-in-class properties (Top 10%) command rates of $288+ per night, often due to premium features or locations.
- Strong performing properties (Top 25%) achieve nightly rates of $163 or more.
- Typical properties (Median) charge around $108 per night.
- Entry-level properties (Bottom 25%) earn around $66 per night.
Average Daily Rate (ADR) Trend by Month in Olón
Get Live Olón Market Intelligence 👇

Explore Real-time Analytics
Airbnb Seasonality Analysis & Trends in Olón (2026)
Peak Season (March, February, August)
- Revenue averages $1,304 per month
- Occupancy rates average 30.7%
- Daily rates average $148
Shoulder Season
- Revenue averages $1,037 per month
- Occupancy maintains around 23.5%
- Daily rates hold near $146
Low Season (June, September, November)
- Revenue drops to average $753 per month
- Occupancy decreases to average 18.8%
- Daily rates adjust to average $143
Seasonality Insights for Olón
- The Airbnb seasonality in Olón shows highly seasonal trends requiring careful strategy. While the sections above show seasonal averages, it's also insightful to look at the extremes:
- During the high season, the absolute peak month showcases Olón's highest earning potential, with monthly revenues capable of climbing to $1,536, occupancy reaching a high of 35.1%, and ADRs peaking at $150.
- Conversely, the slowest single month of the year, typically falling within the low season, marks the market's lowest point. In this month, revenue might dip to $639, occupancy could drop to 17.6%, and ADRs may adjust down to $140.
- Understanding both the seasonal averages and these monthly peaks and troughs in revenue, occupancy, and ADR is crucial for maximizing your Airbnb profit potential in Olón.
Seasonal Strategies for Maximizing Profit
- Peak Season: Maximize revenue through premium pricing and potentially longer minimum stays. Ensure high availability.
- Low Season: Offer competitive pricing, special promotions (e.g., extended stay discounts), and flexible cancellation policies. Target off-season travelers like remote workers or budget-conscious guests.
- Shoulder Seasons: Implement dynamic pricing that balances peak and low rates. Target weekend travelers or specific events. Offer slightly more flexible terms than peak season.
- Regularly analyze your own performance against these Olón seasonality benchmarks and adjust your pricing and availability strategy accordingly.
Best Areas for Airbnb Investment in Olón (2026)
Exploring the top neighborhoods for short-term rentals in Olón? This section highlights key areas, outlining why they are attractive for hosts and guests, along with notable local attractions. Consider these locations based on your target guest profile and investment strategy.
| Neighborhood / Area | Why Host Here? (Target Guests & Appeal) | Key Attractions & Landmarks |
|---|---|---|
| Playa de Olón | A stunning beach known for its beautiful sunsets, surfing spots, and relaxed vibe. Ideal for tourists looking for beach relaxation and water sports. | Olón Beach, Local seafood restaurants, Surfing schools, Nearby Montañita, Horseback riding on the beach |
| Olon Village | A charming village atmosphere with a local market and cultural experiences. Attracts visitors wanting to immerse themselves in Ecuadorian culture. | Local artisan shops, Cultural festivals, Community events, Nearby hiking trails, Traditional Ecuadorian cuisine |
| Santa Elena Coast | A coastal stretch that includes various beaches and views, popular for eco-tourism and nature lovers. Great for exploring the natural beauty of the region. | Wildlife reserves, Scenic beach paths, Nature tours, Snorkeling and diving spots, Cliff views |
| Montañita | Famous for its nightlife and surf culture, Montañita is a hotspot for young travelers and those looking for a vibrant social scene. | Montañita Beach, Bars and clubs, Surfing competitions, Yoga retreats, Street food vendors |
| Ayangue | Known for its calm waters and family-friendly environment. Ideal for those looking for a tranquil beach experience away from crowded areas. | Ayangue Beach, Gentle snorkeling, Family-friendly restaurants, Scenic boat rides, Tidal pools |
| Salinas | One of the most developed beach resorts in Ecuador, offering luxury amenities and a bustling social scene. Attracts both local and international tourists. | Salinas Beach, Malecón Salinas, Water sports activities, Shopping centers, Gastronomic offerings |
| Libertador Bolívar | A mixed urban and beach area that provides access to local cuisine, cultural activities, and easy beach access. Appeals to a diverse group of travelers. | Beachfront restaurants, Cultural shows, Street vendors, Artisan markets, Community tours |
| Pueblo Nuevo | A quieter, more residential area with local charm. Offers a taste of everyday life in a coastal town, perfect for long-term stays. | Local parks, Community markets, Cultural interactions, Panoramic views, Nature trails |
Understanding Airbnb License Requirements & STR Laws in Olón (2026)
While Olón, Santa Elena Province, Ecuador currently shows low STR regulations, specific Airbnb license requirements might still exist or change. Always verify the latest short term rental regulations and Airbnb license requirements directly with local government authorities for Olón to ensure full compliance before hosting.
(Source: AirROI data, 2026, finding no licensed listings among those analyzed)
Top Performing Airbnb Properties in Olón (2026)
Benchmark your potential! Explore examples of top-performing Airbnb properties in Olónbased on Trailing Twelve Month (TTM) revenue. Analyze their characteristics, revenue, occupancy rate, and ADR to understand what drives success in this market.
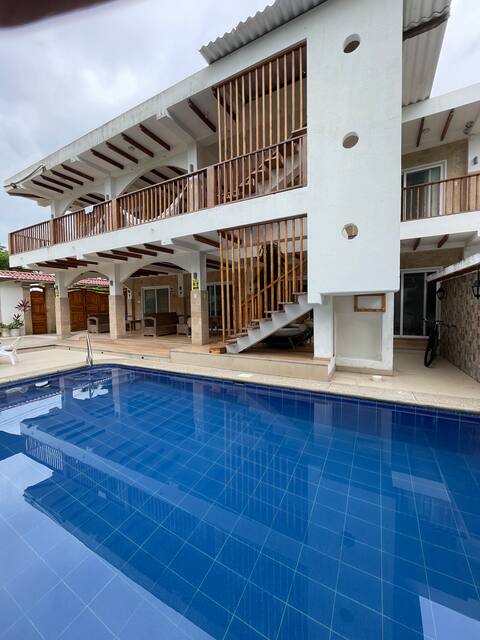
Beautiful house for a large group
Entire Place • 7 bedrooms

Bosques Lux: whirlpool and security
Entire Place • 4 bedrooms

Boutique Hotel by the Sea
Entire Place • 8 bedrooms
Casa de los Pavos Reales OLÓN (Olón Peacock House)
Entire Place • 4 bedrooms
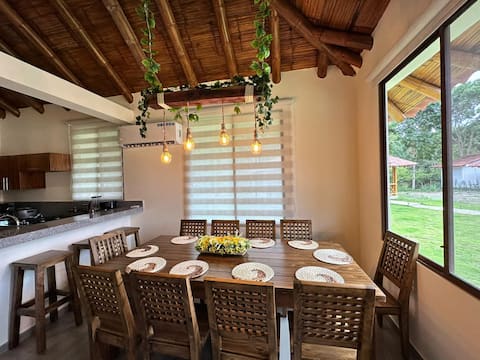
The paisa stay
Entire Place • 3 bedrooms

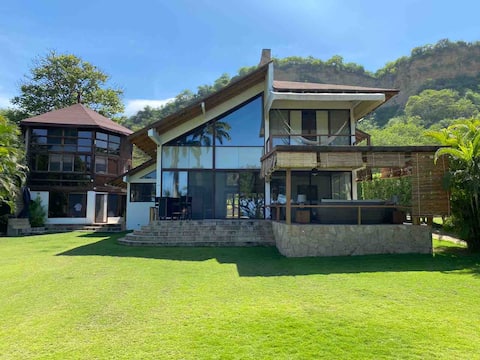
Spacious beach/country house in a private community
Entire Place • 5 bedrooms
Note: Performance varies based on location, size, amenities, seasonality, and management quality. Data reflects the past 12 months.
Top Performing Airbnb Hosts in Olón (2026)
Learn from the best! This table showcases top-performing Airbnb hosts in Olón based on the number of properties managed and estimated total revenue over the past year. Analyze their scale and performance metrics.
| Host Name | Properties | Grossing Revenue | Stay Reviews | Avg Rating |
|---|---|---|---|---|
| Lady | 8 | $107,234 | 138 | 4.86/5.0 |
| Roey | 7 | $104,571 | 45 | 4.88/5.0 |
| Rebeca | 1 | $57,544 | 50 | 4.92/5.0 |
| Juan Manuel | 3 | $45,924 | 36 | 4.67/5.0 |
| Ana Maria | 3 | $44,785 | 30 | 4.61/5.0 |
| Cristian | 2 | $38,131 | 268 | 4.92/5.0 |
| Maria | 1 | $38,082 | 1 | Not Rated |
| Carlos Alberto | 1 | $26,839 | 147 | 4.97/5.0 |
| Adam | 2 | $25,819 | 248 | 4.97/5.0 |
| Juan Francisco | 3 | $24,774 | 24 | 4.73/5.0 |
Analyzing the strategies of top hosts, such as their property selection, pricing, and guest communication, can offer valuable lessons for optimizing your own Airbnb operations in Olón.
Dive Deeper: Advanced Olón STR Market Data (2026)
Ready to unlock more insights? AirROI provides access to advanced metrics and comprehensive Airbnb data for Olón. Explore detailed analytics beyond this report to refine your investment strategy, optimize pricing, and maximize your vacation rental profits.
Explore Advanced MetricsOlón Short-Term Rental Market Composition (2026): Property & Room Types
Room Type Distribution
Property Type Distribution
Market Composition Insights for Olón
- The Olón Airbnb market composition is heavily skewed towards Entire Home/Apt listings, which make up 73% of the 178 active rentals. This indicates strong guest preference for privacy and space.
- Looking at the property type distribution in Olón, House properties are the most common (50.6%), reflecting the local real estate landscape.
- Houses represent a significant 50.6% portion, catering likely to families or larger groups.
- The presence of 15.7% Hotel/Boutique listings indicates integration with traditional hospitality.
- Smaller segments like others, unique stays (combined 2.8%) offer potential for unique stay experiences.
Olón Airbnb Room Capacity Analysis (2026): Bedroom Distribution
Distribution of Listings by Number of Bedrooms
Room Capacity Insights for Olón
- The dominant room capacity in Olón is 1 bedroom listings, making up 33.1% of the market. This suggests a strong demand for properties suitable for couples or solo travelers.
- Together, 1 bedroom and 3 bedrooms properties represent 59.5% of the active Airbnb listings in Olón, indicating a high concentration in these sizes.
- A significant 38.8% of listings offer 3+ bedrooms, catering to larger groups and families seeking more space in Olón.
Olón Vacation Rental Guest Capacity Trends (2026)
Distribution of Listings by Guest Capacity
Guest Capacity Insights for Olón
- The most common guest capacity trend in Olón vacation rentals is listings accommodating 8+ guests (32%). This suggests the primary traveler segment is likely larger groups.
- Properties designed for 8+ guests and 4 guests dominate the Olón STR market, accounting for 47.7% of listings.
- 44.4% of properties accommodate 6+ guests, serving the market segment for larger families or group travel in Olón.
- On average, properties in Olón are equipped to host 4.9 guests.
Olón Airbnb Booking Patterns (2026): Available vs. Booked Days
Available Days Distribution
Booked Days Distribution
Booking Pattern Insights for Olón
- The most common availability pattern in Olón falls within the 271-366 days range, representing 82.6% of listings. This suggests many properties have significant open periods on their calendars.
- Approximately 97.2% of listings show high availability (181+ days open annually), indicating potential for increased bookings or specific owner usage patterns.
- For booked days, the 1-30 days range is most frequent in Olón (40.4%), reflecting common guest stay durations or potential owner blocking patterns.
- A notable 2.8% of properties secure long booking periods (181+ days booked per year), highlighting successful long-term rental strategies or significant owner usage.
Olón Airbnb Minimum Stay Requirements Analysis
Distribution of Listings by Minimum Night Requirement
1 Night
98 listings
55.1% of total
2 Nights
41 listings
23% of total
3 Nights
7 listings
3.9% of total
4-6 Nights
2 listings
1.1% of total
30+ Nights
30 listings
16.9% of total
Key Insights
- The most prevalent minimum stay requirement in Olón is 1 Night, adopted by 55.1% of listings. This highlights the market's preference for shorter, flexible bookings.
- A strong majority (78.1%) of the Olón Airbnb data shows acceptance of very short stays (1-2 nights), indicating a dynamic, high-turnover market.
- A significant segment (16.9%) caters to monthly stays (30+ nights) in Olón, pointing to opportunities in the extended-stay market.
Recommendations
- Align with the market by considering a 1 Night minimum stay, as 55.1% of Olón hosts use this setting.
- Explore offering discounts for stays of 30+ nights to attract the 16.9% of the market seeking extended stays.
- Adjust minimum nights based on seasonality – potentially shorter during low season and longer during peak demand periods in Olón.
Olón Airbnb Cancellation Policy Trends Analysis (2026)
Limited
2 listings
1.1% of total
Super Strict 60 Days
1 listings
0.6% of total
Flexible
43 listings
24.2% of total
Moderate
71 listings
39.9% of total
Firm
54 listings
30.3% of total
Strict
7 listings
3.9% of total
Cancellation Policy Insights for Olón
- The prevailing Airbnb cancellation policy trend in Olón is Moderate, used by 39.9% of listings.
- There's a relatively balanced mix between guest-friendly (64.1%) and stricter (34.2%) policies, offering choices for different guest needs.
- Strict cancellation policies are quite rare (3.9%), potentially making listings with this policy less competitive unless justified by high demand or property type.
Recommendations for Hosts
- Consider adopting a Moderate policy to align with the 39.9% market standard in Olón.
- Using a Strict policy might deter some guests, as only 3.9% of listings use it. Evaluate if potential revenue protection outweighs possible lower booking rates.
- Regularly review your cancellation policy against competitors and market demand shifts in Olón.
Olón STR Booking Lead Time Analysis (2026)
Average Booking Lead Time by Month
Booking Lead Time Insights for Olón
- The overall average booking lead time for vacation rentals in Olón is 27 days.
- Guests book furthest in advance for stays during December (average 60 days), likely coinciding with peak travel demand or local events.
- The shortest booking windows occur for stays in July (average 19 days), indicating more last-minute travel plans during this time.
- Seasonally, Winter (40 days avg.) sees the longest lead times, while Summer (20 days avg.) has the shortest, reflecting typical travel planning cycles.
Recommendations for Hosts
- Use the overall average lead time (27 days) as a baseline for your pricing and availability strategy in Olón.
- For December stays, consider implementing length-of-stay discounts or slightly higher rates for bookings made less than 60 days out to capitalize on advance planning.
- Target marketing efforts for the Winter season well in advance (at least 40 days) to capture early planners.
- Monitor your own booking lead times against these Olón averages to identify opportunities for dynamic pricing adjustments.
Popular & Essential Airbnb Amenities in Olón (2026)
Amenity Prevalence
Amenity Insights for Olón
- Essential amenities in Olón that guests expect include: Wifi. Lacking these (this) could significantly impact bookings.
- Popular amenities like Air conditioning, Free parking on premises, Kitchen are common but not universal. Offering these can provide a competitive edge.
Recommendations for Hosts
- Ensure your listing includes all essential amenities for Olón: Wifi.
- Prioritize adding missing essentials: Wifi.
- Consider adding popular differentiators like Air conditioning or Free parking on premises to increase appeal.
- Highlight unique or less common amenities you offer (e.g., hot tub, dedicated workspace, EV charger) in your listing description and photos.
- Regularly check competitor amenities in Olón to stay competitive.
Olón Airbnb Guest Demographics & Profile Analysis (2026)
Guest Profile Summary for Olón
- The typical guest profile for Airbnb in Olón consists of primarily domestic travelers (79%), often arriving from nearby Guayaquil, typically belonging to the Post-2000s (Gen Z/Alpha) group (50%), primarily speaking Spanish or English.
- Domestic travelers account for 79.1% of guests.
- Key international markets include Ecuador (79.1%) and United States (11.1%).
- Top languages spoken are Spanish (49%) followed by English (38.7%).
- A significant demographic segment is the Post-2000s (Gen Z/Alpha) group, representing 50% of guests.
Recommendations for Hosts
- Target domestic marketing efforts towards travelers from Guayaquil and Quito.
- Tailor amenities and listing descriptions to appeal to the dominant Post-2000s (Gen Z/Alpha) demographic (e.g., highlight fast WiFi, smart home features, local guides).
- Highlight unique local experiences or amenities relevant to the primary guest profile.
- Consider seasonal promotions aligned with peak travel times for key origin markets.
Nearby Short-Term Rental Market Comparison
How does the Olón Airbnb market stack up against its neighbors? Compare key performance metrics like average monthly revenue, ADR, and occupancy rates in surrounding areas to understand the broader regional STR landscape.
| Market | Active Properties | Monthly Revenue | Daily Rate | Avg. Occupancy |
|---|---|---|---|---|
| Curia | 30 | $1,454 | $243.84 | 22% |
| Jama | 50 | $1,145 | $187.29 | 24% |
| Parroquia Manglaralto | 26 | $1,076 | $204.86 | 20% |
| La Entrada | 38 | $968 | $203.21 | 26% |
| Sayausi | 14 | $951 | $175.56 | 19% |
| Ayangue | 58 | $861 | $150.30 | 18% |
| Punta Blanca | 16 | $600 | $200.44 | 15% |
| Jambelí | 13 | $585 | $98.18 | 16% |
| Santa Elena | 406 | $535 | $155.89 | 17% |
| Samborondón | 91 | $522 | $81.34 | 34% |