Tababela Airbnb Market Analysis 2026: Short Term Rental Data & Vacation Rental Statistics in Pichincha, Ecuador
Is Airbnb profitable in Tababela in 2026? Explore comprehensive Airbnb analytics for Tababela, Pichincha, Ecuador to uncover income potential. This 2026 STR market report for Tababela, based on AirROI data from February 2025 to January 2026, reveals key trends in the niche market of 33 active listings.
Whether you're considering an Airbnb investment in Tababela, optimizing your existing vacation rental, or exploring rental arbitrage opportunities, understanding the Tababela Airbnb data is crucial. Leveraging the low regulation environment is key to maximizing your short term rental income potential. Let's dive into the specifics.
Key Tababela Airbnb Performance Metrics Overview
Monthly Airbnb Revenue Variations & Income Potential in Tababela (2026)
Understanding the monthly revenue variations for Airbnb listings in Tababela is key to maximizing your short term rental income potential. Seasonality significantly impacts earnings. Our analysis, based on data from the past 12 months, shows that the peak revenue month for STRs in Tababela is typically February, while November often presents the lowest earnings, highlighting opportunities for strategic pricing adjustments during shoulder and low seasons. Explore the typical Airbnb income in Tababela across different performance tiers:
- Best-in-class properties (Top 10%) achieve $986+ monthly, often utilizing dynamic pricing and superior guest experiences.
- Strong performing properties (Top 25%) earn $593 or more, indicating effective management and desirable locations/amenities.
- Typical properties (Median) generate around $310 per month, representing the average market performance.
- Entry-level properties (Bottom 25%) see earnings around $139, often with potential for optimization.
Average Monthly Airbnb Earnings Trend in Tababela
Tababela Airbnb Occupancy Rate Trends (2026)
Maximize your bookings by understanding the Tababela STR occupancy trends. Seasonal demand shifts significantly influence how often properties are booked. Typically, Februarysees the highest demand (peak season occupancy), while November experiences the lowest (low season). Effective strategies, like adjusting minimum stays or offering promotions, can boost occupancy during slower periods. Here's how different property tiers perform in Tababela:
- Best-in-class properties (Top 10%) achieve 48%+ occupancy, indicating high desirability and potentially optimized availability.
- Strong performing properties (Top 25%) maintain 32% or higher occupancy, suggesting good market fit and guest satisfaction.
- Typical properties (Median) have an occupancy rate around 16%.
- Entry-level properties (Bottom 25%) average 8% occupancy, potentially facing higher vacancy.
Average Monthly Occupancy Rate Trend in Tababela
Average Daily Rate (ADR) Airbnb Trends in Tababela (2026)
Effective short term rental pricing strategy in Tababela involves understanding monthly ADR fluctuations. The Average Daily Rate (ADR) for Airbnb in Tababela typically peaks in May and dips lowest during October. Leveraging Airbnb dynamic pricing tools or strategies based on this seasonality can significantly boost revenue. Here's a look at the typical nightly rates achieved:
- Best-in-class properties (Top 10%) command rates of $166+ per night, often due to premium features or locations.
- Strong performing properties (Top 25%) achieve nightly rates of $129 or more.
- Typical properties (Median) charge around $50 per night.
- Entry-level properties (Bottom 25%) earn around $31 per night.
Average Daily Rate (ADR) Trend by Month in Tababela
Get Live Tababela Market Intelligence 👇

Explore Real-time Analytics
Airbnb Seasonality Analysis & Trends in Tababela (2026)
Peak Season (February, July, March)
- Revenue averages $508 per month
- Occupancy rates average 25.9%
- Daily rates average $77
Shoulder Season
- Revenue averages $432 per month
- Occupancy maintains around 22.1%
- Daily rates hold near $77
Low Season (January, September, November)
- Revenue drops to average $298 per month
- Occupancy decreases to average 18.5%
- Daily rates adjust to average $75
Seasonality Insights for Tababela
- The Airbnb seasonality in Tababela shows moderate seasonality with distinct peak and low periods. While the sections above show seasonal averages, it's also insightful to look at the extremes:
- During the high season, the absolute peak month showcases Tababela's highest earning potential, with monthly revenues capable of climbing to $559, occupancy reaching a high of 27.6%, and ADRs peaking at $79.
- Conversely, the slowest single month of the year, typically falling within the low season, marks the market's lowest point. In this month, revenue might dip to $275, occupancy could drop to 16.1%, and ADRs may adjust down to $75.
- Understanding both the seasonal averages and these monthly peaks and troughs in revenue, occupancy, and ADR is crucial for maximizing your Airbnb profit potential in Tababela.
Seasonal Strategies for Maximizing Profit
- Peak Season: Maximize revenue through premium pricing and potentially longer minimum stays. Ensure high availability.
- Low Season: Offer competitive pricing, special promotions (e.g., extended stay discounts), and flexible cancellation policies. Target off-season travelers like remote workers or budget-conscious guests.
- Shoulder Seasons: Implement dynamic pricing that balances peak and low rates. Target weekend travelers or specific events. Offer slightly more flexible terms than peak season.
- Regularly analyze your own performance against these Tababela seasonality benchmarks and adjust your pricing and availability strategy accordingly.
Best Areas for Airbnb Investment in Tababela (2026)
Exploring the top neighborhoods for short-term rentals in Tababela? This section highlights key areas, outlining why they are attractive for hosts and guests, along with notable local attractions. Consider these locations based on your target guest profile and investment strategy.
| Neighborhood / Area | Why Host Here? (Target Guests & Appeal) | Key Attractions & Landmarks |
|---|---|---|
| Tababela Central | Main area in Tababela known for its proximity to the Quito International Airport, making it convenient for travelers. It provides easy access to both urban amenities and rural attractions. | Quito International Airport, Local food markets, Andean landscapes, Cultural festivals, Bird watching spots |
| Cumbayá | Just a short drive from Tababela, this area is popular among expatriates and families for its tranquil environment and good schools. Ideal for longer stays and family-friendly experiences. | Universidad San Francisco de Quito, Shopping centers, Local parks, Educational institutions, Restaurants and cafes |
| Puembo | Known for its serene atmosphere and beautiful countryside, Puembo is a favorite among those looking for a peaceful escape. It's also close to many outdoor activities. | Puembo Birding Garden, Outdoor sports facilities, Horse riding, Local artisan markets, Cultural sites |
| San Antonio de Pichincha | A laid-back area with a strong local culture offering visitors a glimpse into rural Ecuadorian life. Close to natural attractions and hiking opportunities. | Viewpoints of the Andes, Hiking trails, Cultural heritage sites, Traditional markets, Local eateries |
| Cotogchoa | A small town near Tababela showcasing traditional Ecuadorian life. Perfect for immersive cultural experiences and community engagement. | Traditional music and dance events, Local festivals, Andean landscapes, Craft markets, Historical churches |
| Chiche | A rural area known for its farming activities and proximity to natural reserves. Great for eco-tourists looking to explore the Ecuadorian countryside. | Nature reserves, Farming tours, Hiking spots, Wildlife watching, Local festivals |
| Alfredo Baquerizo Moreno | A suburban neighborhood ideal for visitors wanting to avoid the hustle and bustle of the city while still enjoying easy access to Quito. | Local parks, Restaurants, Community events, Shopping areas, Natural scenery |
| La Lloa | A lesser-known village with rich cultural heritage and beautiful landscapes, offering a unique experience to those who venture off the beaten path. | Cultural heritage sites, Natural reserves, Local traditions, Community interactions, Scenic viewpoints |
Understanding Airbnb License Requirements & STR Laws in Tababela (2026)
While Tababela, Pichincha, Ecuador currently shows low STR regulations, specific Airbnb license requirements might still exist or change. Always verify the latest short term rental regulations and Airbnb license requirements directly with local government authorities for Tababela to ensure full compliance before hosting.
(Source: AirROI data, 2026, finding no licensed listings among those analyzed)
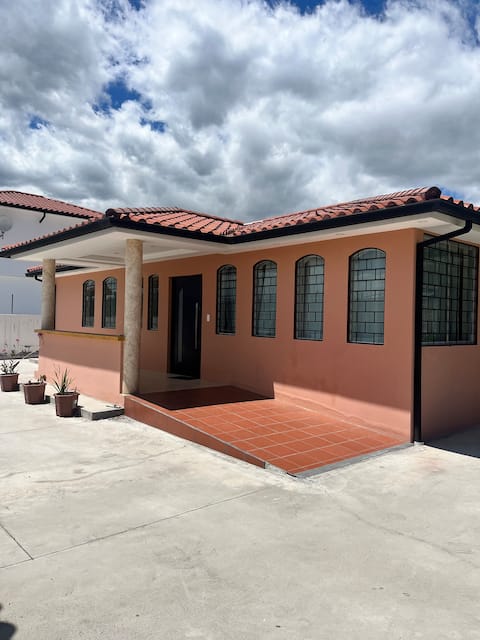
Top Performing Airbnb Properties in Tababela (2026)
Benchmark your potential! Explore examples of top-performing Airbnb properties in Tababelabased on Trailing Twelve Month (TTM) revenue. Analyze their characteristics, revenue, occupancy rate, and ADR to understand what drives success in this market.

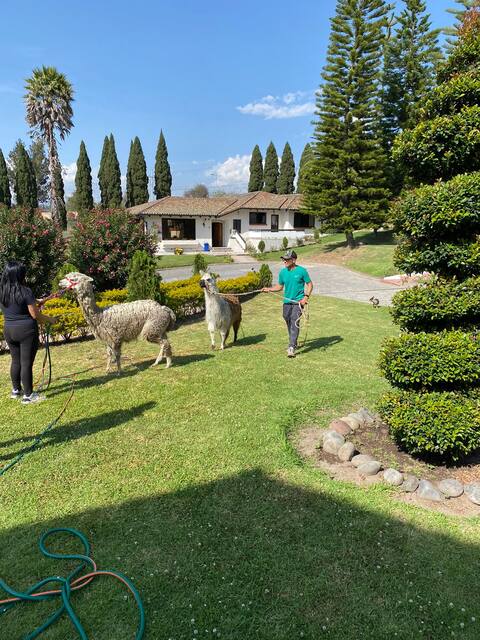
10 Hectare Alpaca Farm Across from Airport
Private Room • N/A
24 hr Shuttle airport Quito
Entire Place • 3 bedrooms
24HR Quito Airport Pick Up / Drop Off
Private Room • N/A

Tabla Bella
Entire Place • 1 bedroom
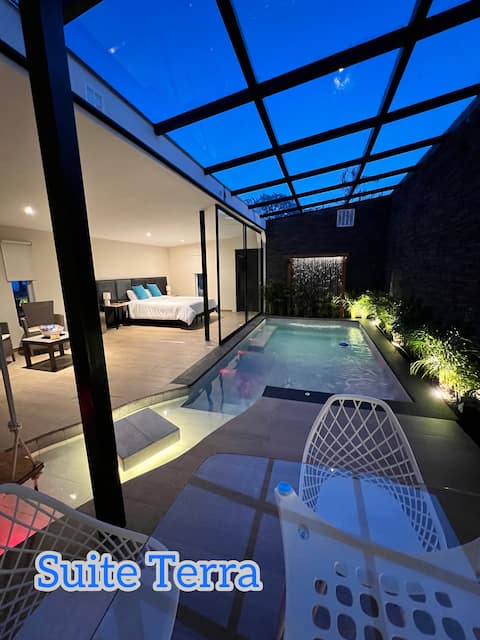
Waterfall, swimming pool, private jacuzzi
Private Room • N/A
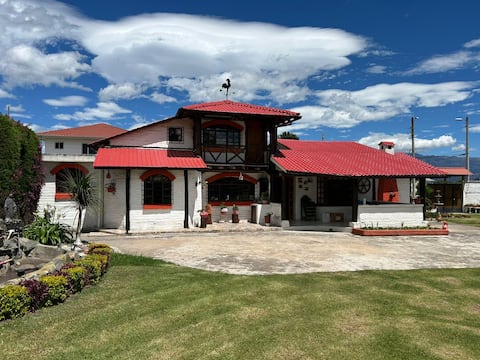
Beautiful cottage near Quito airport
Entire Place • 4 bedrooms
Note: Performance varies based on location, size, amenities, seasonality, and management quality. Data reflects the past 12 months.
Top Performing Airbnb Hosts in Tababela (2026)
Learn from the best! This table showcases top-performing Airbnb hosts in Tababela based on the number of properties managed and estimated total revenue over the past year. Analyze their scale and performance metrics.
| Host Name | Properties | Grossing Revenue | Stay Reviews | Avg Rating |
|---|---|---|---|---|
| Samay | 8 | $31,376 | 121 | 4.92/5.0 |
| Domenick | 2 | $20,570 | 416 | 4.76/5.0 |
| Casa Camila | 3 | $17,463 | 283 | 4.87/5.0 |
| Andres | 5 | $14,285 | 32 | 4.91/5.0 |
| Santiago | 3 | $10,108 | 120 | 4.94/5.0 |
| Tatiana | 1 | $8,293 | 70 | 4.77/5.0 |
| Hernan | 1 | $6,879 | 69 | 4.83/5.0 |
| Dyana Leon | 1 | $3,522 | 130 | 4.91/5.0 |
| Christian | 1 | $2,359 | 78 | 4.79/5.0 |
| Sofia | 1 | $2,357 | 16 | 4.81/5.0 |
Analyzing the strategies of top hosts, such as their property selection, pricing, and guest communication, can offer valuable lessons for optimizing your own Airbnb operations in Tababela.
Dive Deeper: Advanced Tababela STR Market Data (2026)
Ready to unlock more insights? AirROI provides access to advanced metrics and comprehensive Airbnb data for Tababela. Explore detailed analytics beyond this report to refine your investment strategy, optimize pricing, and maximize your vacation rental profits.
Explore Advanced MetricsTababela Short-Term Rental Market Composition (2026): Property & Room Types
Room Type Distribution
Property Type Distribution
Market Composition Insights for Tababela
- The Tababela Airbnb market composition is heavily skewed towards Entire Home/Apt listings, which make up 57.6% of the 33 active rentals. This indicates strong guest preference for privacy and space.
- However, a notable 36.4% share for Private Rooms suggests opportunities for budget-conscious travelers or hosts renting out spare rooms.
- Looking at the property type distribution in Tababela, Hotel/Boutique properties are the most common (39.4%), reflecting the local real estate landscape.
- Houses represent a significant 21.2% portion, catering likely to families or larger groups.
- The presence of 39.4% Hotel/Boutique listings indicates integration with traditional hospitality.
- Smaller segments like unique stays (combined 3.0%) offer potential for unique stay experiences.
Tababela Airbnb Room Capacity Analysis (2026): Bedroom Distribution
Distribution of Listings by Number of Bedrooms
Room Capacity Insights for Tababela
- The dominant room capacity in Tababela is 1 bedroom listings, making up 63.6% of the market. This suggests a strong demand for properties suitable for couples or solo travelers.
- Together, 1 bedroom and 3 bedrooms properties represent 69.7% of the active Airbnb listings in Tababela, indicating a high concentration in these sizes.
- With over half the market (63.6%) consisting of studios or 1-bedroom units, Tababela is particularly well-suited for individuals or couples.
Tababela Vacation Rental Guest Capacity Trends (2026)
Distribution of Listings by Guest Capacity
Guest Capacity Insights for Tababela
- The most common guest capacity trend in Tababela vacation rentals is listings accommodating 2 guests (42.4%). This suggests the primary traveler segment is likely couples or solo travelers.
- Properties designed for 2 guests and 8+ guests dominate the Tababela STR market, accounting for 54.5% of listings.
- A significant 42.4% of listings cater specifically to 1-2 guests, highlighting strong demand from couples and solo travelers in Tababela.
- 18.1% of properties accommodate 6+ guests, serving the market segment for larger families or group travel in Tababela.
- On average, properties in Tababela are equipped to host 3.1 guests.
Tababela Airbnb Booking Patterns (2026): Available vs. Booked Days
Available Days Distribution
Booked Days Distribution
Booking Pattern Insights for Tababela
- The most common availability pattern in Tababela falls within the 271-366 days range, representing 78.8% of listings. This suggests many properties have significant open periods on their calendars.
- Approximately 97.0% of listings show high availability (181+ days open annually), indicating potential for increased bookings or specific owner usage patterns.
- For booked days, the 31-90 days range is most frequent in Tababela (42.4%), reflecting common guest stay durations or potential owner blocking patterns.
- A notable 3.0% of properties secure long booking periods (181+ days booked per year), highlighting successful long-term rental strategies or significant owner usage.
Tababela Airbnb Minimum Stay Requirements Analysis
Distribution of Listings by Minimum Night Requirement
1 Night
32 listings
97% of total
30+ Nights
1 listings
3% of total
Key Insights
- The most prevalent minimum stay requirement in Tababela is 1 Night, adopted by 97% of listings. This highlights the market's preference for shorter, flexible bookings.
- A strong majority (97.0%) of the Tababela Airbnb data shows acceptance of very short stays (1-2 nights), indicating a dynamic, high-turnover market.
Recommendations
- Align with the market by considering a 1 Night minimum stay, as 97% of Tababela hosts use this setting.
- Adjust minimum nights based on seasonality – potentially shorter during low season and longer during peak demand periods in Tababela.
Tababela Airbnb Cancellation Policy Trends Analysis (2026)
Flexible
14 listings
42.4% of total
Moderate
7 listings
21.2% of total
Firm
3 listings
9.1% of total
Strict
9 listings
27.3% of total
Cancellation Policy Insights for Tababela
- The prevailing Airbnb cancellation policy trend in Tababela is Flexible, used by 42.4% of listings.
- There's a relatively balanced mix between guest-friendly (63.6%) and stricter (36.4%) policies, offering choices for different guest needs.
Recommendations for Hosts
- Consider adopting a Flexible policy to align with the 42.4% market standard in Tababela.
- Regularly review your cancellation policy against competitors and market demand shifts in Tababela.
Tababela STR Booking Lead Time Analysis (2026)
Average Booking Lead Time by Month
Booking Lead Time Insights for Tababela
- The overall average booking lead time for vacation rentals in Tababela is 20 days.
- Guests book furthest in advance for stays during January (average 30 days), likely coinciding with peak travel demand or local events.
- The shortest booking windows occur for stays in March (average 11 days), indicating more last-minute travel plans during this time.
- Seasonally, Winter (23 days avg.) sees the longest lead times, while Spring (14 days avg.) has the shortest, reflecting typical travel planning cycles.
Recommendations for Hosts
- Use the overall average lead time (20 days) as a baseline for your pricing and availability strategy in Tababela.
- During March, focus on last-minute booking availability and promotions, as guests book with very short notice (11 days avg.).
- Target marketing efforts for the Winter season well in advance (at least 23 days) to capture early planners.
- Monitor your own booking lead times against these Tababela averages to identify opportunities for dynamic pricing adjustments.
Popular & Essential Airbnb Amenities in Tababela (2026)
Amenity Prevalence
Amenity Insights for Tababela
- Essential amenities in Tababela that guests expect include: Wifi, Free parking on premises. Lacking these (any) could significantly impact bookings.
- Popular amenities like TV, Bed linens, Hot water are common but not universal. Offering these can provide a competitive edge.
Recommendations for Hosts
- Ensure your listing includes all essential amenities for Tababela: Wifi, Free parking on premises.
- Prioritize adding missing essentials: Free parking on premises.
- Consider adding popular differentiators like TV or Bed linens to increase appeal.
- Highlight unique or less common amenities you offer (e.g., hot tub, dedicated workspace, EV charger) in your listing description and photos.
- Regularly check competitor amenities in Tababela to stay competitive.
Tababela Airbnb Guest Demographics & Profile Analysis (2026)
Guest Profile Summary for Tababela
- The typical guest profile for Airbnb in Tababela consists of predominantly international visitors (66%), with top international origins including Ecuador, typically belonging to the Post-2000s (Gen Z/Alpha) group (50%), primarily speaking English or Spanish.
- Domestic travelers account for 34.0% of guests.
- Key international markets include United States (38.5%) and Ecuador (34%).
- Top languages spoken are English (44.4%) followed by Spanish (37.2%).
- A significant demographic segment is the Post-2000s (Gen Z/Alpha) group, representing 50% of guests.
Recommendations for Hosts
- Focus marketing internationally, particularly towards travelers from Ecuador.
- Tailor amenities and listing descriptions to appeal to the dominant Post-2000s (Gen Z/Alpha) demographic (e.g., highlight fast WiFi, smart home features, local guides).
- Highlight unique local experiences or amenities relevant to the primary guest profile.
- Consider seasonal promotions aligned with peak travel times for key origin markets.
Nearby Short-Term Rental Market Comparison
How does the Tababela Airbnb market stack up against its neighbors? Compare key performance metrics like average monthly revenue, ADR, and occupancy rates in surrounding areas to understand the broader regional STR landscape.