Sangolquí Airbnb Market Analysis 2026: Short Term Rental Data & Vacation Rental Statistics in Pichincha, Ecuador
Is Airbnb profitable in Sangolquí in 2026? Explore comprehensive Airbnb analytics for Sangolquí, Pichincha, Ecuador to uncover income potential. This 2026 STR market report for Sangolquí, based on AirROI data from February 2025 to January 2026, reveals key trends in the niche market of 47 active listings.
Whether you're considering an Airbnb investment in Sangolquí, optimizing your existing vacation rental, or exploring rental arbitrage opportunities, understanding the Sangolquí Airbnb data is crucial. Leveraging the low regulation environment is key to maximizing your short term rental income potential. Let's dive into the specifics.
Key Sangolquí Airbnb Performance Metrics Overview
Monthly Airbnb Revenue Variations & Income Potential in Sangolquí (2026)
Understanding the monthly revenue variations for Airbnb listings in Sangolquí is key to maximizing your short term rental income potential. Seasonality significantly impacts earnings. Our analysis, based on data from the past 12 months, shows that the peak revenue month for STRs in Sangolquí is typically March, while October often presents the lowest earnings, highlighting opportunities for strategic pricing adjustments during shoulder and low seasons. Explore the typical Airbnb income in Sangolquí across different performance tiers:
- Best-in-class properties (Top 10%) achieve $945+ monthly, often utilizing dynamic pricing and superior guest experiences.
- Strong performing properties (Top 25%) earn $449 or more, indicating effective management and desirable locations/amenities.
- Typical properties (Median) generate around $211 per month, representing the average market performance.
- Entry-level properties (Bottom 25%) see earnings around $104, often with potential for optimization.
Average Monthly Airbnb Earnings Trend in Sangolquí
Sangolquí Airbnb Occupancy Rate Trends (2026)
Maximize your bookings by understanding the Sangolquí STR occupancy trends. Seasonal demand shifts significantly influence how often properties are booked. Typically, Novembersees the highest demand (peak season occupancy), while October experiences the lowest (low season). Effective strategies, like adjusting minimum stays or offering promotions, can boost occupancy during slower periods. Here's how different property tiers perform in Sangolquí:
- Best-in-class properties (Top 10%) achieve 62%+ occupancy, indicating high desirability and potentially optimized availability.
- Strong performing properties (Top 25%) maintain 40% or higher occupancy, suggesting good market fit and guest satisfaction.
- Typical properties (Median) have an occupancy rate around 18%.
- Entry-level properties (Bottom 25%) average 10% occupancy, potentially facing higher vacancy.
Average Monthly Occupancy Rate Trend in Sangolquí
Average Daily Rate (ADR) Airbnb Trends in Sangolquí (2026)
Effective short term rental pricing strategy in Sangolquí involves understanding monthly ADR fluctuations. The Average Daily Rate (ADR) for Airbnb in Sangolquí typically peaks in September and dips lowest during July. Leveraging Airbnb dynamic pricing tools or strategies based on this seasonality can significantly boost revenue. Here's a look at the typical nightly rates achieved:
- Best-in-class properties (Top 10%) command rates of $138+ per night, often due to premium features or locations.
- Strong performing properties (Top 25%) achieve nightly rates of $68 or more.
- Typical properties (Median) charge around $37 per night.
- Entry-level properties (Bottom 25%) earn around $26 per night.
Average Daily Rate (ADR) Trend by Month in Sangolquí
Get Live Sangolquí Market Intelligence 👇

Explore Real-time Analytics
Airbnb Seasonality Analysis & Trends in Sangolquí (2026)
Peak Season (March, December, November)
- Revenue averages $508 per month
- Occupancy rates average 32.6%
- Daily rates average $85
Shoulder Season
- Revenue averages $362 per month
- Occupancy maintains around 25.5%
- Daily rates hold near $86
Low Season (February, April, October)
- Revenue drops to average $268 per month
- Occupancy decreases to average 24.4%
- Daily rates adjust to average $85
Seasonality Insights for Sangolquí
- The Airbnb seasonality in Sangolquí shows highly seasonal trends requiring careful strategy. While the sections above show seasonal averages, it's also insightful to look at the extremes:
- During the high season, the absolute peak month showcases Sangolquí's highest earning potential, with monthly revenues capable of climbing to $643, occupancy reaching a high of 35.3%, and ADRs peaking at $90.
- Conversely, the slowest single month of the year, typically falling within the low season, marks the market's lowest point. In this month, revenue might dip to $209, occupancy could drop to 15.9%, and ADRs may adjust down to $84.
- Understanding both the seasonal averages and these monthly peaks and troughs in revenue, occupancy, and ADR is crucial for maximizing your Airbnb profit potential in Sangolquí.
Seasonal Strategies for Maximizing Profit
- Peak Season: Maximize revenue through premium pricing and potentially longer minimum stays. Ensure high availability.
- Low Season: Offer competitive pricing, special promotions (e.g., extended stay discounts), and flexible cancellation policies. Target off-season travelers like remote workers or budget-conscious guests.
- Shoulder Seasons: Implement dynamic pricing that balances peak and low rates. Target weekend travelers or specific events. Offer slightly more flexible terms than peak season.
- Regularly analyze your own performance against these Sangolquí seasonality benchmarks and adjust your pricing and availability strategy accordingly.
Best Areas for Airbnb Investment in Sangolquí (2026)
Exploring the top neighborhoods for short-term rentals in Sangolquí? This section highlights key areas, outlining why they are attractive for hosts and guests, along with notable local attractions. Consider these locations based on your target guest profile and investment strategy.
| Neighborhood / Area | Why Host Here? (Target Guests & Appeal) | Key Attractions & Landmarks |
|---|---|---|
| Centro Histórico de Sangolquí | The historic center of Sangolquí offers charming colonial architecture, vibrant local culture, and is close to local markets, making it attractive for tourists wanting an authentic experience. | Iglesia de Sangolquí, Plaza de Sangolquí, Mercado Municipal, Teatro Nacional, Parque Central |
| El Rancho | A serene neighborhood known for its natural beauty, parks, and family-friendly atmosphere, ideal for visitors looking to enjoy a more tranquil setting while still being close to the city. | Parque La Carolina, Parque del Arbolito, Parque de la Concepción |
| San Pedro de Taboada | This area is popular for its rural and natural landscape, attracting tourists looking for outdoor activities such as hiking and mountain biking, with picturesque views. | Cerro de la Virgen, Hiking trails, Natural reserves, Viewpoints |
| Sangolquí Centro | A bustling central area with shops, restaurants, and local attractions. It’s ideal for visitors who want easy access to amenities and a vibrant local experience. | Shopping centers, Local eateries, Cafes, Cultural events |
| La Universidad | Near various educational institutions, this area is popular with students and academic travelers, featuring many affordable dining and lodging options. | Universidad San Francisco de Quito, Universities, Libraries, Student hangouts |
| La Rumiñahui | Known for its beautiful parks and outdoor spaces, this area attracts families and nature lovers, providing ample opportunities for outdoor recreation. | Parque Rumiñahui, Outdoor sports areas, Playgrounds |
| Pueblo de Sangolquí | A quaint neighborhood with a strong sense of community, it features local markets and events, catering to travelers seeking to experience authentic local life. | Local markets, Cultural festivals, Community events |
| Los Chillos | This suburban area is favored for its spacious homes and proximity to nature, perfect for families and long-term stays, while still being accessible to Sangolquí's attractions. | Nature parks, Hiking areas, Family-friendly venues |
Understanding Airbnb License Requirements & STR Laws in Sangolquí (2026)
While Sangolquí, Pichincha, Ecuador currently shows low STR regulations, specific Airbnb license requirements might still exist or change. Always verify the latest short term rental regulations and Airbnb license requirements directly with local government authorities for Sangolquí to ensure full compliance before hosting.
(Source: AirROI data, 2026, finding no licensed listings among those analyzed)
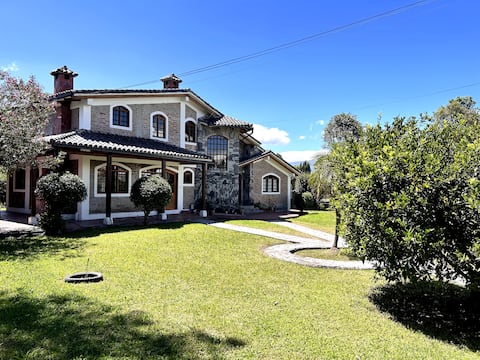
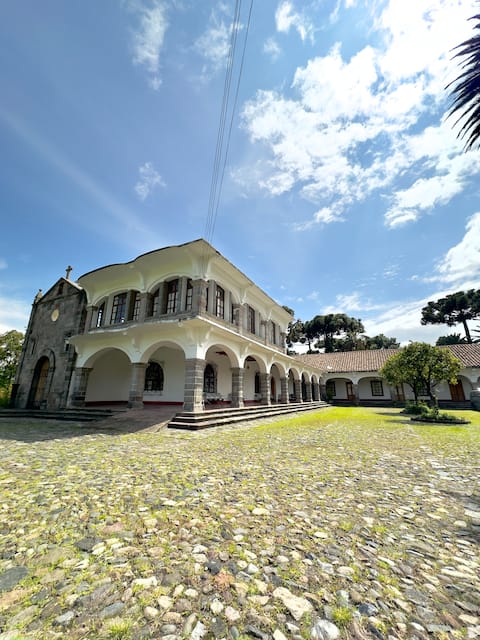
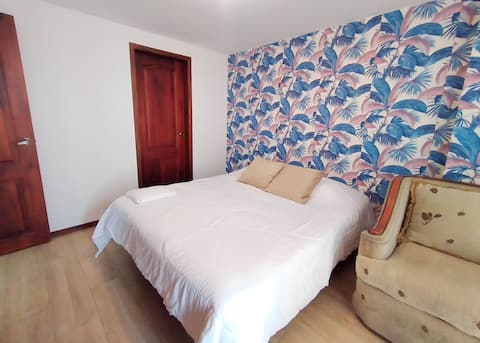
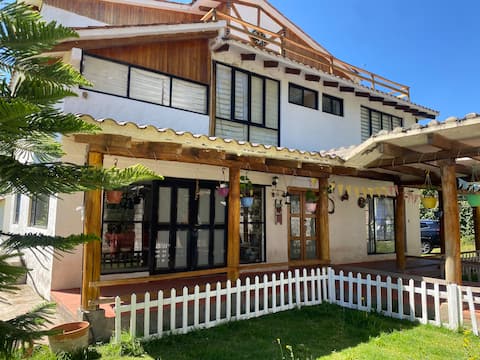
Top Performing Airbnb Properties in Sangolquí (2026)
Benchmark your potential! Explore examples of top-performing Airbnb properties in Sangolquíbased on Trailing Twelve Month (TTM) revenue. Analyze their characteristics, revenue, occupancy rate, and ADR to understand what drives success in this market.

Quinta Ilusión Rumiloma, Events and Accommodation
Entire Place • 6 bedrooms
Amazing house in Sangolquí
Entire Place • 3 bedrooms
Pet friendly | Sports courts | 80 m² | Private
Entire Place • 4 bedrooms
Casa Daliz, Sangolqui
Entire Place • 4 bedrooms
Beautiful and cozy Quinta. Valley of Los Chillos
Entire Place • 3 bedrooms
Beautiful house, in front of Club los Chillos
Entire Place • 3 bedrooms
Note: Performance varies based on location, size, amenities, seasonality, and management quality. Data reflects the past 12 months.
Top Performing Airbnb Hosts in Sangolquí (2026)
Learn from the best! This table showcases top-performing Airbnb hosts in Sangolquí based on the number of properties managed and estimated total revenue over the past year. Analyze their scale and performance metrics.
| Host Name | Properties | Grossing Revenue | Stay Reviews | Avg Rating |
|---|---|---|---|---|
| Quinta Ilusión Rumiloma | 1 | $12,118 | 47 | 4.91/5.0 |
| Jaime | 1 | $11,017 | 23 | 4.96/5.0 |
| Julian | 2 | $10,780 | 44 | 4.84/5.0 |
| Fabricio | 3 | $9,858 | 67 | 4.77/5.0 |
| Patricia | 4 | $7,110 | 25 | 4.67/5.0 |
| Nelly | 1 | $4,814 | 16 | 5.00/5.0 |
| Carlos | 2 | $4,472 | 35 | 4.92/5.0 |
| Xavier | 1 | $4,205 | 6 | 4.67/5.0 |
| Alejandro | 1 | $3,072 | 5 | 4.80/5.0 |
| Kelly | 1 | $2,858 | 12 | 5.00/5.0 |
Analyzing the strategies of top hosts, such as their property selection, pricing, and guest communication, can offer valuable lessons for optimizing your own Airbnb operations in Sangolquí.
Dive Deeper: Advanced Sangolquí STR Market Data (2026)
Ready to unlock more insights? AirROI provides access to advanced metrics and comprehensive Airbnb data for Sangolquí. Explore detailed analytics beyond this report to refine your investment strategy, optimize pricing, and maximize your vacation rental profits.
Explore Advanced MetricsSangolquí Short-Term Rental Market Composition (2026): Property & Room Types
Room Type Distribution
Property Type Distribution
Market Composition Insights for Sangolquí
- The Sangolquí Airbnb market composition is heavily skewed towards Entire Home/Apt listings, which make up 83% of the 47 active rentals. This indicates strong guest preference for privacy and space.
- Looking at the property type distribution in Sangolquí, House properties are the most common (57.4%), reflecting the local real estate landscape.
- Houses represent a significant 57.4% portion, catering likely to families or larger groups.
- Smaller segments like hotel/boutique, others (combined 4.2%) offer potential for unique stay experiences.
Sangolquí Airbnb Room Capacity Analysis (2026): Bedroom Distribution
Distribution of Listings by Number of Bedrooms
Room Capacity Insights for Sangolquí
- The dominant room capacity in Sangolquí is 3 bedrooms listings, making up 27.7% of the market. This suggests a strong demand for properties suitable for families or small groups.
- Together, 3 bedrooms and 2 bedrooms properties represent 51.1% of the active Airbnb listings in Sangolquí, indicating a high concentration in these sizes.
- A significant 49.0% of listings offer 3+ bedrooms, catering to larger groups and families seeking more space in Sangolquí.
Sangolquí Vacation Rental Guest Capacity Trends (2026)
Distribution of Listings by Guest Capacity
Guest Capacity Insights for Sangolquí
- The most common guest capacity trend in Sangolquí vacation rentals is listings accommodating 8+ guests (29.8%). This suggests the primary traveler segment is likely larger groups.
- Properties designed for 8+ guests and 4 guests dominate the Sangolquí STR market, accounting for 46.8% of listings.
- 38.3% of properties accommodate 6+ guests, serving the market segment for larger families or group travel in Sangolquí.
- On average, properties in Sangolquí are equipped to host 4.5 guests.
Sangolquí Airbnb Booking Patterns (2026): Available vs. Booked Days
Available Days Distribution
Booked Days Distribution
Booking Pattern Insights for Sangolquí
- The most common availability pattern in Sangolquí falls within the 271-366 days range, representing 85.1% of listings. This suggests many properties have significant open periods on their calendars.
- Approximately 100.0% of listings show high availability (181+ days open annually), indicating potential for increased bookings or specific owner usage patterns.
- For booked days, the 1-30 days range is most frequent in Sangolquí (46.8%), reflecting common guest stay durations or potential owner blocking patterns.
Sangolquí Airbnb Minimum Stay Requirements Analysis
Distribution of Listings by Minimum Night Requirement
1 Night
29 listings
61.7% of total
2 Nights
7 listings
14.9% of total
3 Nights
5 listings
10.6% of total
4-6 Nights
1 listings
2.1% of total
30+ Nights
5 listings
10.6% of total
Key Insights
- The most prevalent minimum stay requirement in Sangolquí is 1 Night, adopted by 61.7% of listings. This highlights the market's preference for shorter, flexible bookings.
- A strong majority (76.6%) of the Sangolquí Airbnb data shows acceptance of very short stays (1-2 nights), indicating a dynamic, high-turnover market.
- A significant segment (10.6%) caters to monthly stays (30+ nights) in Sangolquí, pointing to opportunities in the extended-stay market.
Recommendations
- Align with the market by considering a 1 Night minimum stay, as 61.7% of Sangolquí hosts use this setting.
- Explore offering discounts for stays of 30+ nights to attract the 10.6% of the market seeking extended stays.
- Adjust minimum nights based on seasonality – potentially shorter during low season and longer during peak demand periods in Sangolquí.
Sangolquí Airbnb Cancellation Policy Trends Analysis (2026)
Limited
1 listings
2.1% of total
Flexible
23 listings
48.9% of total
Moderate
22 listings
46.8% of total
Strict
1 listings
2.1% of total
Cancellation Policy Insights for Sangolquí
- The prevailing Airbnb cancellation policy trend in Sangolquí is Flexible, used by 48.9% of listings.
- The market strongly favors guest-friendly terms, with 95.7% of listings offering Flexible or Moderate policies. This suggests guests in Sangolquí may expect booking flexibility.
- Strict cancellation policies are quite rare (2.1%), potentially making listings with this policy less competitive unless justified by high demand or property type.
Recommendations for Hosts
- Consider adopting a Flexible policy to align with the 48.9% market standard in Sangolquí.
- Using a Strict policy might deter some guests, as only 2.1% of listings use it. Evaluate if potential revenue protection outweighs possible lower booking rates.
- Regularly review your cancellation policy against competitors and market demand shifts in Sangolquí.
Sangolquí STR Booking Lead Time Analysis (2026)
Average Booking Lead Time by Month
Booking Lead Time Insights for Sangolquí
- The overall average booking lead time for vacation rentals in Sangolquí is 10 days.
- Guests book furthest in advance for stays during March (average 17 days), likely coinciding with peak travel demand or local events.
- The shortest booking windows occur for stays in November (average 5 days), indicating more last-minute travel plans during this time.
- Seasonally, Spring (14 days avg.) sees the longest lead times, while Fall (9 days avg.) has the shortest, reflecting typical travel planning cycles.
Recommendations for Hosts
- Use the overall average lead time (10 days) as a baseline for your pricing and availability strategy in Sangolquí.
- Target marketing efforts for the Spring season well in advance (at least 14 days) to capture early planners.
- Monitor your own booking lead times against these Sangolquí averages to identify opportunities for dynamic pricing adjustments.
Popular & Essential Airbnb Amenities in Sangolquí (2026)
Amenity Prevalence
Amenity Insights for Sangolquí
- Essential amenities in Sangolquí that guests expect include: TV. Lacking these (this) could significantly impact bookings.
- Popular amenities like Wifi, Kitchen, Hot water are common but not universal. Offering these can provide a competitive edge.
- Warning: Wifi is not universally provided but is considered essential globally. Ensure reliable Wifi is offered.
Recommendations for Hosts
- Ensure your listing includes all essential amenities for Sangolquí: TV.
- Prioritize adding missing essentials: TV.
- Consider adding popular differentiators like Wifi or Kitchen to increase appeal.
- Highlight unique or less common amenities you offer (e.g., hot tub, dedicated workspace, EV charger) in your listing description and photos.
- Regularly check competitor amenities in Sangolquí to stay competitive.
Sangolquí Airbnb Guest Demographics & Profile Analysis (2026)
Guest Profile Summary for Sangolquí
- The typical guest profile for Airbnb in Sangolquí consists of primarily domestic travelers (70%), often arriving from nearby Quito, typically belonging to the Post-2000s (Gen Z/Alpha) group (50%), primarily speaking Spanish or English.
- Domestic travelers account for 69.9% of guests.
- Key international markets include Ecuador (69.9%) and United States (17.2%).
- Top languages spoken are Spanish (55.7%) followed by English (38.1%).
- A significant demographic segment is the Post-2000s (Gen Z/Alpha) group, representing 50% of guests.
Recommendations for Hosts
- Target domestic marketing efforts towards travelers from Quito and Guayaquil.
- Tailor amenities and listing descriptions to appeal to the dominant Post-2000s (Gen Z/Alpha) demographic (e.g., highlight fast WiFi, smart home features, local guides).
- Highlight unique local experiences or amenities relevant to the primary guest profile.
- Consider seasonal promotions aligned with peak travel times for key origin markets.
Nearby Short-Term Rental Market Comparison
How does the Sangolquí Airbnb market stack up against its neighbors? Compare key performance metrics like average monthly revenue, ADR, and occupancy rates in surrounding areas to understand the broader regional STR landscape.