Machalilla Airbnb Market Analysis 2026: Short Term Rental Data & Vacation Rental Statistics in Manabí, Ecuador
Is Airbnb profitable in Machalilla in 2026? Explore comprehensive Airbnb analytics for Machalilla, Manabí, Ecuador to uncover income potential. This 2026 STR market report for Machalilla, based on AirROI data from February 2025 to January 2026, reveals key trends in the niche market of 21 active listings.
Whether you're considering an Airbnb investment in Machalilla, optimizing your existing vacation rental, or exploring rental arbitrage opportunities, understanding the Machalilla Airbnb data is crucial. Leveraging the low regulation environment is key to maximizing your short term rental income potential. Let's dive into the specifics.
Key Machalilla Airbnb Performance Metrics Overview
Monthly Airbnb Revenue Variations & Income Potential in Machalilla (2026)
Understanding the monthly revenue variations for Airbnb listings in Machalilla is key to maximizing your short term rental income potential. Seasonality significantly impacts earnings. Our analysis, based on data from the past 12 months, shows that the peak revenue month for STRs in Machalilla is typically April, while November often presents the lowest earnings, highlighting opportunities for strategic pricing adjustments during shoulder and low seasons. Explore the typical Airbnb income in Machalilla across different performance tiers:
- Best-in-class properties (Top 10%) achieve $800+ monthly, often utilizing dynamic pricing and superior guest experiences.
- Strong performing properties (Top 25%) earn $238 or more, indicating effective management and desirable locations/amenities.
- Typical properties (Median) generate around $93 per month, representing the average market performance.
- Entry-level properties (Bottom 25%) see earnings around $49, often with potential for optimization.
Average Monthly Airbnb Earnings Trend in Machalilla
Machalilla Airbnb Occupancy Rate Trends (2026)
Maximize your bookings by understanding the Machalilla STR occupancy trends. Seasonal demand shifts significantly influence how often properties are booked. Typically, Aprilsees the highest demand (peak season occupancy), while November experiences the lowest (low season). Effective strategies, like adjusting minimum stays or offering promotions, can boost occupancy during slower periods. Here's how different property tiers perform in Machalilla:
- Best-in-class properties (Top 10%) achieve 23%+ occupancy, indicating high desirability and potentially optimized availability.
- Strong performing properties (Top 25%) maintain 17% or higher occupancy, suggesting good market fit and guest satisfaction.
- Typical properties (Median) have an occupancy rate around 11%.
- Entry-level properties (Bottom 25%) average 8% occupancy, potentially facing higher vacancy.
Average Monthly Occupancy Rate Trend in Machalilla
Average Daily Rate (ADR) Airbnb Trends in Machalilla (2026)
Effective short term rental pricing strategy in Machalilla involves understanding monthly ADR fluctuations. The Average Daily Rate (ADR) for Airbnb in Machalilla typically peaks in October and dips lowest during February. Leveraging Airbnb dynamic pricing tools or strategies based on this seasonality can significantly boost revenue. Here's a look at the typical nightly rates achieved:
- Best-in-class properties (Top 10%) command rates of $182+ per night, often due to premium features or locations.
- Strong performing properties (Top 25%) achieve nightly rates of $42 or more.
- Typical properties (Median) charge around $21 per night.
- Entry-level properties (Bottom 25%) earn around $17 per night.
Average Daily Rate (ADR) Trend by Month in Machalilla
Get Live Machalilla Market Intelligence 👇

Explore Real-time Analytics
Airbnb Seasonality Analysis & Trends in Machalilla (2026)
Peak Season (April, February, December)
- Revenue averages $406 per month
- Occupancy rates average 18.7%
- Daily rates average $50
Shoulder Season
- Revenue averages $255 per month
- Occupancy maintains around 12.8%
- Daily rates hold near $52
Low Season (July, October, November)
- Revenue drops to average $129 per month
- Occupancy decreases to average 7.9%
- Daily rates adjust to average $54
Seasonality Insights for Machalilla
- The Airbnb seasonality in Machalilla shows highly seasonal trends requiring careful strategy. While the sections above show seasonal averages, it's also insightful to look at the extremes:
- During the high season, the absolute peak month showcases Machalilla's highest earning potential, with monthly revenues capable of climbing to $449, occupancy reaching a high of 20.0%, and ADRs peaking at $54.
- Conversely, the slowest single month of the year, typically falling within the low season, marks the market's lowest point. In this month, revenue might dip to $105, occupancy could drop to 6.3%, and ADRs may adjust down to $47.
- Understanding both the seasonal averages and these monthly peaks and troughs in revenue, occupancy, and ADR is crucial for maximizing your Airbnb profit potential in Machalilla.
Seasonal Strategies for Maximizing Profit
- Peak Season: Maximize revenue through premium pricing and potentially longer minimum stays. Ensure high availability.
- Low Season: Offer competitive pricing, special promotions (e.g., extended stay discounts), and flexible cancellation policies. Target off-season travelers like remote workers or budget-conscious guests.
- Shoulder Seasons: Implement dynamic pricing that balances peak and low rates. Target weekend travelers or specific events. Offer slightly more flexible terms than peak season.
- Regularly analyze your own performance against these Machalilla seasonality benchmarks and adjust your pricing and availability strategy accordingly.
Best Areas for Airbnb Investment in Machalilla (2026)
Exploring the top neighborhoods for short-term rentals in Machalilla? This section highlights key areas, outlining why they are attractive for hosts and guests, along with notable local attractions. Consider these locations based on your target guest profile and investment strategy.
| Neighborhood / Area | Why Host Here? (Target Guests & Appeal) | Key Attractions & Landmarks |
|---|---|---|
| Machalilla National Park | A protected area with stunning beaches, diverse wildlife, and rich biodiversity, making it a perfect spot for eco-tourism and nature lovers. | La Playita Beach, Los Frailes Beach, Whale watching, Hiking trails, Biodiversity tours |
| Puerto López | A charming fishing village known for its boat tours to Isla de la Plata and beautiful beachfront, appealing to tourists seeking relaxation and marine life experiences. | Isla de la Plata tours, Whale watching season, Local seafood restaurants, Beaches, Cultural festivals |
| Las Nuñez Beach | A serene beach destination that offers a laid-back atmosphere and beautiful scenery, ideal for visitors looking to escape the crowds. | Calm waters, Deserted beaches, Fishing, Local markets, Sunset views |
| Cerro de Hojas | A scenic hilltop area offering panoramic views of the ocean and surrounding landscape, suitable for adventure and nature enthusiasts. | Hiking opportunities, Birdwatching, Photography spots, Stargazing, Natural beauty |
| Pueblo de Puerto López | The charming village setting where visitors can immerse themselves in local culture, artisan crafts, and warm hospitality. | Local art and crafts, Cultural events, Traditional festivals, Community tours, Dining experiences |
| Los Frailes Beach | Considered one of the most beautiful beaches in Ecuador, it offers pristine environments and is perfect for sunbathing and swimming. | Soft sandy beaches, Clear waters, Wildlife observation, Scenic views, Relaxation spots |
| Jama Beach | A lesser-known but stunning beach area that offers tranquility and unspoiled nature, drawing those who prefer a more secluded experience. | Secluded beaches, Natural surroundings, Wildlife viewing, Relaxing atmosphere, Surf spots |
| San Vicente | A quaint area with historical significance and access to beautiful coastal views, appealing for cultural tourism and beach lovers. | Cultural history, Art galleries, Beachfront walks, Local dining, Community events |
Understanding Airbnb License Requirements & STR Laws in Machalilla (2026)
While Machalilla, Manabí, Ecuador currently shows low STR regulations, specific Airbnb license requirements might still exist or change. Always verify the latest short term rental regulations and Airbnb license requirements directly with local government authorities for Machalilla to ensure full compliance before hosting.
(Source: AirROI data, 2026, finding no licensed listings among those analyzed)
Top Performing Airbnb Properties in Machalilla (2026)
Benchmark your potential! Explore examples of top-performing Airbnb properties in Machalillabased on Trailing Twelve Month (TTM) revenue. Analyze their characteristics, revenue, occupancy rate, and ADR to understand what drives success in this market.
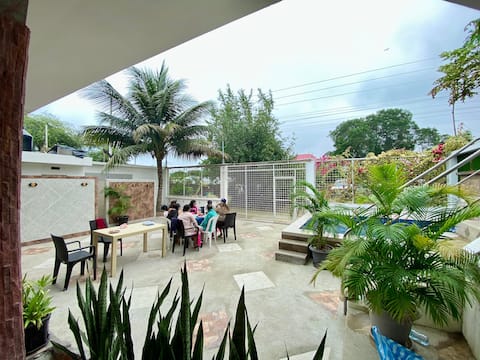
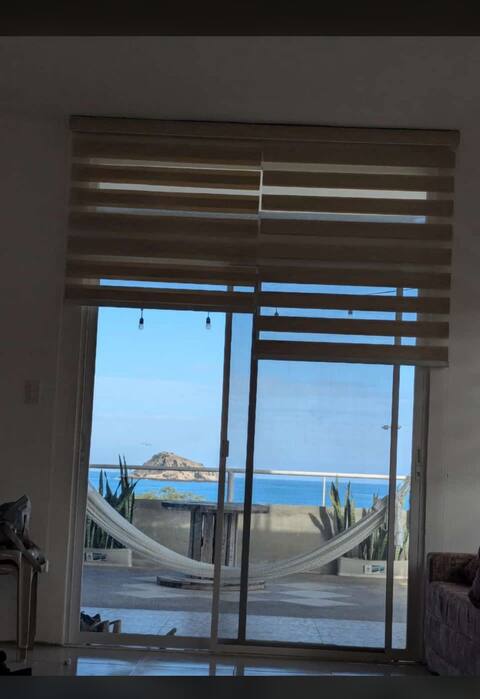
Beach House with Pool | Steps from Los Frailes
Entire Place • 3 bedrooms

Private beach retreat.
Entire Place • 3 bedrooms
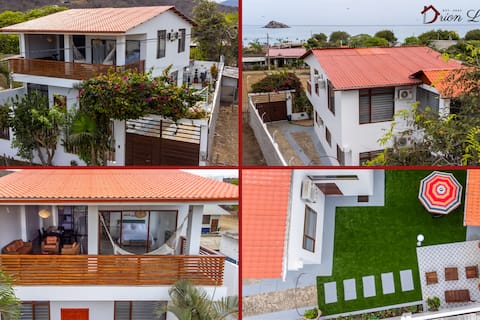
Beautiful Machalilla Beach House
Entire Place • 6 bedrooms
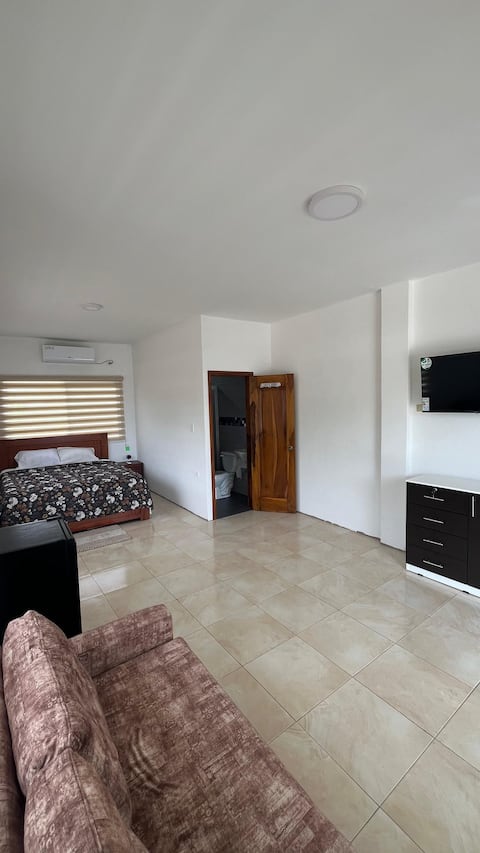
Family Room next to the Friars
Private Room • 1 bedroom
Double Room next to Los Frailes
Private Room • 1 bedroom
Oceanfront hotel/accommodation
Entire Place • 10 bedrooms
Note: Performance varies based on location, size, amenities, seasonality, and management quality. Data reflects the past 12 months.
Top Performing Airbnb Hosts in Machalilla (2026)
Learn from the best! This table showcases top-performing Airbnb hosts in Machalilla based on the number of properties managed and estimated total revenue over the past year. Analyze their scale and performance metrics.
| Host Name | Properties | Grossing Revenue | Stay Reviews | Avg Rating |
|---|---|---|---|---|
| Brigith Antonella | 4 | $15,503 | 47 | 4.80/5.0 |
| Maria | 1 | $8,911 | 45 | 4.87/5.0 |
| Danny | 13 | $7,664 | 479 | 4.80/5.0 |
| Glenda | 1 | $6,654 | 25 | 4.80/5.0 |
| Juan Carlos | 2 | $384 | 194 | 4.78/5.0 |
Analyzing the strategies of top hosts, such as their property selection, pricing, and guest communication, can offer valuable lessons for optimizing your own Airbnb operations in Machalilla.
Dive Deeper: Advanced Machalilla STR Market Data (2026)
Ready to unlock more insights? AirROI provides access to advanced metrics and comprehensive Airbnb data for Machalilla. Explore detailed analytics beyond this report to refine your investment strategy, optimize pricing, and maximize your vacation rental profits.
Explore Advanced MetricsMachalilla Short-Term Rental Market Composition (2026): Property & Room Types
Room Type Distribution
Property Type Distribution
Market Composition Insights for Machalilla
- The Machalilla Airbnb market composition is heavily skewed towards Entire Home/Apt listings, which make up 66.7% of the 21 active rentals. This indicates strong guest preference for privacy and space.
- However, a notable 33.3% share for Private Rooms suggests opportunities for budget-conscious travelers or hosts renting out spare rooms.
- Looking at the property type distribution in Machalilla, House properties are the most common (85.7%), reflecting the local real estate landscape.
- Houses represent a significant 85.7% portion, catering likely to families or larger groups.
- Smaller segments like others (combined 4.8%) offer potential for unique stay experiences.
Machalilla Airbnb Room Capacity Analysis (2026): Bedroom Distribution
Distribution of Listings by Number of Bedrooms
Room Capacity Insights for Machalilla
- The dominant room capacity in Machalilla is 5+ bedrooms listings, making up 47.6% of the market. This suggests a strong demand for properties suitable for families or small groups.
- Together, 5+ bedrooms and 1 bedroom properties represent 61.9% of the active Airbnb listings in Machalilla, indicating a high concentration in these sizes.
- A significant 57.1% of listings offer 3+ bedrooms, catering to larger groups and families seeking more space in Machalilla.
Machalilla Vacation Rental Guest Capacity Trends (2026)
Distribution of Listings by Guest Capacity
Guest Capacity Insights for Machalilla
- The most common guest capacity trend in Machalilla vacation rentals is listings accommodating 8+ guests (57.1%). This suggests the primary traveler segment is likely larger groups.
- Properties designed for 8+ guests and 4 guests dominate the Machalilla STR market, accounting for 66.6% of listings.
- 61.9% of properties accommodate 6+ guests, serving the market segment for larger families or group travel in Machalilla.
- On average, properties in Machalilla are equipped to host 5.3 guests.
Machalilla Airbnb Booking Patterns (2026): Available vs. Booked Days
Available Days Distribution
Booked Days Distribution
Booking Pattern Insights for Machalilla
- The most common availability pattern in Machalilla falls within the 271-366 days range, representing 100% of listings. This suggests many properties have significant open periods on their calendars.
- Approximately 100.0% of listings show high availability (181+ days open annually), indicating potential for increased bookings or specific owner usage patterns.
- For booked days, the 31-90 days range is most frequent in Machalilla (52.4%), reflecting common guest stay durations or potential owner blocking patterns.
Machalilla Airbnb Minimum Stay Requirements Analysis
Distribution of Listings by Minimum Night Requirement
1 Night
12 listings
57.1% of total
2 Nights
1 listings
4.8% of total
30+ Nights
8 listings
38.1% of total
Key Insights
- The most prevalent minimum stay requirement in Machalilla is 1 Night, adopted by 57.1% of listings. This highlights the market's preference for shorter, flexible bookings.
- A strong majority (61.9%) of the Machalilla Airbnb data shows acceptance of very short stays (1-2 nights), indicating a dynamic, high-turnover market.
- A significant segment (38.1%) caters to monthly stays (30+ nights) in Machalilla, pointing to opportunities in the extended-stay market.
Recommendations
- Align with the market by considering a 1 Night minimum stay, as 57.1% of Machalilla hosts use this setting.
- Explore offering discounts for stays of 30+ nights to attract the 38.1% of the market seeking extended stays.
- Adjust minimum nights based on seasonality – potentially shorter during low season and longer during peak demand periods in Machalilla.
Machalilla Airbnb Cancellation Policy Trends Analysis (2026)
Flexible
8 listings
38.1% of total
Moderate
1 listings
4.8% of total
Firm
3 listings
14.3% of total
Strict
9 listings
42.9% of total
Cancellation Policy Insights for Machalilla
- The prevailing Airbnb cancellation policy trend in Machalilla is Strict, used by 42.9% of listings.
- A majority (57.2%) of hosts in Machalilla utilize Firm or Strict policies, indicating a market where hosts prioritize booking security.
Recommendations for Hosts
- Consider adopting a Strict policy to align with the 42.9% market standard in Machalilla.
- With 42.9% using Strict terms, this is a viable option in Machalilla, particularly for high-value properties or during peak demand periods.
- Regularly review your cancellation policy against competitors and market demand shifts in Machalilla.
Machalilla STR Booking Lead Time Analysis (2026)
Average Booking Lead Time by Month
Booking Lead Time Insights for Machalilla
- The overall average booking lead time for vacation rentals in Machalilla is 29 days.
- Guests book furthest in advance for stays during July (average 51 days), likely coinciding with peak travel demand or local events.
- The shortest booking windows occur for stays in June (average 12 days), indicating more last-minute travel plans during this time.
- Seasonally, Summer (30 days avg.) sees the longest lead times, while Spring (18 days avg.) has the shortest, reflecting typical travel planning cycles.
Recommendations for Hosts
- Use the overall average lead time (29 days) as a baseline for your pricing and availability strategy in Machalilla.
- For July stays, consider implementing length-of-stay discounts or slightly higher rates for bookings made less than 51 days out to capitalize on advance planning.
- During June, focus on last-minute booking availability and promotions, as guests book with very short notice (12 days avg.).
- Target marketing efforts for the Summer season well in advance (at least 30 days) to capture early planners.
- Monitor your own booking lead times against these Machalilla averages to identify opportunities for dynamic pricing adjustments.
Popular & Essential Airbnb Amenities in Machalilla (2026)
Amenity Prevalence
Amenity Insights for Machalilla
- Essential amenities in Machalilla that guests expect include: Wifi, Free parking on premises, Beach access, Hot water, Essentials. Lacking these (any) could significantly impact bookings.
- Popular amenities like Patio or balcony, Extra pillows and blankets, Fire extinguisher are common but not universal. Offering these can provide a competitive edge.
Recommendations for Hosts
- Ensure your listing includes all essential amenities for Machalilla: Wifi, Free parking on premises, Beach access, Hot water, Essentials.
- Prioritize adding missing essentials: Beach access, Hot water, Essentials.
- Consider adding popular differentiators like Patio or balcony or Extra pillows and blankets to increase appeal.
- Highlight unique or less common amenities you offer (e.g., hot tub, dedicated workspace, EV charger) in your listing description and photos.
- Regularly check competitor amenities in Machalilla to stay competitive.
Machalilla Airbnb Guest Demographics & Profile Analysis (2026)
Guest Profile Summary for Machalilla
- The typical guest profile for Airbnb in Machalilla consists of a mix of domestic (57%) and international guests, often arriving from nearby Quito, typically belonging to the Post-2000s (Gen Z/Alpha) group (50%), primarily speaking Spanish or English.
- Domestic travelers account for 57.1% of guests.
- Key international markets include Ecuador (57.1%) and United States (10.7%).
- Top languages spoken are Spanish (52.4%) followed by English (28.6%).
- A significant demographic segment is the Post-2000s (Gen Z/Alpha) group, representing 50% of guests.
Recommendations for Hosts
- Balance marketing efforts between domestic and international channels based on the guest mix.
- Tailor amenities and listing descriptions to appeal to the dominant Post-2000s (Gen Z/Alpha) demographic (e.g., highlight fast WiFi, smart home features, local guides).
- Highlight unique local experiences or amenities relevant to the primary guest profile.
- Consider seasonal promotions aligned with peak travel times for key origin markets.
Nearby Short-Term Rental Market Comparison
How does the Machalilla Airbnb market stack up against its neighbors? Compare key performance metrics like average monthly revenue, ADR, and occupancy rates in surrounding areas to understand the broader regional STR landscape.
| Market | Active Properties | Monthly Revenue | Daily Rate | Avg. Occupancy |
|---|---|---|---|---|
| Curia | 30 | $1,454 | $243.84 | 22% |
| Jama | 50 | $1,145 | $187.29 | 24% |
| Parroquia Manglaralto | 26 | $1,076 | $204.86 | 20% |
| La Entrada | 38 | $968 | $203.21 | 26% |
| Sayausi | 14 | $951 | $175.56 | 19% |
| Ayangue | 58 | $861 | $150.30 | 18% |
| Olón | 178 | $623 | $144.07 | 22% |
| Punta Blanca | 16 | $600 | $200.44 | 15% |
| Jambelí | 13 | $585 | $98.18 | 16% |
| Santa Elena | 406 | $535 | $155.89 | 17% |