Charapotó Airbnb Market Analysis 2026: Short Term Rental Data & Vacation Rental Statistics in Manabí, Ecuador
Is Airbnb profitable in Charapotó in 2026? Explore comprehensive Airbnb analytics for Charapotó, Manabí, Ecuador to uncover income potential. This 2026 STR market report for Charapotó, based on AirROI data from February 2025 to January 2026, reveals key trends in the niche market of 67 active listings.
Whether you're considering an Airbnb investment in Charapotó, optimizing your existing vacation rental, or exploring rental arbitrage opportunities, understanding the Charapotó Airbnb data is crucial. Leveraging the low regulation environment is key to maximizing your short term rental income potential. Let's dive into the specifics.
Key Charapotó Airbnb Performance Metrics Overview
Monthly Airbnb Revenue Variations & Income Potential in Charapotó (2026)
Understanding the monthly revenue variations for Airbnb listings in Charapotó is key to maximizing your short term rental income potential. Seasonality significantly impacts earnings. Our analysis, based on data from the past 12 months, shows that the peak revenue month for STRs in Charapotó is typically August, while June often presents the lowest earnings, highlighting opportunities for strategic pricing adjustments during shoulder and low seasons. Explore the typical Airbnb income in Charapotó across different performance tiers:
- Best-in-class properties (Top 10%) achieve $2,436+ monthly, often utilizing dynamic pricing and superior guest experiences.
- Strong performing properties (Top 25%) earn $1,190 or more, indicating effective management and desirable locations/amenities.
- Typical properties (Median) generate around $495 per month, representing the average market performance.
- Entry-level properties (Bottom 25%) see earnings around $234, often with potential for optimization.
Average Monthly Airbnb Earnings Trend in Charapotó
Charapotó Airbnb Occupancy Rate Trends (2026)
Maximize your bookings by understanding the Charapotó STR occupancy trends. Seasonal demand shifts significantly influence how often properties are booked. Typically, Augustsees the highest demand (peak season occupancy), while October experiences the lowest (low season). Effective strategies, like adjusting minimum stays or offering promotions, can boost occupancy during slower periods. Here's how different property tiers perform in Charapotó:
- Best-in-class properties (Top 10%) achieve 32%+ occupancy, indicating high desirability and potentially optimized availability.
- Strong performing properties (Top 25%) maintain 21% or higher occupancy, suggesting good market fit and guest satisfaction.
- Typical properties (Median) have an occupancy rate around 12%.
- Entry-level properties (Bottom 25%) average 6% occupancy, potentially facing higher vacancy.
Average Monthly Occupancy Rate Trend in Charapotó
Average Daily Rate (ADR) Airbnb Trends in Charapotó (2026)
Effective short term rental pricing strategy in Charapotó involves understanding monthly ADR fluctuations. The Average Daily Rate (ADR) for Airbnb in Charapotó typically peaks in June and dips lowest during January. Leveraging Airbnb dynamic pricing tools or strategies based on this seasonality can significantly boost revenue. Here's a look at the typical nightly rates achieved:
- Best-in-class properties (Top 10%) command rates of $266+ per night, often due to premium features or locations.
- Strong performing properties (Top 25%) achieve nightly rates of $168 or more.
- Typical properties (Median) charge around $125 per night.
- Entry-level properties (Bottom 25%) earn around $77 per night.
Average Daily Rate (ADR) Trend by Month in Charapotó
Get Live Charapotó Market Intelligence 👇

Explore Real-time Analytics
Airbnb Seasonality Analysis & Trends in Charapotó (2026)
Peak Season (August, April, May)
- Revenue averages $1,203 per month
- Occupancy rates average 19.5%
- Daily rates average $145
Shoulder Season
- Revenue averages $968 per month
- Occupancy maintains around 14.7%
- Daily rates hold near $140
Low Season (January, June, September)
- Revenue drops to average $719 per month
- Occupancy decreases to average 12.5%
- Daily rates adjust to average $139
Seasonality Insights for Charapotó
- The Airbnb seasonality in Charapotó shows moderate seasonality with distinct peak and low periods. While the sections above show seasonal averages, it's also insightful to look at the extremes:
- During the high season, the absolute peak month showcases Charapotó's highest earning potential, with monthly revenues capable of climbing to $1,338, occupancy reaching a high of 21.4%, and ADRs peaking at $146.
- Conversely, the slowest single month of the year, typically falling within the low season, marks the market's lowest point. In this month, revenue might dip to $678, occupancy could drop to 11.2%, and ADRs may adjust down to $135.
- Understanding both the seasonal averages and these monthly peaks and troughs in revenue, occupancy, and ADR is crucial for maximizing your Airbnb profit potential in Charapotó.
Seasonal Strategies for Maximizing Profit
- Peak Season: Maximize revenue through premium pricing and potentially longer minimum stays. Ensure high availability.
- Low Season: Offer competitive pricing, special promotions (e.g., extended stay discounts), and flexible cancellation policies. Target off-season travelers like remote workers or budget-conscious guests.
- Shoulder Seasons: Implement dynamic pricing that balances peak and low rates. Target weekend travelers or specific events. Offer slightly more flexible terms than peak season.
- Regularly analyze your own performance against these Charapotó seasonality benchmarks and adjust your pricing and availability strategy accordingly.
Best Areas for Airbnb Investment in Charapotó (2026)
Exploring the top neighborhoods for short-term rentals in Charapotó? This section highlights key areas, outlining why they are attractive for hosts and guests, along with notable local attractions. Consider these locations based on your target guest profile and investment strategy.
| Neighborhood / Area | Why Host Here? (Target Guests & Appeal) | Key Attractions & Landmarks |
|---|---|---|
| Centro Charapotó | The heart of Charapotó, where you can experience local culture and culinary delights. Close to markets and community events, making it attractive for those wanting an authentic experience. | Local markets, Plaza de Charapotó, Cultural festivals, Traditional restaurants |
| Playa de Charapotó | A beautiful beach area that attracts both locals and tourists for relaxation and water sports. Ideal for beach lovers seeking sun and fun. | Beaches, Surfing spots, Beachfront restaurants, Scenic viewpoints |
| Parque Central | The main park in Charapotó, serving as a recreational area for families and visitors. A great place for walks and enjoying local life. | Playground, Walking paths, Local events, Food vendors |
| Pueblo de Charapotó | The picturesque village atmosphere provides a tranquil setting for visitors who enjoy rural life and nature. Popular for eco-tourism and cultural experiences. | Traditional crafts, Outdoor activities, Guided nature tours |
| Barrio San Vicente | A vibrant neighborhood known for its friendly locals and community spirit. Ideal for guests looking for a home-like feel. | Local shops, Community events, Artisan markets |
| Vista al Mar | An area with stunning ocean views that attracts visitors looking for picturesque accommodations. Great for romantic getaways. | Scenic overlooks, Sunset views, Oceanfront dining |
| Cerca de la Playa | Just a short distance from the beach, this area offers affordability while still being close to the main attractions. | Affordable lodging, Beach access, Local eateries |
| Mirador Charapotó | A lookout point providing panoramic views of the surrounding landscape, popular for photos and relaxation. | Hiking trails, Photography spots, Nature walks |
Understanding Airbnb License Requirements & STR Laws in Charapotó (2026)
While Charapotó, Manabí, Ecuador currently shows low STR regulations, specific Airbnb license requirements might still exist or change. Always verify the latest short term rental regulations and Airbnb license requirements directly with local government authorities for Charapotó to ensure full compliance before hosting.
(Source: AirROI data, 2026, finding no licensed listings among those analyzed)
Top Performing Airbnb Properties in Charapotó (2026)
Benchmark your potential! Explore examples of top-performing Airbnb properties in Charapotóbased on Trailing Twelve Month (TTM) revenue. Analyze their characteristics, revenue, occupancy rate, and ADR to understand what drives success in this market.

Home Luxury La Punta (18 People Max)
Entire Place • 5 bedrooms
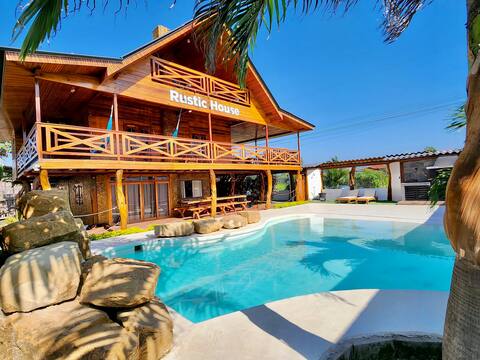
Rustic House (18 Personas Max)
Entire Place • 6 bedrooms
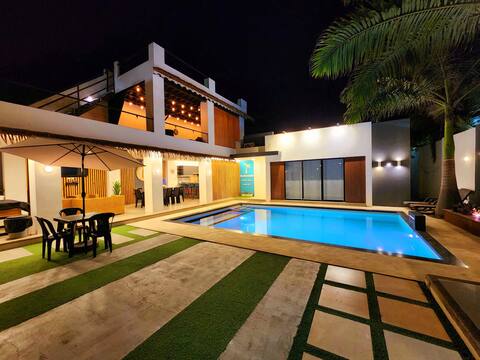
Vacation Home - Home Two (21 People)
Entire Place • 5 bedrooms
Vacation home - Home One (18 People Max)
Entire Place • 4 bedrooms
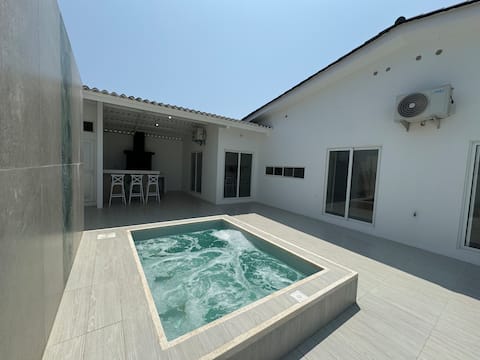
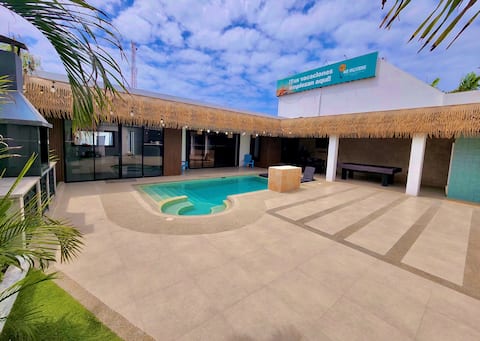
San Clemente: Private Condominium
Entire Place • 4 bedrooms
Excellent oceanfront house for 22 people
Entire Place • 4 bedrooms
Note: Performance varies based on location, size, amenities, seasonality, and management quality. Data reflects the past 12 months.
Top Performing Airbnb Hosts in Charapotó (2026)
Learn from the best! This table showcases top-performing Airbnb hosts in Charapotó based on the number of properties managed and estimated total revenue over the past year. Analyze their scale and performance metrics.
| Host Name | Properties | Grossing Revenue | Stay Reviews | Avg Rating |
|---|---|---|---|---|
| Ms Vacations | 5 | $130,353 | 185 | 4.68/5.0 |
| Passport Realty | 6 | $34,868 | 14 | 4.75/5.0 |
| Mauricio Javier Vivas Rodrigue | 2 | $16,681 | 27 | 4.39/5.0 |
| Ridder | 1 | $16,076 | 5 | 5.00/5.0 |
| Amber | 1 | $15,161 | 5 | 5.00/5.0 |
| Wendy | 1 | $12,984 | 68 | 4.91/5.0 |
| Sandra Elizabeth | 1 | $11,896 | 2 | Not Rated |
| Lenin | 1 | $11,626 | 10 | 5.00/5.0 |
| Oyuki | 2 | $10,179 | 17 | 5.00/5.0 |
| Mariuxi Moreira | 1 | $7,905 | 10 | 4.80/5.0 |
Analyzing the strategies of top hosts, such as their property selection, pricing, and guest communication, can offer valuable lessons for optimizing your own Airbnb operations in Charapotó.
Dive Deeper: Advanced Charapotó STR Market Data (2026)
Ready to unlock more insights? AirROI provides access to advanced metrics and comprehensive Airbnb data for Charapotó. Explore detailed analytics beyond this report to refine your investment strategy, optimize pricing, and maximize your vacation rental profits.
Explore Advanced MetricsCharapotó Short-Term Rental Market Composition (2026): Property & Room Types
Room Type Distribution
Property Type Distribution
Market Composition Insights for Charapotó
- The Charapotó Airbnb market composition is heavily skewed towards Entire Home/Apt listings, which make up 92.5% of the 67 active rentals. This indicates strong guest preference for privacy and space.
- Looking at the property type distribution in Charapotó, House properties are the most common (65.7%), reflecting the local real estate landscape.
- Houses represent a significant 65.7% portion, catering likely to families or larger groups.
- The presence of 6% Hotel/Boutique listings indicates integration with traditional hospitality.
- Smaller segments like outdoor/unique, others (combined 4.5%) offer potential for unique stay experiences.
Charapotó Airbnb Room Capacity Analysis (2026): Bedroom Distribution
Distribution of Listings by Number of Bedrooms
Room Capacity Insights for Charapotó
- The dominant room capacity in Charapotó is 3 bedrooms listings, making up 31.3% of the market. This suggests a strong demand for properties suitable for families or small groups.
- Together, 3 bedrooms and 2 bedrooms properties represent 53.7% of the active Airbnb listings in Charapotó, indicating a high concentration in these sizes.
- A significant 64.1% of listings offer 3+ bedrooms, catering to larger groups and families seeking more space in Charapotó.
Charapotó Vacation Rental Guest Capacity Trends (2026)
Distribution of Listings by Guest Capacity
Guest Capacity Insights for Charapotó
- The most common guest capacity trend in Charapotó vacation rentals is listings accommodating 8+ guests (65.7%). This suggests the primary traveler segment is likely larger groups.
- Properties designed for 8+ guests and 6 guests dominate the Charapotó STR market, accounting for 77.6% of listings.
- 79.1% of properties accommodate 6+ guests, serving the market segment for larger families or group travel in Charapotó.
- On average, properties in Charapotó are equipped to host 6.8 guests.
Charapotó Airbnb Booking Patterns (2026): Available vs. Booked Days
Available Days Distribution
Booked Days Distribution
Booking Pattern Insights for Charapotó
- The most common availability pattern in Charapotó falls within the 271-366 days range, representing 97% of listings. This suggests many properties have significant open periods on their calendars.
- Approximately 100.0% of listings show high availability (181+ days open annually), indicating potential for increased bookings or specific owner usage patterns.
- For booked days, the 1-30 days range is most frequent in Charapotó (64.2%), reflecting common guest stay durations or potential owner blocking patterns.
Charapotó Airbnb Minimum Stay Requirements Analysis
Distribution of Listings by Minimum Night Requirement
1 Night
34 listings
50.7% of total
2 Nights
21 listings
31.3% of total
3 Nights
3 listings
4.5% of total
7-29 Nights
1 listings
1.5% of total
30+ Nights
8 listings
11.9% of total
Key Insights
- The most prevalent minimum stay requirement in Charapotó is 1 Night, adopted by 50.7% of listings. This highlights the market's preference for shorter, flexible bookings.
- A strong majority (82.0%) of the Charapotó Airbnb data shows acceptance of very short stays (1-2 nights), indicating a dynamic, high-turnover market.
- A significant segment (11.9%) caters to monthly stays (30+ nights) in Charapotó, pointing to opportunities in the extended-stay market.
Recommendations
- Align with the market by considering a 1 Night minimum stay, as 50.7% of Charapotó hosts use this setting.
- Explore offering discounts for stays of 30+ nights to attract the 11.9% of the market seeking extended stays.
- Adjust minimum nights based on seasonality – potentially shorter during low season and longer during peak demand periods in Charapotó.
Charapotó Airbnb Cancellation Policy Trends Analysis (2026)
Limited
1 listings
1.5% of total
Flexible
30 listings
44.8% of total
Moderate
18 listings
26.9% of total
Firm
12 listings
17.9% of total
Strict
6 listings
9% of total
Cancellation Policy Insights for Charapotó
- The prevailing Airbnb cancellation policy trend in Charapotó is Flexible, used by 44.8% of listings.
- The market strongly favors guest-friendly terms, with 71.7% of listings offering Flexible or Moderate policies. This suggests guests in Charapotó may expect booking flexibility.
- Strict cancellation policies are quite rare (9%), potentially making listings with this policy less competitive unless justified by high demand or property type.
Recommendations for Hosts
- Consider adopting a Flexible policy to align with the 44.8% market standard in Charapotó.
- Using a Strict policy might deter some guests, as only 9% of listings use it. Evaluate if potential revenue protection outweighs possible lower booking rates.
- Regularly review your cancellation policy against competitors and market demand shifts in Charapotó.
Charapotó STR Booking Lead Time Analysis (2026)
Average Booking Lead Time by Month
Booking Lead Time Insights for Charapotó
- The overall average booking lead time for vacation rentals in Charapotó is 21 days.
- Guests book furthest in advance for stays during December (average 40 days), likely coinciding with peak travel demand or local events.
- The shortest booking windows occur for stays in May (average 9 days), indicating more last-minute travel plans during this time.
- Seasonally, Winter (30 days avg.) sees the longest lead times, while Spring (18 days avg.) has the shortest, reflecting typical travel planning cycles.
Recommendations for Hosts
- Use the overall average lead time (21 days) as a baseline for your pricing and availability strategy in Charapotó.
- For December stays, consider implementing length-of-stay discounts or slightly higher rates for bookings made less than 40 days out to capitalize on advance planning.
- During May, focus on last-minute booking availability and promotions, as guests book with very short notice (9 days avg.).
- Target marketing efforts for the Winter season well in advance (at least 30 days) to capture early planners.
- Monitor your own booking lead times against these Charapotó averages to identify opportunities for dynamic pricing adjustments.
Popular & Essential Airbnb Amenities in Charapotó (2026)
Amenity Prevalence
Amenity Insights for Charapotó
- Essential amenities in Charapotó that guests expect include: Free parking on premises. Lacking these (this) could significantly impact bookings.
- Popular amenities like Wifi, Air conditioning, TV are common but not universal. Offering these can provide a competitive edge.
- Warning: Wifi is not universally provided but is considered essential globally. Ensure reliable Wifi is offered.
Recommendations for Hosts
- Ensure your listing includes all essential amenities for Charapotó: Free parking on premises.
- Consider adding popular differentiators like Wifi or Air conditioning to increase appeal.
- Highlight unique or less common amenities you offer (e.g., hot tub, dedicated workspace, EV charger) in your listing description and photos.
- Regularly check competitor amenities in Charapotó to stay competitive.
Charapotó Airbnb Guest Demographics & Profile Analysis (2026)
Guest Profile Summary for Charapotó
- The typical guest profile for Airbnb in Charapotó consists of primarily domestic travelers (76%), often arriving from nearby Quito, typically belonging to the Post-2000s (Gen Z/Alpha) group (50%), primarily speaking Spanish or English.
- Domestic travelers account for 76.0% of guests.
- Key international markets include Ecuador (76%) and United States (16%).
- Top languages spoken are Spanish (73.8%) followed by English (21.4%).
- A significant demographic segment is the Post-2000s (Gen Z/Alpha) group, representing 50% of guests.
Recommendations for Hosts
- Target domestic marketing efforts towards travelers from Quito and Portoviejo.
- Tailor amenities and listing descriptions to appeal to the dominant Post-2000s (Gen Z/Alpha) demographic (e.g., highlight fast WiFi, smart home features, local guides).
- Highlight unique local experiences or amenities relevant to the primary guest profile.
- Consider seasonal promotions aligned with peak travel times for key origin markets.
Nearby Short-Term Rental Market Comparison
How does the Charapotó Airbnb market stack up against its neighbors? Compare key performance metrics like average monthly revenue, ADR, and occupancy rates in surrounding areas to understand the broader regional STR landscape.
| Market | Active Properties | Monthly Revenue | Daily Rate | Avg. Occupancy |
|---|---|---|---|---|
| Curia | 30 | $1,454 | $243.84 | 22% |
| Jama | 50 | $1,145 | $187.29 | 24% |
| Parroquia Manglaralto | 26 | $1,076 | $204.86 | 20% |
| La Entrada | 38 | $968 | $203.21 | 26% |
| Cojimíes | 75 | $869 | $206.34 | 19% |
| Ayangue | 58 | $861 | $150.30 | 18% |
| Tonchigüe | 239 | $695 | $159.24 | 20% |
| Olón | 178 | $623 | $144.07 | 22% |
| Pedernales | 52 | $529 | $128.89 | 17% |
| Cadeate | 15 | $507 | $142.12 | 24% |