Bahía de Caráquez Airbnb Market Analysis 2026: Short Term Rental Data & Vacation Rental Statistics in Manabí, Ecuador
Is Airbnb profitable in Bahía de Caráquez in 2026? Explore comprehensive Airbnb analytics for Bahía de Caráquez, Manabí, Ecuador to uncover income potential. This 2026 STR market report for Bahía de Caráquez, based on AirROI data from February 2025 to January 2026, reveals key trends in the niche market of 35 active listings.
Whether you're considering an Airbnb investment in Bahía de Caráquez, optimizing your existing vacation rental, or exploring rental arbitrage opportunities, understanding the Bahía de Caráquez Airbnb data is crucial. Leveraging the low regulation environment is key to maximizing your short term rental income potential. Let's dive into the specifics.
Key Bahía de Caráquez Airbnb Performance Metrics Overview
Monthly Airbnb Revenue Variations & Income Potential in Bahía de Caráquez (2026)
Understanding the monthly revenue variations for Airbnb listings in Bahía de Caráquez is key to maximizing your short term rental income potential. Seasonality significantly impacts earnings. Our analysis, based on data from the past 12 months, shows that the peak revenue month for STRs in Bahía de Caráquez is typically August, while June often presents the lowest earnings, highlighting opportunities for strategic pricing adjustments during shoulder and low seasons. Explore the typical Airbnb income in Bahía de Caráquez across different performance tiers:
- Best-in-class properties (Top 10%) achieve $1,197+ monthly, often utilizing dynamic pricing and superior guest experiences.
- Strong performing properties (Top 25%) earn $766 or more, indicating effective management and desirable locations/amenities.
- Typical properties (Median) generate around $391 per month, representing the average market performance.
- Entry-level properties (Bottom 25%) see earnings around $220, often with potential for optimization.
Average Monthly Airbnb Earnings Trend in Bahía de Caráquez
Bahía de Caráquez Airbnb Occupancy Rate Trends (2026)
Maximize your bookings by understanding the Bahía de Caráquez STR occupancy trends. Seasonal demand shifts significantly influence how often properties are booked. Typically, Augustsees the highest demand (peak season occupancy), while June experiences the lowest (low season). Effective strategies, like adjusting minimum stays or offering promotions, can boost occupancy during slower periods. Here's how different property tiers perform in Bahía de Caráquez:
- Best-in-class properties (Top 10%) achieve 36%+ occupancy, indicating high desirability and potentially optimized availability.
- Strong performing properties (Top 25%) maintain 25% or higher occupancy, suggesting good market fit and guest satisfaction.
- Typical properties (Median) have an occupancy rate around 13%.
- Entry-level properties (Bottom 25%) average 8% occupancy, potentially facing higher vacancy.
Average Monthly Occupancy Rate Trend in Bahía de Caráquez
Average Daily Rate (ADR) Airbnb Trends in Bahía de Caráquez (2026)
Effective short term rental pricing strategy in Bahía de Caráquez involves understanding monthly ADR fluctuations. The Average Daily Rate (ADR) for Airbnb in Bahía de Caráquez typically peaks in December and dips lowest during March. Leveraging Airbnb dynamic pricing tools or strategies based on this seasonality can significantly boost revenue. Here's a look at the typical nightly rates achieved:
- Best-in-class properties (Top 10%) command rates of $190+ per night, often due to premium features or locations.
- Strong performing properties (Top 25%) achieve nightly rates of $139 or more.
- Typical properties (Median) charge around $84 per night.
- Entry-level properties (Bottom 25%) earn around $50 per night.
Average Daily Rate (ADR) Trend by Month in Bahía de Caráquez
Get Live Bahía de Caráquez Market Intelligence 👇

Explore Real-time Analytics
Airbnb Seasonality Analysis & Trends in Bahía de Caráquez (2026)
Peak Season (August, July, December)
- Revenue averages $901 per month
- Occupancy rates average 26.6%
- Daily rates average $112
Shoulder Season
- Revenue averages $493 per month
- Occupancy maintains around 16.1%
- Daily rates hold near $111
Low Season (June, September, October)
- Revenue drops to average $308 per month
- Occupancy decreases to average 11.8%
- Daily rates adjust to average $113
Seasonality Insights for Bahía de Caráquez
- The Airbnb seasonality in Bahía de Caráquez shows highly seasonal trends requiring careful strategy. While the sections above show seasonal averages, it's also insightful to look at the extremes:
- During the high season, the absolute peak month showcases Bahía de Caráquez's highest earning potential, with monthly revenues capable of climbing to $1,016, occupancy reaching a high of 32.1%, and ADRs peaking at $116.
- Conversely, the slowest single month of the year, typically falling within the low season, marks the market's lowest point. In this month, revenue might dip to $209, occupancy could drop to 10.2%, and ADRs may adjust down to $109.
- Understanding both the seasonal averages and these monthly peaks and troughs in revenue, occupancy, and ADR is crucial for maximizing your Airbnb profit potential in Bahía de Caráquez.
Seasonal Strategies for Maximizing Profit
- Peak Season: Maximize revenue through premium pricing and potentially longer minimum stays. Ensure high availability.
- Low Season: Offer competitive pricing, special promotions (e.g., extended stay discounts), and flexible cancellation policies. Target off-season travelers like remote workers or budget-conscious guests.
- Shoulder Seasons: Implement dynamic pricing that balances peak and low rates. Target weekend travelers or specific events. Offer slightly more flexible terms than peak season.
- Regularly analyze your own performance against these Bahía de Caráquez seasonality benchmarks and adjust your pricing and availability strategy accordingly.
Best Areas for Airbnb Investment in Bahía de Caráquez (2026)
Exploring the top neighborhoods for short-term rentals in Bahía de Caráquez? This section highlights key areas, outlining why they are attractive for hosts and guests, along with notable local attractions. Consider these locations based on your target guest profile and investment strategy.
| Neighborhood / Area | Why Host Here? (Target Guests & Appeal) | Key Attractions & Landmarks |
|---|---|---|
| Centro Histórico | The historic center of Bahía de Caráquez, known for its colonial architecture and cultural significance. Attracts tourists interested in history and local culture, with easy access to restaurants and shops. | Bahía de Caráquez Cathedral, Malecón (boardwalk), Museo Bahia de Caráquez, local markets, art galleries |
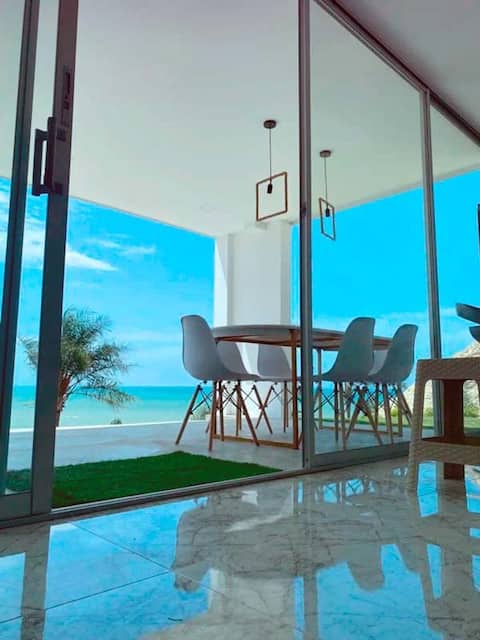
| La Playa | The beachfront area that offers stunning ocean views and is perfect for sunbathing and watersports. Popular among tourists seeking a beach vacation, making it an ideal spot for vacation rentals. | Playa de Bahía, water activities, beachside restaurants, sunset views, surfing spots |
| San Vicente | A nearby town with a blend of local culture and beautiful beaches. Offers a more tranquil environment while being close to Bahía, good for families and those looking to escape the hustle. | San Vicente Beach, local artisan shops, nature walks, cultural events, fishing opportunities |
| Pueblo Nuevo | A vibrant community that features local festivities, markets, and community life. Represents the true Ecuadorian way of life, attracting those interested in immersive experiences. | local markets, Ecuadorian cuisine, cultural festivals, community events, batik workshops |
| La península | Known for its beautiful landscapes and the meeting of the ocean and river. Offers a unique natural experience and is good for eco-tourism, attracting nature lovers. | nature reserves, views of the estuary, hiking trails, birdwatching, fishing camps |
| Chone River | Adjacent to the river, this area offers unique river activities and ecotourism experiences. It's attractive for those looking for adventure and nature-related activities. | kayaking, fishing, wildlife spotting, river tours, picnic areas |
| Matanza | A rural area known for its natural beauty and traditional farming, providing a peaceful getaway for tourists looking to connect with nature and experience local rural life. | organic farms, scenic views, rural walks, local cuisine, community workshops |
| Las Peñas | A scenic area known for its traditional fishermen's village vibe, offering a unique experience of coastal life in Ecuador, suitable for those wanting a cultural immersion. | fishing boats, local seafood markets, cultural exchanges, picturesque views, community festivals |
Understanding Airbnb License Requirements & STR Laws in Bahía de Caráquez (2026)
While Bahía de Caráquez, Manabí, Ecuador currently shows low STR regulations, specific Airbnb license requirements might still exist or change. Always verify the latest short term rental regulations and Airbnb license requirements directly with local government authorities for Bahía de Caráquez to ensure full compliance before hosting.
(Source: AirROI data, 2026, finding no licensed listings among those analyzed)
Top Performing Airbnb Properties in Bahía de Caráquez (2026)
Benchmark your potential! Explore examples of top-performing Airbnb properties in Bahía de Caráquezbased on Trailing Twelve Month (TTM) revenue. Analyze their characteristics, revenue, occupancy rate, and ADR to understand what drives success in this market.

Lovely apartment in Bahia!
Entire Place • 3 bedrooms
Beautiful mini suite with beautiful ocean views
Entire Place • 2 bedrooms

Modern beachfront apartment with infinity pool.
Entire Place • 3 bedrooms

Beautiful beachfront suite with infinity pool.
Entire Place • 1 bedroom

Costa Bahia
Entire Place • 3 bedrooms
Luxurious apartment facing the SEA
Entire Place • 3 bedrooms
Note: Performance varies based on location, size, amenities, seasonality, and management quality. Data reflects the past 12 months.
Top Performing Airbnb Hosts in Bahía de Caráquez (2026)
Learn from the best! This table showcases top-performing Airbnb hosts in Bahía de Caráquez based on the number of properties managed and estimated total revenue over the past year. Analyze their scale and performance metrics.
| Host Name | Properties | Grossing Revenue | Stay Reviews | Avg Rating |
|---|---|---|---|---|
| Amparo | 2 | $15,821 | 339 | 4.83/5.0 |
| Maria De Los Angeles | 2 | $12,953 | 25 | 4.55/5.0 |
| Alba | 1 | $9,911 | 1 | Not Rated |
| Cinthya Nicole | 2 | $8,357 | 25 | 5.00/5.0 |
| Patricio | 1 | $7,491 | 6 | 4.33/5.0 |
| Carolina | 1 | $5,647 | 60 | 4.80/5.0 |
| Cristina Elizabeth | 1 | $5,526 | 46 | 4.93/5.0 |
| Adam | 1 | $5,219 | 96 | 4.90/5.0 |
| Juan | 1 | $5,064 | 28 | 4.54/5.0 |
| Javier | 1 | $4,793 | 20 | 4.80/5.0 |
Analyzing the strategies of top hosts, such as their property selection, pricing, and guest communication, can offer valuable lessons for optimizing your own Airbnb operations in Bahía de Caráquez.
Dive Deeper: Advanced Bahía de Caráquez STR Market Data (2026)
Ready to unlock more insights? AirROI provides access to advanced metrics and comprehensive Airbnb data for Bahía de Caráquez. Explore detailed analytics beyond this report to refine your investment strategy, optimize pricing, and maximize your vacation rental profits.
Explore Advanced MetricsBahía de Caráquez Short-Term Rental Market Composition (2026): Property & Room Types
Room Type Distribution
Property Type Distribution
Market Composition Insights for Bahía de Caráquez
- The Bahía de Caráquez Airbnb market composition is heavily skewed towards Entire Home/Apt listings, which make up 82.9% of the 35 active rentals. This indicates strong guest preference for privacy and space.
- Looking at the property type distribution in Bahía de Caráquez, Apartment/Condo properties are the most common (85.7%), reflecting the local real estate landscape.
Bahía de Caráquez Airbnb Room Capacity Analysis (2026): Bedroom Distribution
Distribution of Listings by Number of Bedrooms
Room Capacity Insights for Bahía de Caráquez
- The dominant room capacity in Bahía de Caráquez is 3 bedrooms listings, making up 31.4% of the market. This suggests a strong demand for properties suitable for families or small groups.
- Together, 3 bedrooms and 2 bedrooms properties represent 60.0% of the active Airbnb listings in Bahía de Caráquez, indicating a high concentration in these sizes.
- A significant 42.8% of listings offer 3+ bedrooms, catering to larger groups and families seeking more space in Bahía de Caráquez.
Bahía de Caráquez Vacation Rental Guest Capacity Trends (2026)
Distribution of Listings by Guest Capacity
Guest Capacity Insights for Bahía de Caráquez
- The most common guest capacity trend in Bahía de Caráquez vacation rentals is listings accommodating 8+ guests (28.6%). This suggests the primary traveler segment is likely larger groups.
- Properties designed for 8+ guests and 6 guests dominate the Bahía de Caráquez STR market, accounting for 57.2% of listings.
- 57.2% of properties accommodate 6+ guests, serving the market segment for larger families or group travel in Bahía de Caráquez.
- On average, properties in Bahía de Caráquez are equipped to host 5.3 guests.
Bahía de Caráquez Airbnb Booking Patterns (2026): Available vs. Booked Days
Available Days Distribution
Booked Days Distribution
Booking Pattern Insights for Bahía de Caráquez
- The most common availability pattern in Bahía de Caráquez falls within the 271-366 days range, representing 100% of listings. This suggests many properties have significant open periods on their calendars.
- Approximately 100.0% of listings show high availability (181+ days open annually), indicating potential for increased bookings or specific owner usage patterns.
- For booked days, the 1-30 days range is most frequent in Bahía de Caráquez (62.9%), reflecting common guest stay durations or potential owner blocking patterns.
Bahía de Caráquez Airbnb Minimum Stay Requirements Analysis
Distribution of Listings by Minimum Night Requirement
1 Night
18 listings
51.4% of total
2 Nights
8 listings
22.9% of total
3 Nights
4 listings
11.4% of total
7-29 Nights
1 listings
2.9% of total
30+ Nights
4 listings
11.4% of total
Key Insights
- The most prevalent minimum stay requirement in Bahía de Caráquez is 1 Night, adopted by 51.4% of listings. This highlights the market's preference for shorter, flexible bookings.
- A strong majority (74.3%) of the Bahía de Caráquez Airbnb data shows acceptance of very short stays (1-2 nights), indicating a dynamic, high-turnover market.
- A significant segment (11.4%) caters to monthly stays (30+ nights) in Bahía de Caráquez, pointing to opportunities in the extended-stay market.
Recommendations
- Align with the market by considering a 1 Night minimum stay, as 51.4% of Bahía de Caráquez hosts use this setting.
- Explore offering discounts for stays of 30+ nights to attract the 11.4% of the market seeking extended stays.
- Adjust minimum nights based on seasonality – potentially shorter during low season and longer during peak demand periods in Bahía de Caráquez.
Bahía de Caráquez Airbnb Cancellation Policy Trends Analysis (2026)
Flexible
13 listings
37.1% of total
Moderate
10 listings
28.6% of total
Firm
9 listings
25.7% of total
Strict
3 listings
8.6% of total
Cancellation Policy Insights for Bahía de Caráquez
- The prevailing Airbnb cancellation policy trend in Bahía de Caráquez is Flexible, used by 37.1% of listings.
- There's a relatively balanced mix between guest-friendly (65.7%) and stricter (34.3%) policies, offering choices for different guest needs.
- Strict cancellation policies are quite rare (8.6%), potentially making listings with this policy less competitive unless justified by high demand or property type.
Recommendations for Hosts
- Consider adopting a Flexible policy to align with the 37.1% market standard in Bahía de Caráquez.
- Using a Strict policy might deter some guests, as only 8.6% of listings use it. Evaluate if potential revenue protection outweighs possible lower booking rates.
- Regularly review your cancellation policy against competitors and market demand shifts in Bahía de Caráquez.
Bahía de Caráquez STR Booking Lead Time Analysis (2026)
Average Booking Lead Time by Month
Booking Lead Time Insights for Bahía de Caráquez
- The overall average booking lead time for vacation rentals in Bahía de Caráquez is 37 days.
- Guests book furthest in advance for stays during December (average 86 days), likely coinciding with peak travel demand or local events.
- The shortest booking windows occur for stays in June (average 2 days), indicating more last-minute travel plans during this time.
- Seasonally, Winter (48 days avg.) sees the longest lead times, while Summer (16 days avg.) has the shortest, reflecting typical travel planning cycles.
Recommendations for Hosts
- Use the overall average lead time (37 days) as a baseline for your pricing and availability strategy in Bahía de Caráquez.
- For December stays, consider implementing length-of-stay discounts or slightly higher rates for bookings made less than 86 days out to capitalize on advance planning.
- During June, focus on last-minute booking availability and promotions, as guests book with very short notice (2 days avg.).
- Target marketing efforts for the Winter season well in advance (at least 48 days) to capture early planners.
- Monitor your own booking lead times against these Bahía de Caráquez averages to identify opportunities for dynamic pricing adjustments.
Popular & Essential Airbnb Amenities in Bahía de Caráquez (2026)
Amenity Prevalence
Amenity Insights for Bahía de Caráquez
- Popular amenities like Wifi, TV, Free parking on premises are common but not universal. Offering these can provide a competitive edge.
- Warning: Wifi is not universally provided but is considered essential globally. Ensure reliable Wifi is offered.
Recommendations for Hosts
- Consider adding popular differentiators like Wifi or TV to increase appeal.
- Highlight unique or less common amenities you offer (e.g., hot tub, dedicated workspace, EV charger) in your listing description and photos.
- Regularly check competitor amenities in Bahía de Caráquez to stay competitive.
Bahía de Caráquez Airbnb Guest Demographics & Profile Analysis (2026)
Guest Profile Summary for Bahía de Caráquez
- The typical guest profile for Airbnb in Bahía de Caráquez consists of primarily domestic travelers (84%), often arriving from nearby Quito, typically belonging to the Post-2000s (Gen Z/Alpha) group (50%), primarily speaking Spanish or English.
- Domestic travelers account for 84.1% of guests.
- Key international markets include Ecuador (84.1%) and United States (9.1%).
- Top languages spoken are Spanish (47.8%) followed by English (37%).
- A significant demographic segment is the Post-2000s (Gen Z/Alpha) group, representing 50% of guests.
Recommendations for Hosts
- Target domestic marketing efforts towards travelers from Quito and Guayaquil.
- Tailor amenities and listing descriptions to appeal to the dominant Post-2000s (Gen Z/Alpha) demographic (e.g., highlight fast WiFi, smart home features, local guides).
- Highlight unique local experiences or amenities relevant to the primary guest profile.
- Consider seasonal promotions aligned with peak travel times for key origin markets.
Nearby Short-Term Rental Market Comparison
How does the Bahía de Caráquez Airbnb market stack up against its neighbors? Compare key performance metrics like average monthly revenue, ADR, and occupancy rates in surrounding areas to understand the broader regional STR landscape.
| Market | Active Properties | Monthly Revenue | Daily Rate | Avg. Occupancy |
|---|---|---|---|---|
| Curia | 30 | $1,454 | $243.84 | 22% |
| Jama | 50 | $1,145 | $187.29 | 24% |
| Parroquia Manglaralto | 26 | $1,076 | $204.86 | 20% |
| La Entrada | 38 | $968 | $203.21 | 26% |
| Cojimíes | 75 | $869 | $206.34 | 19% |
| Ayangue | 58 | $861 | $150.30 | 18% |
| Tonchigüe | 239 | $695 | $159.24 | 20% |
| Olón | 178 | $623 | $144.07 | 22% |
| Pedernales | 52 | $529 | $128.89 | 17% |
| Cadeate | 15 | $507 | $142.12 | 24% |