Ibarra Airbnb Market Analysis 2026: Short Term Rental Data & Vacation Rental Statistics in Imbabura, Ecuador
Is Airbnb profitable in Ibarra in 2026? Explore comprehensive Airbnb analytics for Ibarra, Imbabura, Ecuador to uncover income potential. This 2026 STR market report for Ibarra, based on AirROI data from February 2025 to January 2026, reveals key trends in the niche market of 130 active listings.
Whether you're considering an Airbnb investment in Ibarra, optimizing your existing vacation rental, or exploring rental arbitrage opportunities, understanding the Ibarra Airbnb data is crucial. Leveraging the low regulation environment is key to maximizing your short term rental income potential. Let's dive into the specifics.
Key Ibarra Airbnb Performance Metrics Overview
Monthly Airbnb Revenue Variations & Income Potential in Ibarra (2026)
Understanding the monthly revenue variations for Airbnb listings in Ibarra is key to maximizing your short term rental income potential. Seasonality significantly impacts earnings. Our analysis, based on data from the past 12 months, shows that the peak revenue month for STRs in Ibarra is typically December, while April often presents the lowest earnings, highlighting opportunities for strategic pricing adjustments during shoulder and low seasons. Explore the typical Airbnb income in Ibarra across different performance tiers:
- Best-in-class properties (Top 10%) achieve $666+ monthly, often utilizing dynamic pricing and superior guest experiences.
- Strong performing properties (Top 25%) earn $369 or more, indicating effective management and desirable locations/amenities.
- Typical properties (Median) generate around $187 per month, representing the average market performance.
- Entry-level properties (Bottom 25%) see earnings around $86, often with potential for optimization.
Average Monthly Airbnb Earnings Trend in Ibarra
Ibarra Airbnb Occupancy Rate Trends (2026)
Maximize your bookings by understanding the Ibarra STR occupancy trends. Seasonal demand shifts significantly influence how often properties are booked. Typically, Decembersees the highest demand (peak season occupancy), while January experiences the lowest (low season). Effective strategies, like adjusting minimum stays or offering promotions, can boost occupancy during slower periods. Here's how different property tiers perform in Ibarra:
- Best-in-class properties (Top 10%) achieve 53%+ occupancy, indicating high desirability and potentially optimized availability.
- Strong performing properties (Top 25%) maintain 33% or higher occupancy, suggesting good market fit and guest satisfaction.
- Typical properties (Median) have an occupancy rate around 18%.
- Entry-level properties (Bottom 25%) average 8% occupancy, potentially facing higher vacancy.
Average Monthly Occupancy Rate Trend in Ibarra
Average Daily Rate (ADR) Airbnb Trends in Ibarra (2026)
Effective short term rental pricing strategy in Ibarra involves understanding monthly ADR fluctuations. The Average Daily Rate (ADR) for Airbnb in Ibarra typically peaks in September and dips lowest during April. Leveraging Airbnb dynamic pricing tools or strategies based on this seasonality can significantly boost revenue. Here's a look at the typical nightly rates achieved:
- Best-in-class properties (Top 10%) command rates of $77+ per night, often due to premium features or locations.
- Strong performing properties (Top 25%) achieve nightly rates of $48 or more.
- Typical properties (Median) charge around $30 per night.
- Entry-level properties (Bottom 25%) earn around $20 per night.
Average Daily Rate (ADR) Trend by Month in Ibarra
Get Live Ibarra Market Intelligence 👇

Explore Real-time Analytics
Airbnb Seasonality Analysis & Trends in Ibarra (2026)
Peak Season (December, August, March)
- Revenue averages $351 per month
- Occupancy rates average 27.1%
- Daily rates average $41
Shoulder Season
- Revenue averages $293 per month
- Occupancy maintains around 24.0%
- Daily rates hold near $42
Low Season (January, April, October)
- Revenue drops to average $240 per month
- Occupancy decreases to average 19.8%
- Daily rates adjust to average $41
Seasonality Insights for Ibarra
- The Airbnb seasonality in Ibarra shows moderate seasonality with distinct peak and low periods. While the sections above show seasonal averages, it's also insightful to look at the extremes:
- During the high season, the absolute peak month showcases Ibarra's highest earning potential, with monthly revenues capable of climbing to $383, occupancy reaching a high of 28.7%, and ADRs peaking at $43.
- Conversely, the slowest single month of the year, typically falling within the low season, marks the market's lowest point. In this month, revenue might dip to $210, occupancy could drop to 17.7%, and ADRs may adjust down to $39.
- Understanding both the seasonal averages and these monthly peaks and troughs in revenue, occupancy, and ADR is crucial for maximizing your Airbnb profit potential in Ibarra.
Seasonal Strategies for Maximizing Profit
- Peak Season: Maximize revenue through premium pricing and potentially longer minimum stays. Ensure high availability.
- Low Season: Offer competitive pricing, special promotions (e.g., extended stay discounts), and flexible cancellation policies. Target off-season travelers like remote workers or budget-conscious guests.
- Shoulder Seasons: Implement dynamic pricing that balances peak and low rates. Target weekend travelers or specific events. Offer slightly more flexible terms than peak season.
- Regularly analyze your own performance against these Ibarra seasonality benchmarks and adjust your pricing and availability strategy accordingly.
Best Areas for Airbnb Investment in Ibarra (2026)
Exploring the top neighborhoods for short-term rentals in Ibarra? This section highlights key areas, outlining why they are attractive for hosts and guests, along with notable local attractions. Consider these locations based on your target guest profile and investment strategy.
| Neighborhood / Area | Why Host Here? (Target Guests & Appeal) | Key Attractions & Landmarks |
|---|---|---|
| Centro Histórico de Ibarra | Main historical district of Ibarra, rich in colonial architecture and cultural heritage. It draws tourists interested in history and unique local experiences. | Plaza de los Juncos, Catedral de Ibarra, Museo Arqueológico, Teatro Gran Colombia, Parque Pedro Moncayo |
| Parque La Vida | A popular park area offering outdoor activities and relaxation spaces. Suitable for families and groups looking for recreational activities. | Parque La Vida, Paseo de los Juncos, Mirador del Teleférico, Cerro Atuncalcana |
| Las Brisas | A residential area known for its tranquility and proximity to natural attractions. Perfect for guests seeking a peaceful retreat with access to nature. | Laguna de Yahuarcocha, Cerro El Pinchot, Iglesia de Las Brisas |
| San Antonio de Ibarra | Famous for its wood carving artisans and traditional crafts. Attracts visitors interested in culture and art. | Centro de Artesanías, Iglesia de San Antonio, Mirador del Cóndor |
| Yahuarcocha | A scenic lake that offers recreational activities and beautiful views. Ideal for nature lovers and outdoor enthusiasts. | Yahuarcocha Lake, Water sports activities, Scenic viewpoints |
| Sector Mapa y Calle Siete | A trendy neighborhood with local eateries and shops. Attracts younger crowds looking for a vibrant local living experience. | Local markets, Restaurants, Cafes |
| Avenida 17 de Julio | A central avenue bustling with shops, restaurants, and bars. Great for guests who want to be close to urban amenities and nightlife. | Shopping centers, Restaurants, Bars |
| Sector Cochasquí | An area known for archaeological sites and natural beauty. It offers guests a chance to explore ancient cultures and stunning landscapes. | Ruinas de Cochasquí, Cultural heritage sites, Nature trails |
Understanding Airbnb License Requirements & STR Laws in Ibarra (2026)
While Ibarra, Imbabura, Ecuador currently shows low STR regulations, specific Airbnb license requirements might still exist or change. Always verify the latest short term rental regulations and Airbnb license requirements directly with local government authorities for Ibarra to ensure full compliance before hosting.
(Source: AirROI data, 2026, finding no licensed listings among those analyzed)
Top Performing Airbnb Properties in Ibarra (2026)
Benchmark your potential! Explore examples of top-performing Airbnb properties in Ibarrabased on Trailing Twelve Month (TTM) revenue. Analyze their characteristics, revenue, occupancy rate, and ADR to understand what drives success in this market.

House un Ibarra
Entire Place • 5 bedrooms
Amazing Lake view - Ecuador, Ibarra, Yahuarcocha
Entire Place • 3 bedrooms
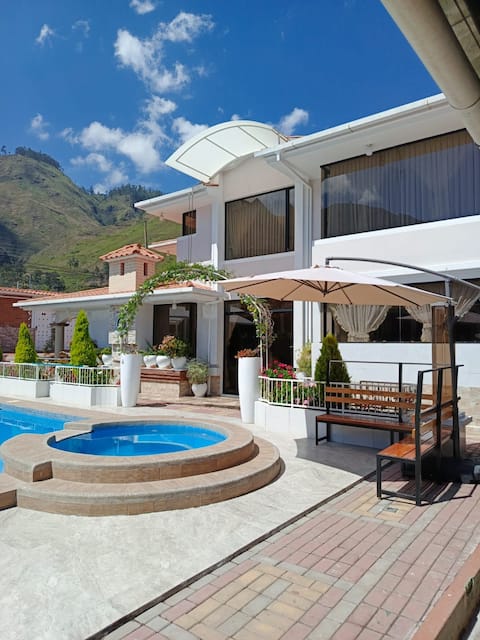
Luxurious Villa, 7 Bedroom, Heated Pool, Free WiFi
Entire Place • 5 bedrooms
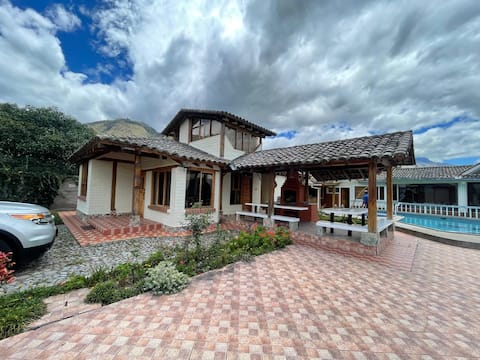
Farm in Yahuarcocha Ibarra
Entire Place • 6 bedrooms
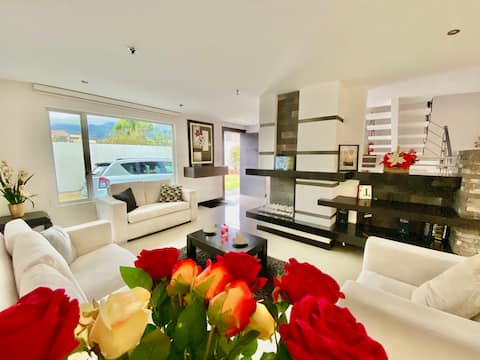
Modern Minimalist House Ibarra
Entire Place • 3 bedrooms
Lu's House
Entire Place • 3 bedrooms
Note: Performance varies based on location, size, amenities, seasonality, and management quality. Data reflects the past 12 months.
Top Performing Airbnb Hosts in Ibarra (2026)
Learn from the best! This table showcases top-performing Airbnb hosts in Ibarra based on the number of properties managed and estimated total revenue over the past year. Analyze their scale and performance metrics.
| Host Name | Properties | Grossing Revenue | Stay Reviews | Avg Rating |
|---|---|---|---|---|
| Diego | 2 | $20,278 | 91 | 4.94/5.0 |
| Doris Silvana | 1 | $18,018 | 113 | 4.92/5.0 |
| Hansjoerg | 5 | $13,856 | 240 | 4.82/5.0 |
| Lucy | 4 | $10,794 | 140 | 4.81/5.0 |
| Jorge | 1 | $10,576 | 80 | 4.95/5.0 |
| Sammyr | 1 | $9,963 | 1 | Not Rated |
| Sharon | 3 | $8,900 | 574 | 4.79/5.0 |
| Diego | 2 | $8,808 | 294 | 4.82/5.0 |
| Carolina | 2 | $8,137 | 151 | 4.92/5.0 |
| Fredy | 1 | $7,842 | 74 | 4.96/5.0 |
Analyzing the strategies of top hosts, such as their property selection, pricing, and guest communication, can offer valuable lessons for optimizing your own Airbnb operations in Ibarra.
Dive Deeper: Advanced Ibarra STR Market Data (2026)
Ready to unlock more insights? AirROI provides access to advanced metrics and comprehensive Airbnb data for Ibarra. Explore detailed analytics beyond this report to refine your investment strategy, optimize pricing, and maximize your vacation rental profits.
Explore Advanced MetricsIbarra Short-Term Rental Market Composition (2026): Property & Room Types
Room Type Distribution
Property Type Distribution
Market Composition Insights for Ibarra
- The Ibarra Airbnb market composition is heavily skewed towards Entire Home/Apt listings, which make up 74.6% of the 130 active rentals. This indicates strong guest preference for privacy and space.
- Looking at the property type distribution in Ibarra, House properties are the most common (45.4%), reflecting the local real estate landscape.
- Houses represent a significant 45.4% portion, catering likely to families or larger groups.
- The presence of 9.2% Hotel/Boutique listings indicates integration with traditional hospitality.
- Smaller segments like others, outdoor/unique (combined 6.1%) offer potential for unique stay experiences.
Ibarra Airbnb Room Capacity Analysis (2026): Bedroom Distribution
Distribution of Listings by Number of Bedrooms
Room Capacity Insights for Ibarra
- The dominant room capacity in Ibarra is 1 bedroom listings, making up 28.5% of the market. This suggests a strong demand for properties suitable for couples or solo travelers.
- Together, 1 bedroom and 3 bedrooms properties represent 53.9% of the active Airbnb listings in Ibarra, indicating a high concentration in these sizes.
- A significant 37.7% of listings offer 3+ bedrooms, catering to larger groups and families seeking more space in Ibarra.
Ibarra Vacation Rental Guest Capacity Trends (2026)
Distribution of Listings by Guest Capacity
Guest Capacity Insights for Ibarra
- The most common guest capacity trend in Ibarra vacation rentals is listings accommodating 6 guests (23.1%). This suggests the primary traveler segment is likely larger groups.
- Properties designed for 6 guests and 2 guests dominate the Ibarra STR market, accounting for 39.3% of listings.
- 41.6% of properties accommodate 6+ guests, serving the market segment for larger families or group travel in Ibarra.
- On average, properties in Ibarra are equipped to host 4.2 guests.
Ibarra Airbnb Booking Patterns (2026): Available vs. Booked Days
Available Days Distribution
Booked Days Distribution
Booking Pattern Insights for Ibarra
- The most common availability pattern in Ibarra falls within the 271-366 days range, representing 80.8% of listings. This suggests many properties have significant open periods on their calendars.
- Approximately 99.3% of listings show high availability (181+ days open annually), indicating potential for increased bookings or specific owner usage patterns.
- For booked days, the 31-90 days range is most frequent in Ibarra (43.1%), reflecting common guest stay durations or potential owner blocking patterns.
- A notable 1.5% of properties secure long booking periods (181+ days booked per year), highlighting successful long-term rental strategies or significant owner usage.
Ibarra Airbnb Minimum Stay Requirements Analysis
Distribution of Listings by Minimum Night Requirement
1 Night
112 listings
86.2% of total
2 Nights
11 listings
8.5% of total
30+ Nights
7 listings
5.4% of total
Key Insights
- The most prevalent minimum stay requirement in Ibarra is 1 Night, adopted by 86.2% of listings. This highlights the market's preference for shorter, flexible bookings.
- A strong majority (94.7%) of the Ibarra Airbnb data shows acceptance of very short stays (1-2 nights), indicating a dynamic, high-turnover market.
Recommendations
- Align with the market by considering a 1 Night minimum stay, as 86.2% of Ibarra hosts use this setting.
- Explore offering discounts for stays of 30+ nights to attract the 5.4% of the market seeking extended stays.
- Adjust minimum nights based on seasonality – potentially shorter during low season and longer during peak demand periods in Ibarra.
Ibarra Airbnb Cancellation Policy Trends Analysis (2026)
Flexible
62 listings
48.1% of total
Moderate
48 listings
37.2% of total
Firm
15 listings
11.6% of total
Strict
4 listings
3.1% of total
Cancellation Policy Insights for Ibarra
- The prevailing Airbnb cancellation policy trend in Ibarra is Flexible, used by 48.1% of listings.
- The market strongly favors guest-friendly terms, with 85.3% of listings offering Flexible or Moderate policies. This suggests guests in Ibarra may expect booking flexibility.
- Strict cancellation policies are quite rare (3.1%), potentially making listings with this policy less competitive unless justified by high demand or property type.
Recommendations for Hosts
- Consider adopting a Flexible policy to align with the 48.1% market standard in Ibarra.
- Using a Strict policy might deter some guests, as only 3.1% of listings use it. Evaluate if potential revenue protection outweighs possible lower booking rates.
- Regularly review your cancellation policy against competitors and market demand shifts in Ibarra.
Ibarra STR Booking Lead Time Analysis (2026)
Average Booking Lead Time by Month
Booking Lead Time Insights for Ibarra
- The overall average booking lead time for vacation rentals in Ibarra is 12 days.
- Guests book furthest in advance for stays during August (average 15 days), likely coinciding with peak travel demand or local events.
- The shortest booking windows occur for stays in April (average 6 days), indicating more last-minute travel plans during this time.
- Seasonally, Winter (11 days avg.) sees the longest lead times, while Spring (9 days avg.) has the shortest, reflecting typical travel planning cycles.
Recommendations for Hosts
- Use the overall average lead time (12 days) as a baseline for your pricing and availability strategy in Ibarra.
- Target marketing efforts for the Winter season well in advance (at least 11 days) to capture early planners.
- Monitor your own booking lead times against these Ibarra averages to identify opportunities for dynamic pricing adjustments.
Popular & Essential Airbnb Amenities in Ibarra (2026)
Amenity Prevalence
Amenity Insights for Ibarra
- Essential amenities in Ibarra that guests expect include: Wifi. Lacking these (this) could significantly impact bookings.
- Popular amenities like TV, Free parking on premises, Kitchen are common but not universal. Offering these can provide a competitive edge.
Recommendations for Hosts
- Ensure your listing includes all essential amenities for Ibarra: Wifi.
- Prioritize adding missing essentials: Wifi.
- Consider adding popular differentiators like TV or Free parking on premises to increase appeal.
- Highlight unique or less common amenities you offer (e.g., hot tub, dedicated workspace, EV charger) in your listing description and photos.
- Regularly check competitor amenities in Ibarra to stay competitive.
Ibarra Airbnb Guest Demographics & Profile Analysis (2026)
Guest Profile Summary for Ibarra
- The typical guest profile for Airbnb in Ibarra consists of primarily domestic travelers (81%), often arriving from nearby Quito, typically belonging to the Post-2000s (Gen Z/Alpha) group (50%), primarily speaking Spanish or English.
- Domestic travelers account for 80.9% of guests.
- Key international markets include Ecuador (80.9%) and United States (7%).
- Top languages spoken are Spanish (54%) followed by English (33.8%).
- A significant demographic segment is the Post-2000s (Gen Z/Alpha) group, representing 50% of guests.
Recommendations for Hosts
- Target domestic marketing efforts towards travelers from Quito and Ambato.
- Tailor amenities and listing descriptions to appeal to the dominant Post-2000s (Gen Z/Alpha) demographic (e.g., highlight fast WiFi, smart home features, local guides).
- Highlight unique local experiences or amenities relevant to the primary guest profile.
- Consider seasonal promotions aligned with peak travel times for key origin markets.
Nearby Short-Term Rental Market Comparison
How does the Ibarra Airbnb market stack up against its neighbors? Compare key performance metrics like average monthly revenue, ADR, and occupancy rates in surrounding areas to understand the broader regional STR landscape.