Atuntaqui Airbnb Market Analysis 2026: Short Term Rental Data & Vacation Rental Statistics in Imbabura, Ecuador
Is Airbnb profitable in Atuntaqui in 2026? Explore comprehensive Airbnb analytics for Atuntaqui, Imbabura, Ecuador to uncover income potential. This 2026 STR market report for Atuntaqui, based on AirROI data from February 2025 to January 2026, reveals key trends in the niche market of 46 active listings.
Whether you're considering an Airbnb investment in Atuntaqui, optimizing your existing vacation rental, or exploring rental arbitrage opportunities, understanding the Atuntaqui Airbnb data is crucial. Leveraging the low regulation environment is key to maximizing your short term rental income potential. Let's dive into the specifics.
Key Atuntaqui Airbnb Performance Metrics Overview
Monthly Airbnb Revenue Variations & Income Potential in Atuntaqui (2026)
Understanding the monthly revenue variations for Airbnb listings in Atuntaqui is key to maximizing your short term rental income potential. Seasonality significantly impacts earnings. Our analysis, based on data from the past 12 months, shows that the peak revenue month for STRs in Atuntaqui is typically August, while February often presents the lowest earnings, highlighting opportunities for strategic pricing adjustments during shoulder and low seasons. Explore the typical Airbnb income in Atuntaqui across different performance tiers:
- Best-in-class properties (Top 10%) achieve $749+ monthly, often utilizing dynamic pricing and superior guest experiences.
- Strong performing properties (Top 25%) earn $393 or more, indicating effective management and desirable locations/amenities.
- Typical properties (Median) generate around $193 per month, representing the average market performance.
- Entry-level properties (Bottom 25%) see earnings around $90, often with potential for optimization.
Average Monthly Airbnb Earnings Trend in Atuntaqui
Atuntaqui Airbnb Occupancy Rate Trends (2026)
Maximize your bookings by understanding the Atuntaqui STR occupancy trends. Seasonal demand shifts significantly influence how often properties are booked. Typically, Septembersees the highest demand (peak season occupancy), while October experiences the lowest (low season). Effective strategies, like adjusting minimum stays or offering promotions, can boost occupancy during slower periods. Here's how different property tiers perform in Atuntaqui:
- Best-in-class properties (Top 10%) achieve 42%+ occupancy, indicating high desirability and potentially optimized availability.
- Strong performing properties (Top 25%) maintain 26% or higher occupancy, suggesting good market fit and guest satisfaction.
- Typical properties (Median) have an occupancy rate around 12%.
- Entry-level properties (Bottom 25%) average 6% occupancy, potentially facing higher vacancy.
Average Monthly Occupancy Rate Trend in Atuntaqui
Average Daily Rate (ADR) Airbnb Trends in Atuntaqui (2026)
Effective short term rental pricing strategy in Atuntaqui involves understanding monthly ADR fluctuations. The Average Daily Rate (ADR) for Airbnb in Atuntaqui typically peaks in June and dips lowest during November. Leveraging Airbnb dynamic pricing tools or strategies based on this seasonality can significantly boost revenue. Here's a look at the typical nightly rates achieved:
- Best-in-class properties (Top 10%) command rates of $112+ per night, often due to premium features or locations.
- Strong performing properties (Top 25%) achieve nightly rates of $80 or more.
- Typical properties (Median) charge around $38 per night.
- Entry-level properties (Bottom 25%) earn around $26 per night.
Average Daily Rate (ADR) Trend by Month in Atuntaqui
Get Live Atuntaqui Market Intelligence 👇

Explore Real-time Analytics
Airbnb Seasonality Analysis & Trends in Atuntaqui (2026)
Peak Season (August, March, December)
- Revenue averages $393 per month
- Occupancy rates average 20.8%
- Daily rates average $59
Shoulder Season
- Revenue averages $303 per month
- Occupancy maintains around 20.2%
- Daily rates hold near $58
Low Season (February, April, May)
- Revenue drops to average $246 per month
- Occupancy decreases to average 16.0%
- Daily rates adjust to average $59
Seasonality Insights for Atuntaqui
- The Airbnb seasonality in Atuntaqui shows moderate seasonality with distinct peak and low periods. While the sections above show seasonal averages, it's also insightful to look at the extremes:
- During the high season, the absolute peak month showcases Atuntaqui's highest earning potential, with monthly revenues capable of climbing to $429, occupancy reaching a high of 25.0%, and ADRs peaking at $61.
- Conversely, the slowest single month of the year, typically falling within the low season, marks the market's lowest point. In this month, revenue might dip to $223, occupancy could drop to 13.2%, and ADRs may adjust down to $57.
- Understanding both the seasonal averages and these monthly peaks and troughs in revenue, occupancy, and ADR is crucial for maximizing your Airbnb profit potential in Atuntaqui.
Seasonal Strategies for Maximizing Profit
- Peak Season: Maximize revenue through premium pricing and potentially longer minimum stays. Ensure high availability.
- Low Season: Offer competitive pricing, special promotions (e.g., extended stay discounts), and flexible cancellation policies. Target off-season travelers like remote workers or budget-conscious guests.
- Shoulder Seasons: Implement dynamic pricing that balances peak and low rates. Target weekend travelers or specific events. Offer slightly more flexible terms than peak season.
- Regularly analyze your own performance against these Atuntaqui seasonality benchmarks and adjust your pricing and availability strategy accordingly.
Best Areas for Airbnb Investment in Atuntaqui (2026)
Exploring the top neighborhoods for short-term rentals in Atuntaqui? This section highlights key areas, outlining why they are attractive for hosts and guests, along with notable local attractions. Consider these locations based on your target guest profile and investment strategy.
| Neighborhood / Area | Why Host Here? (Target Guests & Appeal) | Key Attractions & Landmarks |
|---|---|---|
| Centro de Atuntaqui | The vibrant center of Atuntaqui, known for its local shops, markets, and restaurants. A convenient location for guests looking to immerse themselves in the local culture and enjoy easy access to amenities. | Local food markets, Museo de la Chicha, El Parque Central, Plaza de los Tres Fuegos, Artisan shops |
| Parque de los Chimborazos | A calming neighborhood close to the Chimborazo mountain range, providing opportunities for nature lovers and adventure seekers. Ideal for guests looking for outdoor activities and breathtaking views. | Chimborazo Volcano, hiking trails, local wildlife, panoramic viewpoints |
| Quilotoa Loop | This scenic area is famous for the Quilotoa Crater Lake, attracting tourists seeking natural beauty and adventure. An excellent investment potential for short-term rentals due to incoming tourists. | Quilotoa Crater Lake, hiking paths, traditional villages, local artisans |
| Cascadas de Peguche | A charming area known for its beautiful waterfalls and lush surroundings, perfect for eco-tourists and those on spiritual retreats. | Peguche Waterfall, Kichwa communities, nature trails, cultural experiences |
| Otavalo Market | Just a short drive away, Otavalo is famous for its indigenous market, attracting tourists and shoppers. An excellent place for Airbnb hosting targeting shopping enthusiasts and cultural travelers. | Otavalo Market, Plaza de los Ponchos, Indigenous crafts, Cultural festivals |
| Imbabura Province | The surrounding Imbabura province offers a blend of rich culture and stunning landscapes, ideal for travelers interested in exploring beyond just Atuntaqui. | Laguna de Cuicocha, Peguche Waterfall, Cotacachi town, cultural festivals |
| Tena | A bit further away, Tena is the gateway to the Amazon, attracting adventure seekers and nature lovers looking for eco-experience and wildlife exploration. | Amazon Rainforest, rafting and kayaking, wildlife tours, cultural exchanges |
| Ibarra | As the capital of Imbabura, Ibarra attracts visitors for its parks and historic architecture, providing a great option for urban and cultural tourists. | Parque Pedro Moncayo, Iglesia de San Francisco, Museo de Ibarra |
Understanding Airbnb License Requirements & STR Laws in Atuntaqui (2026)
While Atuntaqui, Imbabura, Ecuador currently shows low STR regulations, specific Airbnb license requirements might still exist or change. Always verify the latest short term rental regulations and Airbnb license requirements directly with local government authorities for Atuntaqui to ensure full compliance before hosting.
(Source: AirROI data, 2026, finding no licensed listings among those analyzed)
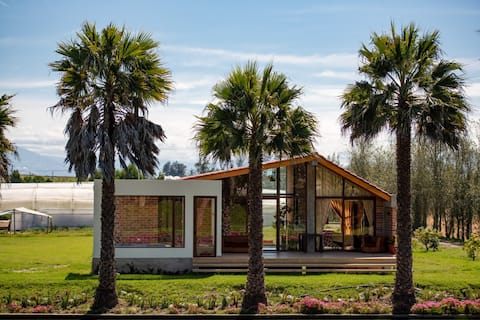
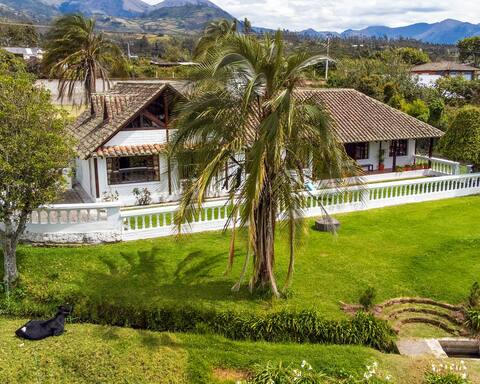
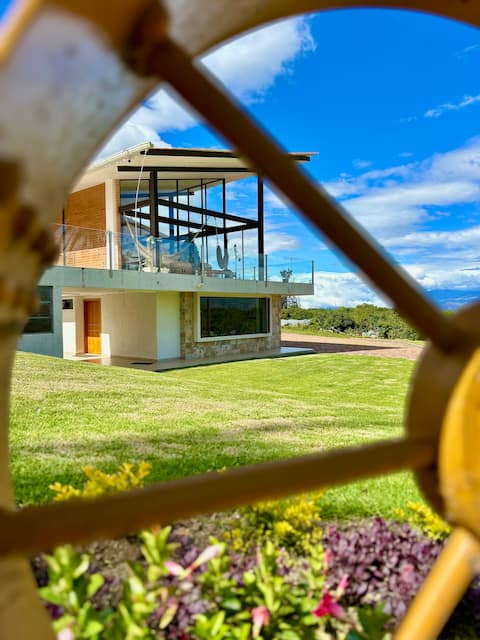
Top Performing Airbnb Properties in Atuntaqui (2026)
Benchmark your potential! Explore examples of top-performing Airbnb properties in Atuntaquibased on Trailing Twelve Month (TTM) revenue. Analyze their characteristics, revenue, occupancy rate, and ADR to understand what drives success in this market.

Beautiful house in Ibarra
Entire Place • 4 bedrooms
“Las Golondrinas” Lake Cabin
Private Room • 5 bedrooms
The Giralda de Santa Rosa
Entire Place • 4 bedrooms

Casa de campo
Entire Place • 4 bedrooms
El Paraiso EcoFarm Suite in Chaltura with Pool
Entire Place • 2 bedrooms

Spacious and beautiful apartment. Complete
Entire Place • 2 bedrooms
Note: Performance varies based on location, size, amenities, seasonality, and management quality. Data reflects the past 12 months.
Top Performing Airbnb Hosts in Atuntaqui (2026)
Learn from the best! This table showcases top-performing Airbnb hosts in Atuntaqui based on the number of properties managed and estimated total revenue over the past year. Analyze their scale and performance metrics.
| Host Name | Properties | Grossing Revenue | Stay Reviews | Avg Rating |
|---|---|---|---|---|
| Las Golondrinas | 4 | $18,241 | 66 | 4.80/5.0 |
| Martha Susana | 1 | $13,816 | 54 | 4.96/5.0 |
| Patricia Denisse | 1 | $7,642 | 9 | 4.78/5.0 |
| Cristina | 2 | $7,500 | 113 | 4.82/5.0 |
| Jazmín | 1 | $7,192 | 10 | 4.80/5.0 |
| Fredy | 1 | $6,976 | 210 | 4.96/5.0 |
| Martha | 3 | $6,196 | 207 | 4.91/5.0 |
| Fabian Efren | 6 | $5,946 | 74 | 4.93/5.0 |
| Vanessa | 1 | $5,255 | 69 | 4.86/5.0 |
| Juan Pablo | 1 | $4,070 | 138 | 4.97/5.0 |
Analyzing the strategies of top hosts, such as their property selection, pricing, and guest communication, can offer valuable lessons for optimizing your own Airbnb operations in Atuntaqui.
Dive Deeper: Advanced Atuntaqui STR Market Data (2026)
Ready to unlock more insights? AirROI provides access to advanced metrics and comprehensive Airbnb data for Atuntaqui. Explore detailed analytics beyond this report to refine your investment strategy, optimize pricing, and maximize your vacation rental profits.
Explore Advanced MetricsAtuntaqui Short-Term Rental Market Composition (2026): Property & Room Types
Room Type Distribution
Property Type Distribution
Market Composition Insights for Atuntaqui
- The Atuntaqui Airbnb market composition is heavily skewed towards Entire Home/Apt listings, which make up 73.9% of the 46 active rentals. This indicates strong guest preference for privacy and space.
- Looking at the property type distribution in Atuntaqui, Apartment/Condo properties are the most common (34.8%), reflecting the local real estate landscape.
- Houses represent a significant 28.3% portion, catering likely to families or larger groups.
- The presence of 6.5% Hotel/Boutique listings indicates integration with traditional hospitality.
- Smaller segments like unique stays (combined 2.2%) offer potential for unique stay experiences.
Atuntaqui Airbnb Room Capacity Analysis (2026): Bedroom Distribution
Distribution of Listings by Number of Bedrooms
Room Capacity Insights for Atuntaqui
- The dominant room capacity in Atuntaqui is 2 bedrooms listings, making up 32.6% of the market. This suggests a strong demand for properties suitable for couples or solo travelers.
- Together, 2 bedrooms and 1 bedroom properties represent 58.7% of the active Airbnb listings in Atuntaqui, indicating a high concentration in these sizes.
- A significant 39.1% of listings offer 3+ bedrooms, catering to larger groups and families seeking more space in Atuntaqui.
Atuntaqui Vacation Rental Guest Capacity Trends (2026)
Distribution of Listings by Guest Capacity
Guest Capacity Insights for Atuntaqui
- The most common guest capacity trend in Atuntaqui vacation rentals is listings accommodating 8+ guests (28.3%). This suggests the primary traveler segment is likely larger groups.
- Properties designed for 8+ guests and 4 guests dominate the Atuntaqui STR market, accounting for 54.4% of listings.
- 41.3% of properties accommodate 6+ guests, serving the market segment for larger families or group travel in Atuntaqui.
- On average, properties in Atuntaqui are equipped to host 4.9 guests.
Atuntaqui Airbnb Booking Patterns (2026): Available vs. Booked Days
Available Days Distribution
Booked Days Distribution
Booking Pattern Insights for Atuntaqui
- The most common availability pattern in Atuntaqui falls within the 271-366 days range, representing 84.8% of listings. This suggests many properties have significant open periods on their calendars.
- Approximately 100.0% of listings show high availability (181+ days open annually), indicating potential for increased bookings or specific owner usage patterns.
- For booked days, the 1-30 days range is most frequent in Atuntaqui (43.5%), reflecting common guest stay durations or potential owner blocking patterns.
Atuntaqui Airbnb Minimum Stay Requirements Analysis
Distribution of Listings by Minimum Night Requirement
1 Night
43 listings
93.5% of total
2 Nights
2 listings
4.3% of total
4-6 Nights
1 listings
2.2% of total
Key Insights
- The most prevalent minimum stay requirement in Atuntaqui is 1 Night, adopted by 93.5% of listings. This highlights the market's preference for shorter, flexible bookings.
- A strong majority (97.8%) of the Atuntaqui Airbnb data shows acceptance of very short stays (1-2 nights), indicating a dynamic, high-turnover market.
Recommendations
- Align with the market by considering a 1 Night minimum stay, as 93.5% of Atuntaqui hosts use this setting.
- Adjust minimum nights based on seasonality – potentially shorter during low season and longer during peak demand periods in Atuntaqui.
Atuntaqui Airbnb Cancellation Policy Trends Analysis (2026)
Flexible
25 listings
54.3% of total
Moderate
9 listings
19.6% of total
Firm
9 listings
19.6% of total
Strict
3 listings
6.5% of total
Cancellation Policy Insights for Atuntaqui
- The prevailing Airbnb cancellation policy trend in Atuntaqui is Flexible, used by 54.3% of listings.
- The market strongly favors guest-friendly terms, with 73.9% of listings offering Flexible or Moderate policies. This suggests guests in Atuntaqui may expect booking flexibility.
- Strict cancellation policies are quite rare (6.5%), potentially making listings with this policy less competitive unless justified by high demand or property type.
Recommendations for Hosts
- Consider adopting a Flexible policy to align with the 54.3% market standard in Atuntaqui.
- Given the high prevalence of Flexible policies (54.3%), offering this can enhance booking appeal, especially during shoulder seasons.
- Using a Strict policy might deter some guests, as only 6.5% of listings use it. Evaluate if potential revenue protection outweighs possible lower booking rates.
- Regularly review your cancellation policy against competitors and market demand shifts in Atuntaqui.
Atuntaqui STR Booking Lead Time Analysis (2026)
Average Booking Lead Time by Month
Booking Lead Time Insights for Atuntaqui
- The overall average booking lead time for vacation rentals in Atuntaqui is 14 days.
- Guests book furthest in advance for stays during January (average 39 days), likely coinciding with peak travel demand or local events.
- The shortest booking windows occur for stays in September (average 7 days), indicating more last-minute travel plans during this time.
- Seasonally, Winter (23 days avg.) sees the longest lead times, while Spring (8 days avg.) has the shortest, reflecting typical travel planning cycles.
Recommendations for Hosts
- Use the overall average lead time (14 days) as a baseline for your pricing and availability strategy in Atuntaqui.
- For January stays, consider implementing length-of-stay discounts or slightly higher rates for bookings made less than 39 days out to capitalize on advance planning.
- Target marketing efforts for the Winter season well in advance (at least 23 days) to capture early planners.
- Monitor your own booking lead times against these Atuntaqui averages to identify opportunities for dynamic pricing adjustments.
Popular & Essential Airbnb Amenities in Atuntaqui (2026)
Amenity Prevalence
Amenity Insights for Atuntaqui
- Essential amenities in Atuntaqui that guests expect include: Free parking on premises, Wifi. Lacking these (any) could significantly impact bookings.
- Popular amenities like Kitchen, Hot water, Pets allowed are common but not universal. Offering these can provide a competitive edge.
Recommendations for Hosts
- Ensure your listing includes all essential amenities for Atuntaqui: Free parking on premises, Wifi.
- Prioritize adding missing essentials: Free parking on premises, Wifi.
- Consider adding popular differentiators like Kitchen or Hot water to increase appeal.
- Highlight unique or less common amenities you offer (e.g., hot tub, dedicated workspace, EV charger) in your listing description and photos.
- Regularly check competitor amenities in Atuntaqui to stay competitive.
Atuntaqui Airbnb Guest Demographics & Profile Analysis (2026)
Guest Profile Summary for Atuntaqui
- The typical guest profile for Airbnb in Atuntaqui consists of primarily domestic travelers (84%), often arriving from nearby Quito, typically belonging to the Post-2000s (Gen Z/Alpha) group (50%), primarily speaking Spanish or English.
- Domestic travelers account for 84.1% of guests.
- Key international markets include Ecuador (84.1%) and United States (4.2%).
- Top languages spoken are Spanish (56.1%) followed by English (36.1%).
- A significant demographic segment is the Post-2000s (Gen Z/Alpha) group, representing 50% of guests.
Recommendations for Hosts
- Target domestic marketing efforts towards travelers from Quito and Ibarra.
- Tailor amenities and listing descriptions to appeal to the dominant Post-2000s (Gen Z/Alpha) demographic (e.g., highlight fast WiFi, smart home features, local guides).
- Highlight unique local experiences or amenities relevant to the primary guest profile.
- Consider seasonal promotions aligned with peak travel times for key origin markets.
Nearby Short-Term Rental Market Comparison
How does the Atuntaqui Airbnb market stack up against its neighbors? Compare key performance metrics like average monthly revenue, ADR, and occupancy rates in surrounding areas to understand the broader regional STR landscape.