Guayaquil Airbnb Market Analysis 2026: Short Term Rental Data & Vacation Rental Statistics in Guayas, Ecuador
Is Airbnb profitable in Guayaquil in 2026? Explore comprehensive Airbnb analytics for Guayaquil, Guayas, Ecuador to uncover income potential. This 2026 STR market report for Guayaquil, based on AirROI data from February 2025 to January 2026, reveals key trends in the bustling market of 1,604 active listings.
Whether you're considering an Airbnb investment in Guayaquil, optimizing your existing vacation rental, or exploring rental arbitrage opportunities, understanding the Guayaquil Airbnb data is crucial. Leveraging the low regulation environment is key to maximizing your short term rental income potential. Let's dive into the specifics.
Key Guayaquil Airbnb Performance Metrics Overview
Monthly Airbnb Revenue Variations & Income Potential in Guayaquil (2026)
Understanding the monthly revenue variations for Airbnb listings in Guayaquil is key to maximizing your short term rental income potential. Seasonality significantly impacts earnings. Our analysis, based on data from the past 12 months, shows that the peak revenue month for STRs in Guayaquil is typically August, while January often presents the lowest earnings, highlighting opportunities for strategic pricing adjustments during shoulder and low seasons. Explore the typical Airbnb income in Guayaquil across different performance tiers:
- Best-in-class properties (Top 10%) achieve $1,070+ monthly, often utilizing dynamic pricing and superior guest experiences.
- Strong performing properties (Top 25%) earn $623 or more, indicating effective management and desirable locations/amenities.
- Typical properties (Median) generate around $308 per month, representing the average market performance.
- Entry-level properties (Bottom 25%) see earnings around $131, often with potential for optimization.
Average Monthly Airbnb Earnings Trend in Guayaquil
Guayaquil Airbnb Occupancy Rate Trends (2026)
Maximize your bookings by understanding the Guayaquil STR occupancy trends. Seasonal demand shifts significantly influence how often properties are booked. Typically, Augustsees the highest demand (peak season occupancy), while January experiences the lowest (low season). Effective strategies, like adjusting minimum stays or offering promotions, can boost occupancy during slower periods. Here's how different property tiers perform in Guayaquil:
- Best-in-class properties (Top 10%) achieve 64%+ occupancy, indicating high desirability and potentially optimized availability.
- Strong performing properties (Top 25%) maintain 44% or higher occupancy, suggesting good market fit and guest satisfaction.
- Typical properties (Median) have an occupancy rate around 24%.
- Entry-level properties (Bottom 25%) average 11% occupancy, potentially facing higher vacancy.
Average Monthly Occupancy Rate Trend in Guayaquil
Average Daily Rate (ADR) Airbnb Trends in Guayaquil (2026)
Effective short term rental pricing strategy in Guayaquil involves understanding monthly ADR fluctuations. The Average Daily Rate (ADR) for Airbnb in Guayaquil typically peaks in June and dips lowest during September. Leveraging Airbnb dynamic pricing tools or strategies based on this seasonality can significantly boost revenue. Here's a look at the typical nightly rates achieved:
- Best-in-class properties (Top 10%) command rates of $86+ per night, often due to premium features or locations.
- Strong performing properties (Top 25%) achieve nightly rates of $63 or more.
- Typical properties (Median) charge around $44 per night.
- Entry-level properties (Bottom 25%) earn around $28 per night.
Average Daily Rate (ADR) Trend by Month in Guayaquil
Get Live Guayaquil Market Intelligence 👇

Explore Real-time Analytics
Airbnb Seasonality Analysis & Trends in Guayaquil (2026)
Peak Season (August, July, June)
- Revenue averages $504 per month
- Occupancy rates average 31.2%
- Daily rates average $52
Shoulder Season
- Revenue averages $465 per month
- Occupancy maintains around 30.3%
- Daily rates hold near $50
Low Season (January, May, November)
- Revenue drops to average $415 per month
- Occupancy decreases to average 26.9%
- Daily rates adjust to average $51
Seasonality Insights for Guayaquil
- The Airbnb seasonality in Guayaquil shows relatively stable year-round demand. While the sections above show seasonal averages, it's also insightful to look at the extremes:
- During the high season, the absolute peak month showcases Guayaquil's highest earning potential, with monthly revenues capable of climbing to $515, occupancy reaching a high of 32.3%, and ADRs peaking at $52.
- Conversely, the slowest single month of the year, typically falling within the low season, marks the market's lowest point. In this month, revenue might dip to $396, occupancy could drop to 25.5%, and ADRs may adjust down to $50.
- Understanding both the seasonal averages and these monthly peaks and troughs in revenue, occupancy, and ADR is crucial for maximizing your Airbnb profit potential in Guayaquil.
Seasonal Strategies for Maximizing Profit
- Peak Season: Maximize revenue through premium pricing and potentially longer minimum stays. Ensure high availability.
- Low Season: Offer competitive pricing, special promotions (e.g., extended stay discounts), and flexible cancellation policies. Target off-season travelers like remote workers or budget-conscious guests.
- Shoulder Seasons: Implement dynamic pricing that balances peak and low rates. Target weekend travelers or specific events. Offer slightly more flexible terms than peak season.
- Regularly analyze your own performance against these Guayaquil seasonality benchmarks and adjust your pricing and availability strategy accordingly.
Best Areas for Airbnb Investment in Guayaquil (2026)
Exploring the top neighborhoods for short-term rentals in Guayaquil? This section highlights key areas, outlining why they are attractive for hosts and guests, along with notable local attractions. Consider these locations based on your target guest profile and investment strategy.
| Neighborhood / Area | Why Host Here? (Target Guests & Appeal) | Key Attractions & Landmarks |
|---|---|---|
| Las Peñas | A historic neighborhood known for its colorful houses and artistic vibe. Attracts tourists for its cultural significance and beautiful views of the river and city. | Las Peñas Lighthouse, Art galleries, Cultural museums, Río Guayas promenade, San Salvador Hill |
| Downtown Guayaquil | The bustling heart of the city with many shops, restaurants, and attractions. Ideal for guests looking to explore the city's modern and colonial architecture. | Malecón 2000, Cerro Blanco Forest, Municipal Museum, National Police Museum, Cathedral of Guayaquil |
| Urdesa | A trendy, upscale neighborhood popular with locals and tourists. Known for its dining scene and vibrant nightlife, making it attractive for visitors seeking a lively experience. | Shopping malls, Local restaurants, Nightclubs, Parks, Cafes |
| Samborondón | An affluent suburb of Guayaquil, known for its residential areas and shopping centers. It offers a quieter experience while still being close to the city. | Riocentro Samborondón, Shopping malls, Parks, Cafes, Art galleries |
| Puerto Santa Ana | An emerging waterfront area that features modern architecture and entertainment options. Perfect for those looking for a contemporary and picturesque stay. | Santa Ana Riverwalk, Restaurants and bars, Boat tours, Contemporary art spaces, Nightlife |
| Las Malvinas | A residential neighborhood that offers a local experience with access to markets and eateries, ideal for those looking to explore everyday life in Guayaquil. | Local markets, Parks, Restaurants, Small shops, Cultural events |
| Ballenita | A coastal area near Guayaquil, popular for beach getaways. Attracts guests looking for relaxation and beachfront activities. | Beaches, Water sports, Local seafood restaurants, Sunset viewing, Coastal walks |
| Colón | A vibrant neighborhood known for its culture and diversity; offers a mix of modern and traditional experiences for visitors. | Local festivals, Cultural venues, Traditional markets, Art galleries, Theater performances |
Understanding Airbnb License Requirements & STR Laws in Guayaquil (2026)
While Guayaquil, Guayas, Ecuador currently shows low STR regulations, specific Airbnb license requirements might still exist or change. Always verify the latest short term rental regulations and Airbnb license requirements directly with local government authorities for Guayaquil to ensure full compliance before hosting.
(Source: AirROI data, 2026, based on 0% licensed listings)
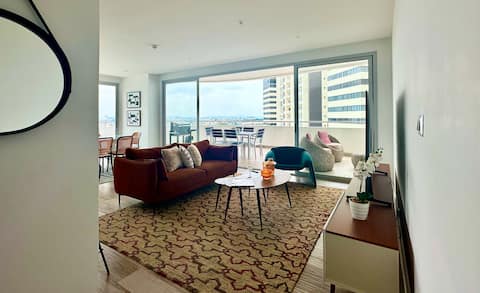
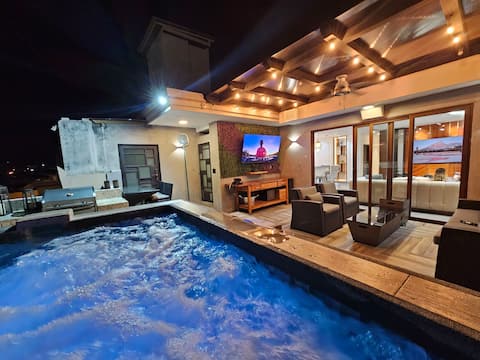
Top Performing Airbnb Properties in Guayaquil (2026)
Benchmark your potential! Explore examples of top-performing Airbnb properties in Guayaquilbased on Trailing Twelve Month (TTM) revenue. Analyze their characteristics, revenue, occupancy rate, and ADR to understand what drives success in this market.
Luxurious Escape @ Santana lofts
Entire Place • 3 bedrooms
Luxurious PH with private jacuzzi @Guayaquil
Entire Place • 3 bedrooms

C-24H Electricity,WIFI,Security+river & city views
Entire Place • 3 bedrooms

Urban Oasis | Corner City View
Entire Place • 2 bedrooms

Casa Pacífico Collection|Luxury Pearl
Entire Place • 2 bedrooms

Serena Bay | Lateral River View
Entire Place • 2 bedrooms
Note: Performance varies based on location, size, amenities, seasonality, and management quality. Data reflects the past 12 months.
Top Performing Airbnb Hosts in Guayaquil (2026)
Learn from the best! This table showcases top-performing Airbnb hosts in Guayaquil based on the number of properties managed and estimated total revenue over the past year. Analyze their scale and performance metrics.
| Host Name | Properties | Grossing Revenue | Stay Reviews | Avg Rating |
|---|---|---|---|---|
| Charlie | 18 | $205,904 | 1450 | 4.75/5.0 |
| Vanessa | 14 | $179,711 | 337 | 4.86/5.0 |
| Luis | 120 | $166,958 | 3792 | 4.45/5.0 |
| Jean Y Ana | 23 | $140,372 | 219 | 4.72/5.0 |
| Andres | 20 | $131,539 | 1450 | 4.72/5.0 |
| Mauro Jativa | 15 | $85,074 | 1030 | 4.85/5.0 |
| Fernando | 17 | $82,742 | 2337 | 4.86/5.0 |
| Ecusuites Com | 31 | $77,115 | 1202 | 4.39/5.0 |
| Antonio | 17 | $75,411 | 171 | 4.64/5.0 |
| Maria Grazzia | 12 | $74,247 | 852 | 4.74/5.0 |
Analyzing the strategies of top hosts, such as their property selection, pricing, and guest communication, can offer valuable lessons for optimizing your own Airbnb operations in Guayaquil.
Dive Deeper: Advanced Guayaquil STR Market Data (2026)
Ready to unlock more insights? AirROI provides access to advanced metrics and comprehensive Airbnb data for Guayaquil. Explore detailed analytics beyond this report to refine your investment strategy, optimize pricing, and maximize your vacation rental profits.
Explore Advanced MetricsGuayaquil Short-Term Rental Market Composition (2026): Property & Room Types
Room Type Distribution
Property Type Distribution
Market Composition Insights for Guayaquil
- The Guayaquil Airbnb market composition is heavily skewed towards Entire Home/Apt listings, which make up 79.1% of the 1,604 active rentals. This indicates strong guest preference for privacy and space.
- Looking at the property type distribution in Guayaquil, Apartment/Condo properties are the most common (81%), reflecting the local real estate landscape.
- Smaller segments like others, outdoor/unique (combined 2.3%) offer potential for unique stay experiences.
Guayaquil Airbnb Room Capacity Analysis (2026): Bedroom Distribution
Distribution of Listings by Number of Bedrooms
Room Capacity Insights for Guayaquil
- The dominant room capacity in Guayaquil is 1 bedroom listings, making up 50.6% of the market. This suggests a strong demand for properties suitable for couples or solo travelers.
- Together, 1 bedroom and 2 bedrooms properties represent 74.5% of the active Airbnb listings in Guayaquil, indicating a high concentration in these sizes.
- With over half the market (50.6%) consisting of studios or 1-bedroom units, Guayaquil is particularly well-suited for individuals or couples.
- Listings with 3+ bedrooms (7.6%) represent a smaller niche, potentially indicating an underserved market for larger group accommodations in Guayaquil.
Guayaquil Vacation Rental Guest Capacity Trends (2026)
Distribution of Listings by Guest Capacity
Guest Capacity Insights for Guayaquil
- The most common guest capacity trend in Guayaquil vacation rentals is listings accommodating 2 guests (25.9%). This suggests the primary traveler segment is likely couples or solo travelers.
- Properties designed for 2 guests and 4 guests dominate the Guayaquil STR market, accounting for 45.0% of listings.
- 16.9% of properties accommodate 6+ guests, serving the market segment for larger families or group travel in Guayaquil.
- On average, properties in Guayaquil are equipped to host 3.2 guests.
Guayaquil Airbnb Booking Patterns (2026): Available vs. Booked Days
Available Days Distribution
Booked Days Distribution
Booking Pattern Insights for Guayaquil
- The most common availability pattern in Guayaquil falls within the 271-366 days range, representing 71.1% of listings. This suggests many properties have significant open periods on their calendars.
- Approximately 94.9% of listings show high availability (181+ days open annually), indicating potential for increased bookings or specific owner usage patterns.
- For booked days, the 31-90 days range is most frequent in Guayaquil (37.3%), reflecting common guest stay durations or potential owner blocking patterns.
- A notable 5.6% of properties secure long booking periods (181+ days booked per year), highlighting successful long-term rental strategies or significant owner usage.
Guayaquil Airbnb Minimum Stay Requirements Analysis
Distribution of Listings by Minimum Night Requirement
1 Night
1171 listings
73% of total
2 Nights
231 listings
14.4% of total
3 Nights
51 listings
3.2% of total
4-6 Nights
19 listings
1.2% of total
7-29 Nights
13 listings
0.8% of total
30+ Nights
119 listings
7.4% of total
Key Insights
- The most prevalent minimum stay requirement in Guayaquil is 1 Night, adopted by 73% of listings. This highlights the market's preference for shorter, flexible bookings.
- A strong majority (87.4%) of the Guayaquil Airbnb data shows acceptance of very short stays (1-2 nights), indicating a dynamic, high-turnover market.
Recommendations
- Align with the market by considering a 1 Night minimum stay, as 73% of Guayaquil hosts use this setting.
- Explore offering discounts for stays of 30+ nights to attract the 7.4% of the market seeking extended stays.
- Adjust minimum nights based on seasonality – potentially shorter during low season and longer during peak demand periods in Guayaquil.
Guayaquil Airbnb Cancellation Policy Trends Analysis (2026)
Limited
16 listings
1% of total
Flexible
742 listings
46.4% of total
Moderate
483 listings
30.2% of total
Firm
244 listings
15.3% of total
Strict
113 listings
7.1% of total
Cancellation Policy Insights for Guayaquil
- The prevailing Airbnb cancellation policy trend in Guayaquil is Flexible, used by 46.4% of listings.
- The market strongly favors guest-friendly terms, with 76.6% of listings offering Flexible or Moderate policies. This suggests guests in Guayaquil may expect booking flexibility.
- Strict cancellation policies are quite rare (7.1%), potentially making listings with this policy less competitive unless justified by high demand or property type.
Recommendations for Hosts
- Consider adopting a Flexible policy to align with the 46.4% market standard in Guayaquil.
- Using a Strict policy might deter some guests, as only 7.1% of listings use it. Evaluate if potential revenue protection outweighs possible lower booking rates.
- Regularly review your cancellation policy against competitors and market demand shifts in Guayaquil.
Guayaquil STR Booking Lead Time Analysis (2026)
Average Booking Lead Time by Month
Booking Lead Time Insights for Guayaquil
- The overall average booking lead time for vacation rentals in Guayaquil is 10 days.
- Guests book furthest in advance for stays during January (average 14 days), likely coinciding with peak travel demand or local events.
- The shortest booking windows occur for stays in June (average 6 days), indicating more last-minute travel plans during this time.
- Seasonally, Winter (11 days avg.) sees the longest lead times, while Spring (8 days avg.) has the shortest, reflecting typical travel planning cycles.
Recommendations for Hosts
- Use the overall average lead time (10 days) as a baseline for your pricing and availability strategy in Guayaquil.
- Target marketing efforts for the Winter season well in advance (at least 11 days) to capture early planners.
- Monitor your own booking lead times against these Guayaquil averages to identify opportunities for dynamic pricing adjustments.
Popular & Essential Airbnb Amenities in Guayaquil (2026)
Amenity Prevalence
Amenity Insights for Guayaquil
- Essential amenities in Guayaquil that guests expect include: Wifi, Air conditioning, TV. Lacking these (any) could significantly impact bookings.
- Popular amenities like Kitchen, Dishes and silverware, Cooking basics are common but not universal. Offering these can provide a competitive edge.
Recommendations for Hosts
- Ensure your listing includes all essential amenities for Guayaquil: Wifi, Air conditioning, TV.
- Prioritize adding missing essentials: Wifi, Air conditioning, TV.
- Consider adding popular differentiators like Kitchen or Dishes and silverware to increase appeal.
- Highlight unique or less common amenities you offer (e.g., hot tub, dedicated workspace, EV charger) in your listing description and photos.
- Regularly check competitor amenities in Guayaquil to stay competitive.
Guayaquil Airbnb Guest Demographics & Profile Analysis (2026)
Guest Profile Summary for Guayaquil
- The typical guest profile for Airbnb in Guayaquil consists of primarily domestic travelers (75%), often arriving from nearby Guayaquil, typically belonging to the Post-2000s (Gen Z/Alpha) group (50%), primarily speaking Spanish or English.
- Domestic travelers account for 74.5% of guests.
- Key international markets include Ecuador (74.5%) and United States (13.5%).
- Top languages spoken are Spanish (55.6%) followed by English (33.6%).
- A significant demographic segment is the Post-2000s (Gen Z/Alpha) group, representing 50% of guests.
Recommendations for Hosts
- Target domestic marketing efforts towards travelers from Guayaquil and Quito.
- Tailor amenities and listing descriptions to appeal to the dominant Post-2000s (Gen Z/Alpha) demographic (e.g., highlight fast WiFi, smart home features, local guides).
- Highlight unique local experiences or amenities relevant to the primary guest profile.
- Consider seasonal promotions aligned with peak travel times for key origin markets.
Nearby Short-Term Rental Market Comparison
How does the Guayaquil Airbnb market stack up against its neighbors? Compare key performance metrics like average monthly revenue, ADR, and occupancy rates in surrounding areas to understand the broader regional STR landscape.
| Market | Active Properties | Monthly Revenue | Daily Rate | Avg. Occupancy |
|---|---|---|---|---|
| Curia | 30 | $1,454 | $243.84 | 22% |
| District of Canoas de Punta Sal | 196 | $1,096 | $203.77 | 23% |
| Parroquia Manglaralto | 26 | $1,076 | $204.86 | 20% |
| La Entrada | 38 | $968 | $203.21 | 26% |
| Sayausi | 14 | $951 | $175.56 | 19% |
| La Unión | 16 | $896 | $135.56 | 23% |
| Ayangue | 58 | $861 | $150.30 | 18% |
| District of Zorritos | 245 | $685 | $152.69 | 21% |
| Santa Isabel | 24 | $651 | $178.12 | 17% |
| Olón | 178 | $623 | $144.07 | 22% |