General Villamil Playas Airbnb Market Analysis 2026: Short Term Rental Data & Vacation Rental Statistics in Guayas, Ecuador
Is Airbnb profitable in General Villamil Playas in 2026? Explore comprehensive Airbnb analytics for General Villamil Playas, Guayas, Ecuador to uncover income potential. This 2026 STR market report for General Villamil Playas, based on AirROI data from February 2025 to January 2026, reveals key trends in the market of 381 active listings.
Whether you're considering an Airbnb investment in General Villamil Playas, optimizing your existing vacation rental, or exploring rental arbitrage opportunities, understanding the General Villamil Playas Airbnb data is crucial. Leveraging the low regulation environment is key to maximizing your short term rental income potential. Let's dive into the specifics.
Key General Villamil Playas Airbnb Performance Metrics Overview
Monthly Airbnb Revenue Variations & Income Potential in General Villamil Playas (2026)
Understanding the monthly revenue variations for Airbnb listings in General Villamil Playas is key to maximizing your short term rental income potential. Seasonality significantly impacts earnings. Our analysis, based on data from the past 12 months, shows that the peak revenue month for STRs in General Villamil Playas is typically March, while September often presents the lowest earnings, highlighting opportunities for strategic pricing adjustments during shoulder and low seasons. Explore the typical Airbnb income in General Villamil Playas across different performance tiers:
- Best-in-class properties (Top 10%) achieve $1,448+ monthly, often utilizing dynamic pricing and superior guest experiences.
- Strong performing properties (Top 25%) earn $773 or more, indicating effective management and desirable locations/amenities.
- Typical properties (Median) generate around $345 per month, representing the average market performance.
- Entry-level properties (Bottom 25%) see earnings around $166, often with potential for optimization.
Average Monthly Airbnb Earnings Trend in General Villamil Playas
General Villamil Playas Airbnb Occupancy Rate Trends (2026)
Maximize your bookings by understanding the General Villamil Playas STR occupancy trends. Seasonal demand shifts significantly influence how often properties are booked. Typically, Marchsees the highest demand (peak season occupancy), while December experiences the lowest (low season). Effective strategies, like adjusting minimum stays or offering promotions, can boost occupancy during slower periods. Here's how different property tiers perform in General Villamil Playas:
- Best-in-class properties (Top 10%) achieve 32%+ occupancy, indicating high desirability and potentially optimized availability.
- Strong performing properties (Top 25%) maintain 21% or higher occupancy, suggesting good market fit and guest satisfaction.
- Typical properties (Median) have an occupancy rate around 12%.
- Entry-level properties (Bottom 25%) average 5% occupancy, potentially facing higher vacancy.
Average Monthly Occupancy Rate Trend in General Villamil Playas
Average Daily Rate (ADR) Airbnb Trends in General Villamil Playas (2026)
Effective short term rental pricing strategy in General Villamil Playas involves understanding monthly ADR fluctuations. The Average Daily Rate (ADR) for Airbnb in General Villamil Playas typically peaks in June and dips lowest during November. Leveraging Airbnb dynamic pricing tools or strategies based on this seasonality can significantly boost revenue. Here's a look at the typical nightly rates achieved:
- Best-in-class properties (Top 10%) command rates of $237+ per night, often due to premium features or locations.
- Strong performing properties (Top 25%) achieve nightly rates of $150 or more.
- Typical properties (Median) charge around $101 per night.
- Entry-level properties (Bottom 25%) earn around $64 per night.
Average Daily Rate (ADR) Trend by Month in General Villamil Playas
Get Live General Villamil Playas Market Intelligence 👇

Explore Real-time Analytics
Airbnb Seasonality Analysis & Trends in General Villamil Playas (2026)
Peak Season (March, February, August)
- Revenue averages $827 per month
- Occupancy rates average 20.2%
- Daily rates average $122
Shoulder Season
- Revenue averages $569 per month
- Occupancy maintains around 14.3%
- Daily rates hold near $122
Low Season (September, October, December)
- Revenue drops to average $463 per month
- Occupancy decreases to average 12.1%
- Daily rates adjust to average $120
Seasonality Insights for General Villamil Playas
- The Airbnb seasonality in General Villamil Playas shows highly seasonal trends requiring careful strategy. While the sections above show seasonal averages, it's also insightful to look at the extremes:
- During the high season, the absolute peak month showcases General Villamil Playas's highest earning potential, with monthly revenues capable of climbing to $992, occupancy reaching a high of 23.1%, and ADRs peaking at $124.
- Conversely, the slowest single month of the year, typically falling within the low season, marks the market's lowest point. In this month, revenue might dip to $451, occupancy could drop to 10.7%, and ADRs may adjust down to $119.
- Understanding both the seasonal averages and these monthly peaks and troughs in revenue, occupancy, and ADR is crucial for maximizing your Airbnb profit potential in General Villamil Playas.
Seasonal Strategies for Maximizing Profit
- Peak Season: Maximize revenue through premium pricing and potentially longer minimum stays. Ensure high availability.
- Low Season: Offer competitive pricing, special promotions (e.g., extended stay discounts), and flexible cancellation policies. Target off-season travelers like remote workers or budget-conscious guests.
- Shoulder Seasons: Implement dynamic pricing that balances peak and low rates. Target weekend travelers or specific events. Offer slightly more flexible terms than peak season.
- Regularly analyze your own performance against these General Villamil Playas seasonality benchmarks and adjust your pricing and availability strategy accordingly.
Best Areas for Airbnb Investment in General Villamil Playas (2026)
Exploring the top neighborhoods for short-term rentals in General Villamil Playas? This section highlights key areas, outlining why they are attractive for hosts and guests, along with notable local attractions. Consider these locations based on your target guest profile and investment strategy.
| Neighborhood / Area | Why Host Here? (Target Guests & Appeal) | Key Attractions & Landmarks |
|---|---|---|
| Playa General Villamil | Main beach area known for its beautiful coastline and relaxed atmosphere. Popular for vacationers looking to enjoy sun and water activities. | General Villamil Beach, El Puerto Shopping Mall, Water sports activities, Beachfront restaurants, Local seafood markets |
| Malecon de Playas | The boardwalk area with great views of the ocean, restaurants, and entertainment. A hub for tourists and locals alike. | Malecon promenade, Oceanview dining, Open-air concerts, Artisan markets, Playas nightlife |
| Playa de los Cangrejos | A quieter beach area perfect for families and those seeking a more tranquil beach experience. | Quiet beaches, Family-friendly atmosphere, Local beach bars, Natural scenery, Fishing spots |
| El Divino Niño | A popular residential area close to the beach, offering various accommodation options and community vibe. | Local eateries, Community events, Access to beach activities, Nearby parks, Cultural experiences |
| La Malecon 2000 | Though a bit further, this area offers a vibrant promenade and is ideal for weekend getaways with its many attractions. | Shopping and dining, Ocean activities, Cultural sites, Weekend markets, Nightlife spots |
| San Vicente | A residential neighborhood close to the main attractions, offering both convenience and a local feel. | Local markets, Community parks, Access to public transport, Dining options nearby, Cultural interactions |
| Playas el Salado | A serene area known for its natural beauty, ideal for travelers looking to escape the crowds. | Natural scenery, Clam digging, Local fishing, Peaceful beaches, Bird watching |
| Pueblo de Playas | The main town area offering a mix of local culture, shops, and proximity to the beach. | Local shops, Cultural festivals, Street food, Craft markets, Access to beach activities |
Understanding Airbnb License Requirements & STR Laws in General Villamil Playas (2026)
While General Villamil Playas, Guayas, Ecuador currently shows low STR regulations, specific Airbnb license requirements might still exist or change. Always verify the latest short term rental regulations and Airbnb license requirements directly with local government authorities for General Villamil Playas to ensure full compliance before hosting.
(Source: AirROI data, 2026, based on 0% licensed listings)
Top Performing Airbnb Properties in General Villamil Playas (2026)
Benchmark your potential! Explore examples of top-performing Airbnb properties in General Villamil Playasbased on Trailing Twelve Month (TTM) revenue. Analyze their characteristics, revenue, occupancy rate, and ADR to understand what drives success in this market.
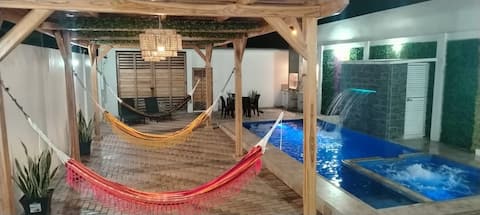
House with a swimming pool and beach access
Entire Place • 3 bedrooms
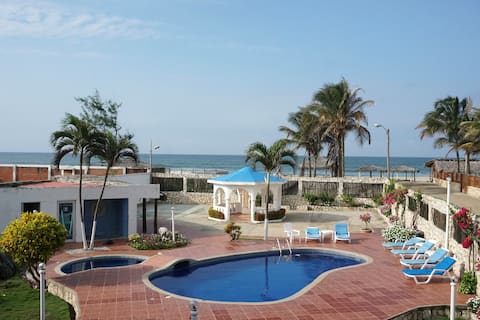
SoleMare Data Beach House
Entire Place • 8 bedrooms

Casa Leon up to 18 people
Entire Place • 2 bedrooms

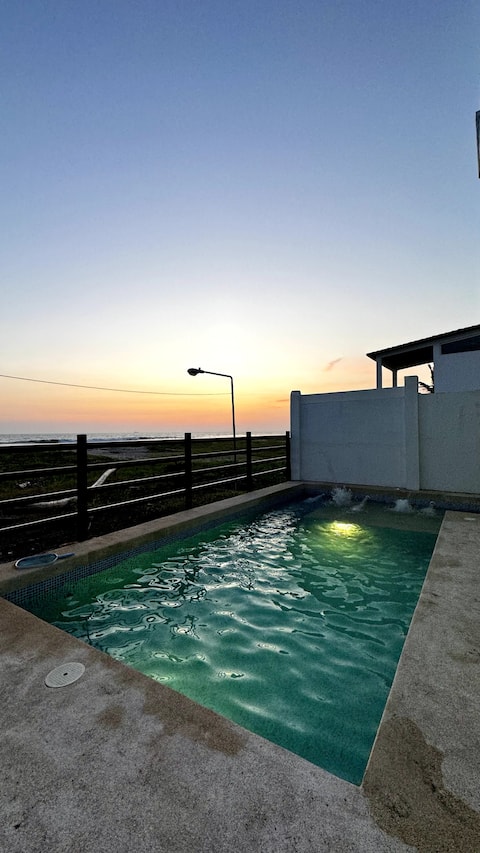
Pool, Jacuzzi, Grill, A/C - Villa Puerta Azul
Entire Place • 6 bedrooms
La Carmelita
Entire Place • 5 bedrooms

Harmony beach house Platinum / 4 Bedrooms
Entire Place • 4 bedrooms
Note: Performance varies based on location, size, amenities, seasonality, and management quality. Data reflects the past 12 months.
Top Performing Airbnb Hosts in General Villamil Playas (2026)
Learn from the best! This table showcases top-performing Airbnb hosts in General Villamil Playas based on the number of properties managed and estimated total revenue over the past year. Analyze their scale and performance metrics.
| Host Name | Properties | Grossing Revenue | Stay Reviews | Avg Rating |
|---|---|---|---|---|
| Luis | 8 | $52,329 | 57 | 4.69/5.0 |
| Lorena A. Franco | 2 | $41,658 | 367 | 4.99/5.0 |
| Omar | 2 | $39,514 | 21 | 4.58/5.0 |
| Victor Astudillo | 1 | $38,149 | 48 | 4.94/5.0 |
| Emily | 3 | $37,421 | 58 | 4.78/5.0 |
| Rodolfo | 2 | $36,623 | 3 | Not Rated |
| Estefania | 12 | $35,452 | 720 | 4.58/5.0 |
| Karen | 1 | $33,922 | 1 | Not Rated |
| Angela Gissela Leon Osorio | 1 | $33,209 | 14 | 5.00/5.0 |
| Jaime Francisco | 4 | $32,845 | 99 | 4.79/5.0 |
Analyzing the strategies of top hosts, such as their property selection, pricing, and guest communication, can offer valuable lessons for optimizing your own Airbnb operations in General Villamil Playas.
Dive Deeper: Advanced General Villamil Playas STR Market Data (2026)
Ready to unlock more insights? AirROI provides access to advanced metrics and comprehensive Airbnb data for General Villamil Playas. Explore detailed analytics beyond this report to refine your investment strategy, optimize pricing, and maximize your vacation rental profits.
Explore Advanced MetricsGeneral Villamil Playas Short-Term Rental Market Composition (2026): Property & Room Types
Room Type Distribution
Property Type Distribution
Market Composition Insights for General Villamil Playas
- The General Villamil Playas Airbnb market composition is heavily skewed towards Entire Home/Apt listings, which make up 85% of the 381 active rentals. This indicates strong guest preference for privacy and space.
- Looking at the property type distribution in General Villamil Playas, House properties are the most common (45.9%), reflecting the local real estate landscape.
- Houses represent a significant 45.9% portion, catering likely to families or larger groups.
- The presence of 7.6% Hotel/Boutique listings indicates integration with traditional hospitality.
- Smaller segments like others, outdoor/unique (combined 5.5%) offer potential for unique stay experiences.
General Villamil Playas Airbnb Room Capacity Analysis (2026): Bedroom Distribution
Distribution of Listings by Number of Bedrooms
Room Capacity Insights for General Villamil Playas
- The dominant room capacity in General Villamil Playas is 3 bedrooms listings, making up 36.7% of the market. This suggests a strong demand for properties suitable for families or small groups.
- Together, 3 bedrooms and 1 bedroom properties represent 55.9% of the active Airbnb listings in General Villamil Playas, indicating a high concentration in these sizes.
- A significant 53.7% of listings offer 3+ bedrooms, catering to larger groups and families seeking more space in General Villamil Playas.
General Villamil Playas Vacation Rental Guest Capacity Trends (2026)
Distribution of Listings by Guest Capacity
Guest Capacity Insights for General Villamil Playas
- The most common guest capacity trend in General Villamil Playas vacation rentals is listings accommodating 8+ guests (41.7%). This suggests the primary traveler segment is likely larger groups.
- Properties designed for 8+ guests and 6 guests dominate the General Villamil Playas STR market, accounting for 58.2% of listings.
- 65.5% of properties accommodate 6+ guests, serving the market segment for larger families or group travel in General Villamil Playas.
- On average, properties in General Villamil Playas are equipped to host 5.9 guests.
General Villamil Playas Airbnb Booking Patterns (2026): Available vs. Booked Days
Available Days Distribution
Booked Days Distribution
Booking Pattern Insights for General Villamil Playas
- The most common availability pattern in General Villamil Playas falls within the 271-366 days range, representing 94% of listings. This suggests many properties have significant open periods on their calendars.
- Approximately 100.0% of listings show high availability (181+ days open annually), indicating potential for increased bookings or specific owner usage patterns.
- For booked days, the 1-30 days range is most frequent in General Villamil Playas (60.9%), reflecting common guest stay durations or potential owner blocking patterns.
General Villamil Playas Airbnb Minimum Stay Requirements Analysis
Distribution of Listings by Minimum Night Requirement
1 Night
293 listings
76.9% of total
2 Nights
46 listings
12.1% of total
3 Nights
3 listings
0.8% of total
4-6 Nights
6 listings
1.6% of total
30+ Nights
33 listings
8.7% of total
Key Insights
- The most prevalent minimum stay requirement in General Villamil Playas is 1 Night, adopted by 76.9% of listings. This highlights the market's preference for shorter, flexible bookings.
- A strong majority (89.0%) of the General Villamil Playas Airbnb data shows acceptance of very short stays (1-2 nights), indicating a dynamic, high-turnover market.
Recommendations
- Align with the market by considering a 1 Night minimum stay, as 76.9% of General Villamil Playas hosts use this setting.
- Explore offering discounts for stays of 30+ nights to attract the 8.7% of the market seeking extended stays.
- Adjust minimum nights based on seasonality – potentially shorter during low season and longer during peak demand periods in General Villamil Playas.
General Villamil Playas Airbnb Cancellation Policy Trends Analysis (2026)
Limited
8 listings
2.1% of total
Flexible
140 listings
36.8% of total
Moderate
130 listings
34.2% of total
Firm
86 listings
22.6% of total
Strict
16 listings
4.2% of total
Cancellation Policy Insights for General Villamil Playas
- The prevailing Airbnb cancellation policy trend in General Villamil Playas is Flexible, used by 36.8% of listings.
- The market strongly favors guest-friendly terms, with 71.0% of listings offering Flexible or Moderate policies. This suggests guests in General Villamil Playas may expect booking flexibility.
- Strict cancellation policies are quite rare (4.2%), potentially making listings with this policy less competitive unless justified by high demand or property type.
Recommendations for Hosts
- Consider adopting a Flexible policy to align with the 36.8% market standard in General Villamil Playas.
- Using a Strict policy might deter some guests, as only 4.2% of listings use it. Evaluate if potential revenue protection outweighs possible lower booking rates.
- Regularly review your cancellation policy against competitors and market demand shifts in General Villamil Playas.
General Villamil Playas STR Booking Lead Time Analysis (2026)
Average Booking Lead Time by Month
Booking Lead Time Insights for General Villamil Playas
- The overall average booking lead time for vacation rentals in General Villamil Playas is 18 days.
- Guests book furthest in advance for stays during December (average 41 days), likely coinciding with peak travel demand or local events.
- The shortest booking windows occur for stays in June (average 11 days), indicating more last-minute travel plans during this time.
- Seasonally, Winter (24 days avg.) sees the longest lead times, while Spring (17 days avg.) has the shortest, reflecting typical travel planning cycles.
Recommendations for Hosts
- Use the overall average lead time (18 days) as a baseline for your pricing and availability strategy in General Villamil Playas.
- For December stays, consider implementing length-of-stay discounts or slightly higher rates for bookings made less than 41 days out to capitalize on advance planning.
- Target marketing efforts for the Winter season well in advance (at least 24 days) to capture early planners.
- Monitor your own booking lead times against these General Villamil Playas averages to identify opportunities for dynamic pricing adjustments.
Popular & Essential Airbnb Amenities in General Villamil Playas (2026)
Amenity Prevalence
Amenity Insights for General Villamil Playas
- Essential amenities in General Villamil Playas that guests expect include: Wifi. Lacking these (this) could significantly impact bookings.
- Popular amenities like Free parking on premises, Air conditioning, TV are common but not universal. Offering these can provide a competitive edge.
- A pool is a highly desired but not standard amenity, making it a key feature for attracting guests seeking leisure in General Villamil Playas.
Recommendations for Hosts
- Ensure your listing includes all essential amenities for General Villamil Playas: Wifi.
- Prioritize adding missing essentials: Wifi.
- Consider adding popular differentiators like Free parking on premises or Air conditioning to increase appeal.
- Highlight unique or less common amenities you offer (e.g., hot tub, dedicated workspace, EV charger) in your listing description and photos.
- Regularly check competitor amenities in General Villamil Playas to stay competitive.
General Villamil Playas Airbnb Guest Demographics & Profile Analysis (2026)
Guest Profile Summary for General Villamil Playas
- The typical guest profile for Airbnb in General Villamil Playas consists of primarily domestic travelers (91%), often arriving from nearby Guayaquil, typically belonging to the Post-2000s (Gen Z/Alpha) group (50%), primarily speaking Spanish or English.
- Domestic travelers account for 91.0% of guests.
- Key international markets include Ecuador (91%) and United States (4.8%).
- Top languages spoken are Spanish (62.1%) followed by English (31.1%).
- A significant demographic segment is the Post-2000s (Gen Z/Alpha) group, representing 50% of guests.
Recommendations for Hosts
- Target domestic marketing efforts towards travelers from Guayaquil and Quito.
- Tailor amenities and listing descriptions to appeal to the dominant Post-2000s (Gen Z/Alpha) demographic (e.g., highlight fast WiFi, smart home features, local guides).
- Highlight unique local experiences or amenities relevant to the primary guest profile.
- Consider seasonal promotions aligned with peak travel times for key origin markets.
Nearby Short-Term Rental Market Comparison
How does the General Villamil Playas Airbnb market stack up against its neighbors? Compare key performance metrics like average monthly revenue, ADR, and occupancy rates in surrounding areas to understand the broader regional STR landscape.
| Market | Active Properties | Monthly Revenue | Daily Rate | Avg. Occupancy |
|---|---|---|---|---|
| Curia | 30 | $1,454 | $243.84 | 22% |
| District of Canoas de Punta Sal | 196 | $1,096 | $203.77 | 23% |
| Parroquia Manglaralto | 26 | $1,076 | $204.86 | 20% |
| La Entrada | 38 | $968 | $203.21 | 26% |
| Sayausi | 14 | $951 | $175.56 | 19% |
| La Unión | 16 | $896 | $135.56 | 23% |
| Ayangue | 58 | $861 | $150.30 | 18% |
| District of Zorritos | 245 | $685 | $152.69 | 21% |
| Santa Isabel | 24 | $651 | $178.12 | 17% |
| Olón | 178 | $623 | $144.07 | 22% |