Turi Airbnb Market Analysis 2026: Short Term Rental Data & Vacation Rental Statistics in Azuay, Ecuador
Is Airbnb profitable in Turi in 2026? Explore comprehensive Airbnb analytics for Turi, Azuay, Ecuador to uncover income potential. This 2026 STR market report for Turi, based on AirROI data from February 2025 to January 2026, reveals key trends in the niche market of 22 active listings.
Whether you're considering an Airbnb investment in Turi, optimizing your existing vacation rental, or exploring rental arbitrage opportunities, understanding the Turi Airbnb data is crucial. Leveraging the low regulation environment is key to maximizing your short term rental income potential. Let's dive into the specifics.
Key Turi Airbnb Performance Metrics Overview
Monthly Airbnb Revenue Variations & Income Potential in Turi (2026)
Understanding the monthly revenue variations for Airbnb listings in Turi is key to maximizing your short term rental income potential. Seasonality significantly impacts earnings. Our analysis, based on data from the past 12 months, shows that the peak revenue month for STRs in Turi is typically August, while June often presents the lowest earnings, highlighting opportunities for strategic pricing adjustments during shoulder and low seasons. Explore the typical Airbnb income in Turi across different performance tiers:
- Best-in-class properties (Top 10%) achieve $1,160+ monthly, often utilizing dynamic pricing and superior guest experiences.
- Strong performing properties (Top 25%) earn $704 or more, indicating effective management and desirable locations/amenities.
- Typical properties (Median) generate around $438 per month, representing the average market performance.
- Entry-level properties (Bottom 25%) see earnings around $226, often with potential for optimization.
Average Monthly Airbnb Earnings Trend in Turi
Turi Airbnb Occupancy Rate Trends (2026)
Maximize your bookings by understanding the Turi STR occupancy trends. Seasonal demand shifts significantly influence how often properties are booked. Typically, Augustsees the highest demand (peak season occupancy), while June experiences the lowest (low season). Effective strategies, like adjusting minimum stays or offering promotions, can boost occupancy during slower periods. Here's how different property tiers perform in Turi:
- Best-in-class properties (Top 10%) achieve 47%+ occupancy, indicating high desirability and potentially optimized availability.
- Strong performing properties (Top 25%) maintain 33% or higher occupancy, suggesting good market fit and guest satisfaction.
- Typical properties (Median) have an occupancy rate around 21%.
- Entry-level properties (Bottom 25%) average 14% occupancy, potentially facing higher vacancy.
Average Monthly Occupancy Rate Trend in Turi
Average Daily Rate (ADR) Airbnb Trends in Turi (2026)
Effective short term rental pricing strategy in Turi involves understanding monthly ADR fluctuations. The Average Daily Rate (ADR) for Airbnb in Turi typically peaks in February and dips lowest during September. Leveraging Airbnb dynamic pricing tools or strategies based on this seasonality can significantly boost revenue. Here's a look at the typical nightly rates achieved:
- Best-in-class properties (Top 10%) command rates of $121+ per night, often due to premium features or locations.
- Strong performing properties (Top 25%) achieve nightly rates of $92 or more.
- Typical properties (Median) charge around $42 per night.
- Entry-level properties (Bottom 25%) earn around $29 per night.
Average Daily Rate (ADR) Trend by Month in Turi
Get Live Turi Market Intelligence 👇

Explore Real-time Analytics
Airbnb Seasonality Analysis & Trends in Turi (2026)
Peak Season (August, December, October)
- Revenue averages $708 per month
- Occupancy rates average 31.9%
- Daily rates average $54
Shoulder Season
- Revenue averages $526 per month
- Occupancy maintains around 23.9%
- Daily rates hold near $61
Low Season (March, June, September)
- Revenue drops to average $397 per month
- Occupancy decreases to average 19.3%
- Daily rates adjust to average $57
Seasonality Insights for Turi
- The Airbnb seasonality in Turi shows highly seasonal trends requiring careful strategy. While the sections above show seasonal averages, it's also insightful to look at the extremes:
- During the high season, the absolute peak month showcases Turi's highest earning potential, with monthly revenues capable of climbing to $954, occupancy reaching a high of 41.4%, and ADRs peaking at $66.
- Conversely, the slowest single month of the year, typically falling within the low season, marks the market's lowest point. In this month, revenue might dip to $334, occupancy could drop to 15.2%, and ADRs may adjust down to $52.
- Understanding both the seasonal averages and these monthly peaks and troughs in revenue, occupancy, and ADR is crucial for maximizing your Airbnb profit potential in Turi.
Seasonal Strategies for Maximizing Profit
- Peak Season: Maximize revenue through premium pricing and potentially longer minimum stays. Ensure high availability.
- Low Season: Offer competitive pricing, special promotions (e.g., extended stay discounts), and flexible cancellation policies. Target off-season travelers like remote workers or budget-conscious guests.
- Shoulder Seasons: Implement dynamic pricing that balances peak and low rates. Target weekend travelers or specific events. Offer slightly more flexible terms than peak season.
- Regularly analyze your own performance against these Turi seasonality benchmarks and adjust your pricing and availability strategy accordingly.
Best Areas for Airbnb Investment in Turi (2026)
Exploring the top neighborhoods for short-term rentals in Turi? This section highlights key areas, outlining why they are attractive for hosts and guests, along with notable local attractions. Consider these locations based on your target guest profile and investment strategy.
| Neighborhood / Area | Why Host Here? (Target Guests & Appeal) | Key Attractions & Landmarks |
|---|---|---|
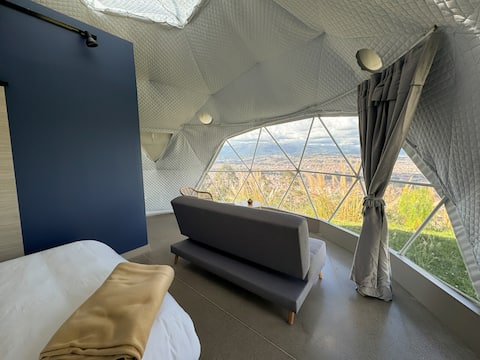
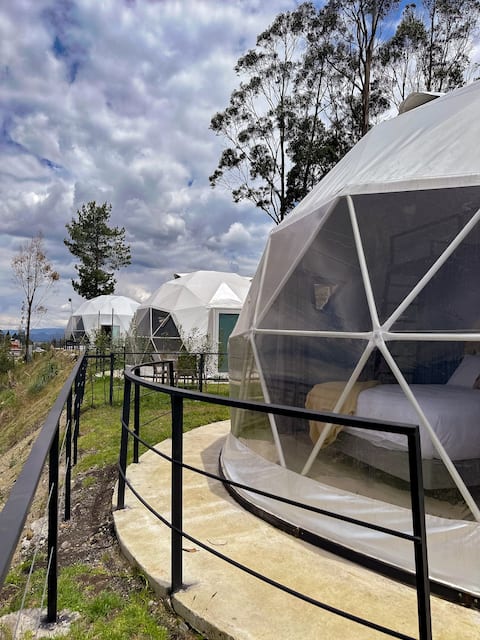
| Turi | A picturesque hilltop neighborhood known for its panoramic views of Cuenca and its charming atmosphere. Popular among tourists seeking tranquility and scenic experiences away from the bustling city center. | Mirador de Turi, Turi Church, Cuenca City Views, Local artisan shops, Ecuadorian cuisine restaurants |
| El Cajas National Park | Stunning national park known for its beautiful lakes, hiking trails, and biodiversity. It attracts nature lovers and adventure seekers looking for outdoor activities. | Laguna La Toreadora, Hiking trails, Wildlife viewing, Camping sites, Scenic landscapes |
| Baños | A popular town known for its hot springs and adventure sports, it’s a hotspot for tourists looking for relaxation and thrilling activities in nature. | Hot springs, Waterfall tours, Biking, Rafting, Adventure sports hubs |
| Chordeleg | Famous for its artisan jewelry and traditional crafts, this small town attracts visitors interested in Ecuadorian culture and craftsmanship. | Jewelry shops, Craft markets, Local museums, Cultural festivals |
| Gualaceo | Known for its agricultural landscapes and traditional markets, it offers a taste of local life and culture, drawing tourists who want an authentic experience. | Gualaceo Market, Traditional food, Cultural experiences, Floral gardens, Coffee farms |
| Sigsig | A quaint town known for its heritage and the production of traditional handicrafts, popular among those interested in local history and culture. | Sigsig Market, Handicraft workshops, Local customs, Traditional Ecuadorian dishes |
| El Vergel | A tranquil natural setting perfect for relaxation, known for its warm climate and beautiful landscapes, drawing visitors looking for quiet escapes. | Gardens, Botanical parks, Nature walks, Bird watching |
| Cuenca City Center | The historical center of Cuenca is rich in culture and history, a UNESCO World Heritage site attracting tourists exploring Ecuador's colonial past. | Casa de La Cultura, Parque Calderon, Cathedral of Cuenca, Local artisans, Cultural events |
Understanding Airbnb License Requirements & STR Laws in Turi (2026)
While Turi, Azuay, Ecuador currently shows low STR regulations, specific Airbnb license requirements might still exist or change. Always verify the latest short term rental regulations and Airbnb license requirements directly with local government authorities for Turi to ensure full compliance before hosting.
(Source: AirROI data, 2026, finding no licensed listings among those analyzed)
Top Performing Airbnb Properties in Turi (2026)
Benchmark your potential! Explore examples of top-performing Airbnb properties in Turibased on Trailing Twelve Month (TTM) revenue. Analyze their characteristics, revenue, occupancy rate, and ADR to understand what drives success in this market.

Naturhotel Full Experience: Room 2
Entire Place • 1 bedroom

Turi, tranquility of the countryside in the city
Entire Place • 4 bedrooms
Naturhotel Experience 5
Entire Place • 1 bedroom
Naturhotel Full Experience: Room 1
Entire Place • 1 bedroom

Naturhotel Experience 1
Private Room • 1 bedroom

Naturhotel Experience 3
Private Room • 1 bedroom
Note: Performance varies based on location, size, amenities, seasonality, and management quality. Data reflects the past 12 months.
Top Performing Airbnb Hosts in Turi (2026)
Learn from the best! This table showcases top-performing Airbnb hosts in Turi based on the number of properties managed and estimated total revenue over the past year. Analyze their scale and performance metrics.
| Host Name | Properties | Grossing Revenue | Stay Reviews | Avg Rating |
|---|---|---|---|---|
| Tomas | 6 | $55,526 | 32 | 4.80/5.0 |
| Fabian | 1 | $13,542 | 39 | 4.95/5.0 |
| Johanna Marilú | 2 | $7,034 | 70 | 4.90/5.0 |
| Lorena | 4 | $6,964 | 446 | 4.71/5.0 |
| Valeria | 4 | $5,627 | 361 | 4.86/5.0 |
| Paola | 1 | $5,566 | 28 | 4.75/5.0 |
| Gerardo | 1 | $1,287 | 84 | 4.94/5.0 |
| Fernando | 1 | $1,029 | 2 | Not Rated |
| Eddy | 1 | $751 | 14 | 4.86/5.0 |
| Veronica | 1 | $635 | 23 | 4.70/5.0 |
Analyzing the strategies of top hosts, such as their property selection, pricing, and guest communication, can offer valuable lessons for optimizing your own Airbnb operations in Turi.
Dive Deeper: Advanced Turi STR Market Data (2026)
Ready to unlock more insights? AirROI provides access to advanced metrics and comprehensive Airbnb data for Turi. Explore detailed analytics beyond this report to refine your investment strategy, optimize pricing, and maximize your vacation rental profits.
Explore Advanced MetricsTuri Short-Term Rental Market Composition (2026): Property & Room Types
Room Type Distribution
Property Type Distribution
Market Composition Insights for Turi
- The Turi Airbnb market composition is heavily skewed towards Entire Home/Apt listings, which make up 86.4% of the 22 active rentals. This indicates strong guest preference for privacy and space.
- Looking at the property type distribution in Turi, Apartment/Condo properties are the most common (59.1%), reflecting the local real estate landscape.
- Smaller segments like outdoor/unique (combined 4.5%) offer potential for unique stay experiences.
Turi Airbnb Room Capacity Analysis (2026): Bedroom Distribution
Distribution of Listings by Number of Bedrooms
Room Capacity Insights for Turi
- The dominant room capacity in Turi is 1 bedroom listings, making up 68.2% of the market. This suggests a strong demand for properties suitable for couples or solo travelers.
- Together, 1 bedroom and 2 bedrooms properties represent 86.4% of the active Airbnb listings in Turi, indicating a high concentration in these sizes.
- With over half the market (68.2%) consisting of studios or 1-bedroom units, Turi is particularly well-suited for individuals or couples.
Turi Vacation Rental Guest Capacity Trends (2026)
Distribution of Listings by Guest Capacity
Guest Capacity Insights for Turi
- The most common guest capacity trend in Turi vacation rentals is listings accommodating 3 guests (36.4%). This suggests the primary traveler segment is likely small families or groups.
- Properties designed for 3 guests and 4 guests dominate the Turi STR market, accounting for 54.6% of listings.
- 31.7% of properties accommodate 6+ guests, serving the market segment for larger families or group travel in Turi.
- On average, properties in Turi are equipped to host 4.2 guests.
Turi Airbnb Booking Patterns (2026): Available vs. Booked Days
Available Days Distribution
Booked Days Distribution
Booking Pattern Insights for Turi
- The most common availability pattern in Turi falls within the 271-366 days range, representing 72.7% of listings. This suggests many properties have significant open periods on their calendars.
- Approximately 100.0% of listings show high availability (181+ days open annually), indicating potential for increased bookings or specific owner usage patterns.
- For booked days, the 31-90 days range is most frequent in Turi (40.9%), reflecting common guest stay durations or potential owner blocking patterns.
Turi Airbnb Minimum Stay Requirements Analysis
Distribution of Listings by Minimum Night Requirement
1 Night
19 listings
86.4% of total
2 Nights
1 listings
4.5% of total
30+ Nights
2 listings
9.1% of total
Key Insights
- The most prevalent minimum stay requirement in Turi is 1 Night, adopted by 86.4% of listings. This highlights the market's preference for shorter, flexible bookings.
- A strong majority (90.9%) of the Turi Airbnb data shows acceptance of very short stays (1-2 nights), indicating a dynamic, high-turnover market.
Recommendations
- Align with the market by considering a 1 Night minimum stay, as 86.4% of Turi hosts use this setting.
- Explore offering discounts for stays of 30+ nights to attract the 9.1% of the market seeking extended stays.
- Adjust minimum nights based on seasonality – potentially shorter during low season and longer during peak demand periods in Turi.
Turi Airbnb Cancellation Policy Trends Analysis (2026)
Flexible
14 listings
63.6% of total
Moderate
5 listings
22.7% of total
Firm
2 listings
9.1% of total
Strict
1 listings
4.5% of total
Cancellation Policy Insights for Turi
- The prevailing Airbnb cancellation policy trend in Turi is Flexible, used by 63.6% of listings.
- The market strongly favors guest-friendly terms, with 86.3% of listings offering Flexible or Moderate policies. This suggests guests in Turi may expect booking flexibility.
- Strict cancellation policies are quite rare (4.5%), potentially making listings with this policy less competitive unless justified by high demand or property type.
Recommendations for Hosts
- Consider adopting a Flexible policy to align with the 63.6% market standard in Turi.
- Given the high prevalence of Flexible policies (63.6%), offering this can enhance booking appeal, especially during shoulder seasons.
- Using a Strict policy might deter some guests, as only 4.5% of listings use it. Evaluate if potential revenue protection outweighs possible lower booking rates.
- Regularly review your cancellation policy against competitors and market demand shifts in Turi.
Turi STR Booking Lead Time Analysis (2026)
Average Booking Lead Time by Month
Booking Lead Time Insights for Turi
- The overall average booking lead time for vacation rentals in Turi is 21 days.
- Guests book furthest in advance for stays during December (average 60 days), likely coinciding with peak travel demand or local events.
- The shortest booking windows occur for stays in March (average 6 days), indicating more last-minute travel plans during this time.
- Seasonally, Winter (36 days avg.) sees the longest lead times, while Spring (11 days avg.) has the shortest, reflecting typical travel planning cycles.
Recommendations for Hosts
- Use the overall average lead time (21 days) as a baseline for your pricing and availability strategy in Turi.
- For December stays, consider implementing length-of-stay discounts or slightly higher rates for bookings made less than 60 days out to capitalize on advance planning.
- During March, focus on last-minute booking availability and promotions, as guests book with very short notice (6 days avg.).
- Target marketing efforts for the Winter season well in advance (at least 36 days) to capture early planners.
- Monitor your own booking lead times against these Turi averages to identify opportunities for dynamic pricing adjustments.
Popular & Essential Airbnb Amenities in Turi (2026)
Amenity Prevalence
Amenity Insights for Turi
- Essential amenities in Turi that guests expect include: Free parking on premises, Wifi. Lacking these (any) could significantly impact bookings.
- Popular amenities like Hot water, Shampoo, Dishes and silverware are common but not universal. Offering these can provide a competitive edge.
Recommendations for Hosts
- Ensure your listing includes all essential amenities for Turi: Free parking on premises, Wifi.
- Consider adding popular differentiators like Hot water or Shampoo to increase appeal.
- Highlight unique or less common amenities you offer (e.g., hot tub, dedicated workspace, EV charger) in your listing description and photos.
- Regularly check competitor amenities in Turi to stay competitive.
Turi Airbnb Guest Demographics & Profile Analysis (2026)
Guest Profile Summary for Turi
- The typical guest profile for Airbnb in Turi consists of primarily domestic travelers (83%), often arriving from nearby Guayaquil, typically belonging to the Post-2000s (Gen Z/Alpha) group (50%), primarily speaking Spanish or English.
- Domestic travelers account for 82.8% of guests.
- Key international markets include Ecuador (82.8%) and United States (12.5%).
- Top languages spoken are Spanish (55.6%) followed by English (30.2%).
- A significant demographic segment is the Post-2000s (Gen Z/Alpha) group, representing 50% of guests.
Recommendations for Hosts
- Target domestic marketing efforts towards travelers from Guayaquil and Cuenca.
- Tailor amenities and listing descriptions to appeal to the dominant Post-2000s (Gen Z/Alpha) demographic (e.g., highlight fast WiFi, smart home features, local guides).
- Highlight unique local experiences or amenities relevant to the primary guest profile.
- Consider seasonal promotions aligned with peak travel times for key origin markets.
Nearby Short-Term Rental Market Comparison
How does the Turi Airbnb market stack up against its neighbors? Compare key performance metrics like average monthly revenue, ADR, and occupancy rates in surrounding areas to understand the broader regional STR landscape.
| Market | Active Properties | Monthly Revenue | Daily Rate | Avg. Occupancy |
|---|---|---|---|---|
| Curia | 30 | $1,454 | $243.84 | 22% |
| District of Canoas de Punta Sal | 196 | $1,096 | $203.77 | 23% |
| Parroquia Manglaralto | 26 | $1,076 | $204.86 | 20% |
| La Entrada | 38 | $968 | $203.21 | 26% |
| Sayausi | 14 | $951 | $175.56 | 19% |
| La Unión | 16 | $896 | $135.56 | 23% |
| Ayangue | 58 | $861 | $150.30 | 18% |
| District of Zorritos | 245 | $685 | $152.69 | 21% |
| Santa Isabel | 24 | $651 | $178.12 | 17% |
| Olón | 178 | $623 | $144.07 | 22% |