Mao Airbnb Market Analysis 2026: Short Term Rental Data & Vacation Rental Statistics in Valverde, Dominican Republic
Is Airbnb profitable in Mao in 2026? Explore comprehensive Airbnb analytics for Mao, Valverde, Dominican Republic to uncover income potential. This 2026 STR market report for Mao, based on AirROI data from February 2025 to January 2026, reveals key trends in the niche market of 20 active listings.
Whether you're considering an Airbnb investment in Mao, optimizing your existing vacation rental, or exploring rental arbitrage opportunities, understanding the Mao Airbnb data is crucial. Leveraging the low regulation environment is key to maximizing your short term rental income potential. Let's dive into the specifics.
Key Mao Airbnb Performance Metrics Overview
Monthly Airbnb Revenue Variations & Income Potential in Mao (2026)
Understanding the monthly revenue variations for Airbnb listings in Mao is key to maximizing your short term rental income potential. Seasonality significantly impacts earnings. Our analysis, based on data from the past 12 months, shows that the peak revenue month for STRs in Mao is typically August, while January often presents the lowest earnings, highlighting opportunities for strategic pricing adjustments during shoulder and low seasons. Explore the typical Airbnb income in Mao across different performance tiers:
- Best-in-class properties (Top 10%) achieve $1,642+ monthly, often utilizing dynamic pricing and superior guest experiences.
- Strong performing properties (Top 25%) earn $936 or more, indicating effective management and desirable locations/amenities.
- Typical properties (Median) generate around $488 per month, representing the average market performance.
- Entry-level properties (Bottom 25%) see earnings around $246, often with potential for optimization.
Average Monthly Airbnb Earnings Trend in Mao
Mao Airbnb Occupancy Rate Trends (2026)
Maximize your bookings by understanding the Mao STR occupancy trends. Seasonal demand shifts significantly influence how often properties are booked. Typically, Julysees the highest demand (peak season occupancy), while December experiences the lowest (low season). Effective strategies, like adjusting minimum stays or offering promotions, can boost occupancy during slower periods. Here's how different property tiers perform in Mao:
- Best-in-class properties (Top 10%) achieve 56%+ occupancy, indicating high desirability and potentially optimized availability.
- Strong performing properties (Top 25%) maintain 40% or higher occupancy, suggesting good market fit and guest satisfaction.
- Typical properties (Median) have an occupancy rate around 25%.
- Entry-level properties (Bottom 25%) average 15% occupancy, potentially facing higher vacancy.
Average Monthly Occupancy Rate Trend in Mao
Average Daily Rate (ADR) Airbnb Trends in Mao (2026)
Effective short term rental pricing strategy in Mao involves understanding monthly ADR fluctuations. The Average Daily Rate (ADR) for Airbnb in Mao typically peaks in September and dips lowest during January. Leveraging Airbnb dynamic pricing tools or strategies based on this seasonality can significantly boost revenue. Here's a look at the typical nightly rates achieved:
- Best-in-class properties (Top 10%) command rates of $108+ per night, often due to premium features or locations.
- Strong performing properties (Top 25%) achieve nightly rates of $80 or more.
- Typical properties (Median) charge around $57 per night.
- Entry-level properties (Bottom 25%) earn around $48 per night.
Average Daily Rate (ADR) Trend by Month in Mao
Get Live Mao Market Intelligence 👇

Explore Real-time Analytics
Airbnb Seasonality Analysis & Trends in Mao (2026)
Peak Season (August, July, June)
- Revenue averages $947 per month
- Occupancy rates average 36.0%
- Daily rates average $76
Shoulder Season
- Revenue averages $686 per month
- Occupancy maintains around 29.9%
- Daily rates hold near $74
Low Season (January, May, December)
- Revenue drops to average $544 per month
- Occupancy decreases to average 22.2%
- Daily rates adjust to average $73
Seasonality Insights for Mao
- The Airbnb seasonality in Mao shows moderate seasonality with distinct peak and low periods. While the sections above show seasonal averages, it's also insightful to look at the extremes:
- During the high season, the absolute peak month showcases Mao's highest earning potential, with monthly revenues capable of climbing to $1,024, occupancy reaching a high of 37.6%, and ADRs peaking at $76.
- Conversely, the slowest single month of the year, typically falling within the low season, marks the market's lowest point. In this month, revenue might dip to $540, occupancy could drop to 20.4%, and ADRs may adjust down to $71.
- Understanding both the seasonal averages and these monthly peaks and troughs in revenue, occupancy, and ADR is crucial for maximizing your Airbnb profit potential in Mao.
Seasonal Strategies for Maximizing Profit
- Peak Season: Maximize revenue through premium pricing and potentially longer minimum stays. Ensure high availability.
- Low Season: Offer competitive pricing, special promotions (e.g., extended stay discounts), and flexible cancellation policies. Target off-season travelers like remote workers or budget-conscious guests.
- Shoulder Seasons: Implement dynamic pricing that balances peak and low rates. Target weekend travelers or specific events. Offer slightly more flexible terms than peak season.
- Regularly analyze your own performance against these Mao seasonality benchmarks and adjust your pricing and availability strategy accordingly.
Best Areas for Airbnb Investment in Mao (2026)
Exploring the top neighborhoods for short-term rentals in Mao? This section highlights key areas, outlining why they are attractive for hosts and guests, along with notable local attractions. Consider these locations based on your target guest profile and investment strategy.
| Neighborhood / Area | Why Host Here? (Target Guests & Appeal) | Key Attractions & Landmarks |
|---|---|---|
| Valverde | A picturesque province known for its beautiful landscapes and agricultural richness. Valverde attracts visitors interested in rural tourism and Dominican culture. | Parque Central de Mao, Cayo Arena, Los Haitises National Park, historical sugar plantations, local markets |
| Mao | The capital of Valverde, Mao is a hub for commerce and agriculture, making it a strategic location for both short-term and long-term stays. | Pueblo Viejo, Catedral de San Juan Bautista, Museo de Historia Natural, local food markets, El río Mao |
| Laguna Salada | A serene area near Mao, known for its tranquil lagoons and natural beauty, great for eco-tourism and relaxation. | Laguna Salada, birdwatching, fishing spots, scenic landscapes, nature trails |
| Monción | A charming town nestled in the mountains, offering visitors a peaceful environment and stunning views, perfect for getaway stays. | Monción River, historical sites, local traditional cuisine, rural landscapes, hiking trails |
| Esperanza | A growing town close to Mao with access to beautiful beaches and natural parks, appealing to both tourists and locals. | Cabo Rojo Beach, Los Cacaos, Boca de Mao, beachfront activities, local seafood restaurants |
| Sabaneta | A lively small town known for its community vibe and cultural experiences, making it an attractive stay for cultural tourism. | Sabaneta Park, local music scenes, artisanal crafts, traditional Dominican festivities, food tasting experiences |
| Cruz de Manzanillo | A coastal area often frequented for its beaches and seaside activities, great for those who enjoy outdoor and water sports. | Manzanillo Beach, water sports, snorkeling excursions, scenic boat rides, local seafood markets |
| Dajabón | A border town that provides a unique cultural mix due to its proximity to Haiti, offering visitors a chance to experience both Dominican and Haitian cultures. | Dajabón Market, border crossing experiences, historical landmarks, cultural festivals, cuisine tasting |
Understanding Airbnb License Requirements & STR Laws in Mao (2026)
While Mao, Valverde, Dominican Republic currently shows low STR regulations, specific Airbnb license requirements might still exist or change. Always verify the latest short term rental regulations and Airbnb license requirements directly with local government authorities for Mao to ensure full compliance before hosting.
(Source: AirROI data, 2026, finding no licensed listings among those analyzed)
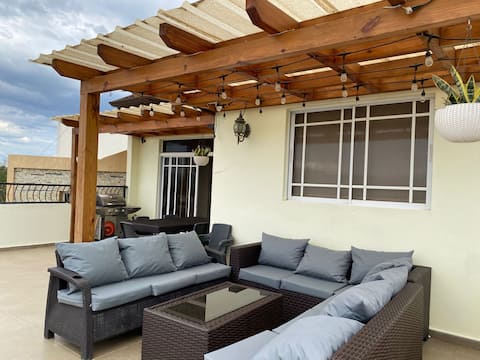
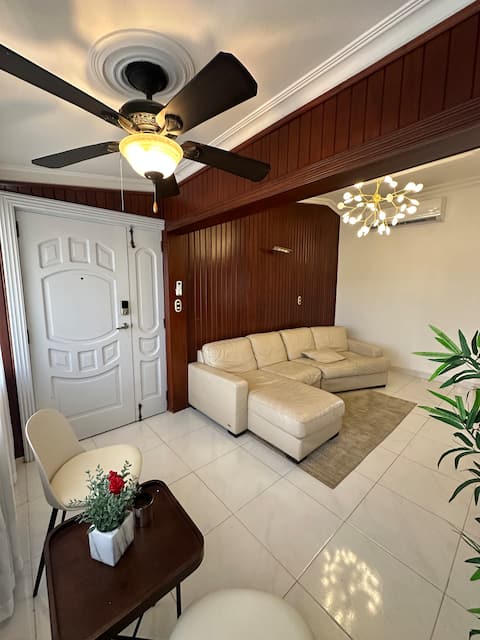
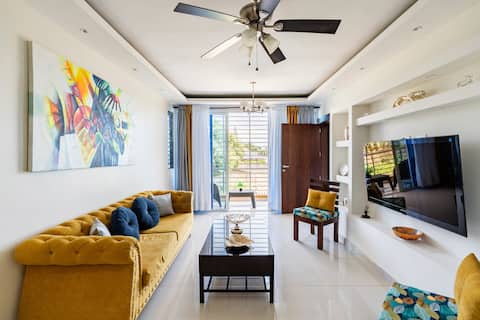
Top Performing Airbnb Properties in Mao (2026)
Benchmark your potential! Explore examples of top-performing Airbnb properties in Maobased on Trailing Twelve Month (TTM) revenue. Analyze their characteristics, revenue, occupancy rate, and ADR to understand what drives success in this market.

House for 10 people
Entire Place • 4 bedrooms

Villa JanyDaniel
Entire Place • 4 bedrooms
Penthouse Apartment For Rent Downtown
Entire Place • 3 bedrooms
Centrally located apartment with central air
Entire Place • 3 bedrooms

Family home in Mao, Valverde para 6 personas
Entire Place • 3 bedrooms
Exclusive and luxurious apartment in Mao Valverde
Entire Place • 3 bedrooms
Note: Performance varies based on location, size, amenities, seasonality, and management quality. Data reflects the past 12 months.
Top Performing Airbnb Hosts in Mao (2026)
Learn from the best! This table showcases top-performing Airbnb hosts in Mao based on the number of properties managed and estimated total revenue over the past year. Analyze their scale and performance metrics.
| Host Name | Properties | Grossing Revenue | Stay Reviews | Avg Rating |
|---|---|---|---|---|
| Erich | 2 | $26,199 | 164 | 4.91/5.0 |
| Rafelin Casado | 1 | $20,573 | 10 | 5.00/5.0 |
| Yasser | 3 | $15,250 | 20 | 5.00/5.0 |
| Alex Aponte | 1 | $15,227 | 111 | 4.87/5.0 |
| Esther | 3 | $10,581 | 18 | 4.86/5.0 |
| Erickson | 1 | $9,531 | 21 | 4.95/5.0 |
| Yubelkys | 1 | $8,153 | 17 | 5.00/5.0 |
| Emmely | 1 | $5,349 | 55 | 4.87/5.0 |
| Yuleisy | 1 | $4,956 | 10 | 5.00/5.0 |
| Doyle | 1 | $4,041 | 21 | 5.00/5.0 |
Analyzing the strategies of top hosts, such as their property selection, pricing, and guest communication, can offer valuable lessons for optimizing your own Airbnb operations in Mao.
Dive Deeper: Advanced Mao STR Market Data (2026)
Ready to unlock more insights? AirROI provides access to advanced metrics and comprehensive Airbnb data for Mao. Explore detailed analytics beyond this report to refine your investment strategy, optimize pricing, and maximize your vacation rental profits.
Explore Advanced MetricsMao Short-Term Rental Market Composition (2026): Property & Room Types
Room Type Distribution
Property Type Distribution
Market Composition Insights for Mao
- The Mao Airbnb market composition is heavily skewed towards Entire Home/Apt listings, which make up 80% of the 20 active rentals. This indicates strong guest preference for privacy and space.
- Looking at the property type distribution in Mao, Apartment/Condo properties are the most common (60%), reflecting the local real estate landscape.
- Houses represent a significant 30% portion, catering likely to families or larger groups.
- The presence of 10% Hotel/Boutique listings indicates integration with traditional hospitality.
Mao Airbnb Room Capacity Analysis (2026): Bedroom Distribution
Distribution of Listings by Number of Bedrooms
Room Capacity Insights for Mao
- The dominant room capacity in Mao is 3 bedrooms listings, making up 30% of the market. This suggests a strong demand for properties suitable for families or small groups.
- Together, 3 bedrooms and 1 bedroom properties represent 55.0% of the active Airbnb listings in Mao, indicating a high concentration in these sizes.
- A significant 40.0% of listings offer 3+ bedrooms, catering to larger groups and families seeking more space in Mao.
Mao Vacation Rental Guest Capacity Trends (2026)
Distribution of Listings by Guest Capacity
Guest Capacity Insights for Mao
- The most common guest capacity trend in Mao vacation rentals is listings accommodating 6 guests (30%). This suggests the primary traveler segment is likely larger groups.
- Properties designed for 6 guests and 2 guests dominate the Mao STR market, accounting for 60.0% of listings.
- 45.0% of properties accommodate 6+ guests, serving the market segment for larger families or group travel in Mao.
- On average, properties in Mao are equipped to host 4.1 guests.
Mao Airbnb Booking Patterns (2026): Available vs. Booked Days
Available Days Distribution
Booked Days Distribution
Booking Pattern Insights for Mao
- The most common availability pattern in Mao falls within the 271-366 days range, representing 65% of listings. This suggests many properties have significant open periods on their calendars.
- Approximately 100.0% of listings show high availability (181+ days open annually), indicating potential for increased bookings or specific owner usage patterns.
- For booked days, the 91-180 days range is most frequent in Mao (40%), reflecting common guest stay durations or potential owner blocking patterns.
Mao Airbnb Minimum Stay Requirements Analysis
Distribution of Listings by Minimum Night Requirement
1 Night
8 listings
40% of total
2 Nights
5 listings
25% of total
3 Nights
1 listings
5% of total
4-6 Nights
3 listings
15% of total
30+ Nights
3 listings
15% of total
Key Insights
- The most prevalent minimum stay requirement in Mao is 1 Night, adopted by 40% of listings. This highlights the market's preference for shorter, flexible bookings.
- A strong majority (65.0%) of the Mao Airbnb data shows acceptance of very short stays (1-2 nights), indicating a dynamic, high-turnover market.
- A significant segment (15%) caters to monthly stays (30+ nights) in Mao, pointing to opportunities in the extended-stay market.
Recommendations
- Align with the market by considering a 1 Night minimum stay, as 40% of Mao hosts use this setting.
- Explore offering discounts for stays of 30+ nights to attract the 15% of the market seeking extended stays.
- Adjust minimum nights based on seasonality – potentially shorter during low season and longer during peak demand periods in Mao.
Mao Airbnb Cancellation Policy Trends Analysis (2026)
Flexible
9 listings
45% of total
Moderate
7 listings
35% of total
Firm
4 listings
20% of total
Cancellation Policy Insights for Mao
- The prevailing Airbnb cancellation policy trend in Mao is Flexible, used by 45% of listings.
- The market strongly favors guest-friendly terms, with 80.0% of listings offering Flexible or Moderate policies. This suggests guests in Mao may expect booking flexibility.
Recommendations for Hosts
- Consider adopting a Flexible policy to align with the 45% market standard in Mao.
- Regularly review your cancellation policy against competitors and market demand shifts in Mao.
Mao STR Booking Lead Time Analysis (2026)
Average Booking Lead Time by Month
Booking Lead Time Insights for Mao
- The overall average booking lead time for vacation rentals in Mao is 26 days.
- Guests book furthest in advance for stays during January (average 41 days), likely coinciding with peak travel demand or local events.
- The shortest booking windows occur for stays in September (average 13 days), indicating more last-minute travel plans during this time.
- Seasonally, Winter (32 days avg.) sees the longest lead times, while Spring (14 days avg.) has the shortest, reflecting typical travel planning cycles.
Recommendations for Hosts
- Use the overall average lead time (26 days) as a baseline for your pricing and availability strategy in Mao.
- For January stays, consider implementing length-of-stay discounts or slightly higher rates for bookings made less than 41 days out to capitalize on advance planning.
- During September, focus on last-minute booking availability and promotions, as guests book with very short notice (13 days avg.).
- Target marketing efforts for the Winter season well in advance (at least 32 days) to capture early planners.
- Monitor your own booking lead times against these Mao averages to identify opportunities for dynamic pricing adjustments.
Popular & Essential Airbnb Amenities in Mao (2026)
Amenity Prevalence
Amenity Insights for Mao
- Essential amenities in Mao that guests expect include: Air conditioning, TV, Wifi, Free parking on premises. Lacking these (any) could significantly impact bookings.
- Popular amenities like Kitchen, Extra pillows and blankets, Clothing storage are common but not universal. Offering these can provide a competitive edge.
Recommendations for Hosts
- Ensure your listing includes all essential amenities for Mao: Air conditioning, TV, Wifi, Free parking on premises.
- Prioritize adding missing essentials: Free parking on premises.
- Consider adding popular differentiators like Kitchen or Extra pillows and blankets to increase appeal.
- Highlight unique or less common amenities you offer (e.g., hot tub, dedicated workspace, EV charger) in your listing description and photos.
- Regularly check competitor amenities in Mao to stay competitive.
Mao Airbnb Guest Demographics & Profile Analysis (2026)
Guest Profile Summary for Mao
- The typical guest profile for Airbnb in Mao consists of predominantly international visitors (73%), with top international origins including Dominican Republic, typically belonging to the Post-2000s (Gen Z/Alpha) group (50%), primarily speaking Spanish or English.
- Domestic travelers account for 27.0% of guests.
- Key international markets include United States (62.2%) and Dominican Republic (27%).
- Top languages spoken are Spanish (50%) followed by English (45.7%).
- A significant demographic segment is the Post-2000s (Gen Z/Alpha) group, representing 50% of guests.
Recommendations for Hosts
- Focus marketing internationally, particularly towards travelers from Dominican Republic.
- Offer listing details and communication support in Spanish.
- Tailor amenities and listing descriptions to appeal to the dominant Post-2000s (Gen Z/Alpha) demographic (e.g., highlight fast WiFi, smart home features, local guides).
- Highlight unique local experiences or amenities relevant to the primary guest profile.
- Consider seasonal promotions aligned with peak travel times for key origin markets.
Nearby Short-Term Rental Market Comparison
How does the Mao Airbnb market stack up against its neighbors? Compare key performance metrics like average monthly revenue, ADR, and occupancy rates in surrounding areas to understand the broader regional STR landscape.
| Market | Active Properties | Monthly Revenue | Daily Rate | Avg. Occupancy |
|---|---|---|---|---|
| Juan Esteban | 12 | $1,703 | $346.19 | 21% |
| Punta Rucia;Damaris | 33 | $1,683 | $223.57 | 21% |
| Las Charcas | 57 | $1,432 | $304.97 | 19% |
| Punta Rucia | 14 | $1,403 | $203.53 | 21% |
| Sosúa | 1,556 | $1,233 | $208.18 | 31% |
| Buena Vista | 22 | $1,170 | $235.10 | 24% |
| Cabarete | 1,025 | $1,066 | $159.24 | 35% |
| Tamboril | 33 | $1,050 | $135.33 | 27% |
| Villa Monte Tabor | 99 | $986 | $196.14 | 22% |
| Jarabacoa | 683 | $955 | $233.60 | 22% |