Villa Mella Airbnb Market Analysis 2026: Short Term Rental Data & Vacation Rental Statistics in Santo Domingo, Dominican Republic
Is Airbnb profitable in Villa Mella in 2026? Explore comprehensive Airbnb analytics for Villa Mella, Santo Domingo, Dominican Republic to uncover income potential. This 2026 STR market report for Villa Mella, based on AirROI data from February 2025 to January 2026, reveals key trends in the niche market of 93 active listings.
Whether you're considering an Airbnb investment in Villa Mella, optimizing your existing vacation rental, or exploring rental arbitrage opportunities, understanding the Villa Mella Airbnb data is crucial. Leveraging the low regulation environment is key to maximizing your short term rental income potential. Let's dive into the specifics.
Key Villa Mella Airbnb Performance Metrics Overview
Monthly Airbnb Revenue Variations & Income Potential in Villa Mella (2026)
Understanding the monthly revenue variations for Airbnb listings in Villa Mella is key to maximizing your short term rental income potential. Seasonality significantly impacts earnings. Our analysis, based on data from the past 12 months, shows that the peak revenue month for STRs in Villa Mella is typically August, while January often presents the lowest earnings, highlighting opportunities for strategic pricing adjustments during shoulder and low seasons. Explore the typical Airbnb income in Villa Mella across different performance tiers:
- Best-in-class properties (Top 10%) achieve $1,163+ monthly, often utilizing dynamic pricing and superior guest experiences.
- Strong performing properties (Top 25%) earn $767 or more, indicating effective management and desirable locations/amenities.
- Typical properties (Median) generate around $393 per month, representing the average market performance.
- Entry-level properties (Bottom 25%) see earnings around $172, often with potential for optimization.
Average Monthly Airbnb Earnings Trend in Villa Mella
Villa Mella Airbnb Occupancy Rate Trends (2026)
Maximize your bookings by understanding the Villa Mella STR occupancy trends. Seasonal demand shifts significantly influence how often properties are booked. Typically, Augustsees the highest demand (peak season occupancy), while January experiences the lowest (low season). Effective strategies, like adjusting minimum stays or offering promotions, can boost occupancy during slower periods. Here's how different property tiers perform in Villa Mella:
- Best-in-class properties (Top 10%) achieve 75%+ occupancy, indicating high desirability and potentially optimized availability.
- Strong performing properties (Top 25%) maintain 54% or higher occupancy, suggesting good market fit and guest satisfaction.
- Typical properties (Median) have an occupancy rate around 30%.
- Entry-level properties (Bottom 25%) average 14% occupancy, potentially facing higher vacancy.
Average Monthly Occupancy Rate Trend in Villa Mella
Average Daily Rate (ADR) Airbnb Trends in Villa Mella (2026)
Effective short term rental pricing strategy in Villa Mella involves understanding monthly ADR fluctuations. The Average Daily Rate (ADR) for Airbnb in Villa Mella typically peaks in July and dips lowest during March. Leveraging Airbnb dynamic pricing tools or strategies based on this seasonality can significantly boost revenue. Here's a look at the typical nightly rates achieved:
- Best-in-class properties (Top 10%) command rates of $113+ per night, often due to premium features or locations.
- Strong performing properties (Top 25%) achieve nightly rates of $64 or more.
- Typical properties (Median) charge around $44 per night.
- Entry-level properties (Bottom 25%) earn around $35 per night.
Average Daily Rate (ADR) Trend by Month in Villa Mella
Get Live Villa Mella Market Intelligence 👇

Explore Real-time Analytics
Airbnb Seasonality Analysis & Trends in Villa Mella (2026)
Peak Season (August, July, December)
- Revenue averages $749 per month
- Occupancy rates average 40.2%
- Daily rates average $60
Shoulder Season
- Revenue averages $587 per month
- Occupancy maintains around 35.5%
- Daily rates hold near $59
Low Season (January, February, May)
- Revenue drops to average $470 per month
- Occupancy decreases to average 30.9%
- Daily rates adjust to average $58
Seasonality Insights for Villa Mella
- The Airbnb seasonality in Villa Mella shows moderate seasonality with distinct peak and low periods. While the sections above show seasonal averages, it's also insightful to look at the extremes:
- During the high season, the absolute peak month showcases Villa Mella's highest earning potential, with monthly revenues capable of climbing to $794, occupancy reaching a high of 44.4%, and ADRs peaking at $61.
- Conversely, the slowest single month of the year, typically falling within the low season, marks the market's lowest point. In this month, revenue might dip to $425, occupancy could drop to 23.5%, and ADRs may adjust down to $57.
- Understanding both the seasonal averages and these monthly peaks and troughs in revenue, occupancy, and ADR is crucial for maximizing your Airbnb profit potential in Villa Mella.
Seasonal Strategies for Maximizing Profit
- Peak Season: Maximize revenue through premium pricing and potentially longer minimum stays. Ensure high availability.
- Low Season: Offer competitive pricing, special promotions (e.g., extended stay discounts), and flexible cancellation policies. Target off-season travelers like remote workers or budget-conscious guests.
- Shoulder Seasons: Implement dynamic pricing that balances peak and low rates. Target weekend travelers or specific events. Offer slightly more flexible terms than peak season.
- Regularly analyze your own performance against these Villa Mella seasonality benchmarks and adjust your pricing and availability strategy accordingly.
Best Areas for Airbnb Investment in Villa Mella (2026)
Exploring the top neighborhoods for short-term rentals in Villa Mella? This section highlights key areas, outlining why they are attractive for hosts and guests, along with notable local attractions. Consider these locations based on your target guest profile and investment strategy.
| Neighborhood / Area | Why Host Here? (Target Guests & Appeal) | Key Attractions & Landmarks |
|---|---|---|
| Los Jardines | A popular residential area known for its parks and family-friendly environment, making it a great spot for tourists who prefer a quieter stay close to the city center. | Jardín Botánico Nacional, Catedral Primada de América, Plaza de la Cultura, Centro Olímpico Juan Pablo Duarte, Parque Iberoamericano |
| Villa Juana | This neighborhood is close to key educational institutions and offers a blend of local culture and modern amenities, attracting both students and visitors. | Universidad Autónoma de Santo Domingo, Parque Las Palmas, Plaza Mia, Local markets, Cultural centers |
| Gazcue | A vibrant neighborhood known for its colonial architecture and proximity to cultural sites, making it appealing for those looking to explore Dominican history. | Malecón, Museo de Historia Natural, Parque Eugenio María de Hostos, Local art galleries, Colonial Zone |
| Naco | An upscale area with modern infrastructure, appealing to business travelers and those looking for a comfortable and luxurious stay. | Plaza Naco, Local boutiques, Cafés and restaurants, Centro de los Héroes, Embassy of the United States |
| Piantini | Highly regarded for its business centers and luxury properties, Piantini attracts affluent travelers and offers various high-end dining options. | Sambil Santo Domingo, Plaza La Sirena, Cinemas, Chic restaurants, Local nightlife |
| El Millón | A serene residential area with a mix of modern and colonial architecture, perfect for families and those seeking a peaceful stay. | Parque El Millón, Local artisan shops, Museo de Arte Moderno, Cultural events, Dining spots |
| Los Cacicazgos | One of the most exclusive neighborhoods in Santo Domingo, highly attractive to tourists looking for luxury and privacy. | Luxury villas, Upscale dining, Private parks, Exclusive shops, Scenic views |
| Capotillo | Known for its rich history and vibrant community life, this area showcases the local Dominican lifestyle, offering guests an immersive experience. | Local markets, Street food, Cultural festivals, Historical landmarks, Artisan shops |
Understanding Airbnb License Requirements & STR Laws in Villa Mella (2026)
While Villa Mella, Santo Domingo, Dominican Republic currently shows low STR regulations, specific Airbnb license requirements might still exist or change. Always verify the latest short term rental regulations and Airbnb license requirements directly with local government authorities for Villa Mella to ensure full compliance before hosting.
(Source: AirROI data, 2026, based on 1% licensed listings)
Top Performing Airbnb Properties in Villa Mella (2026)
Benchmark your potential! Explore examples of top-performing Airbnb properties in Villa Mellabased on Trailing Twelve Month (TTM) revenue. Analyze their characteristics, revenue, occupancy rate, and ADR to understand what drives success in this market.
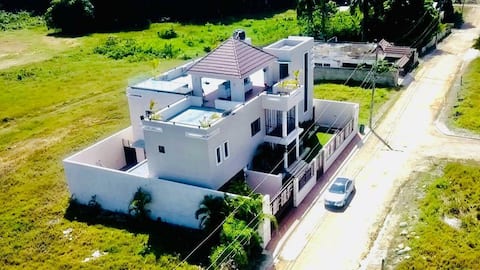
luxury villa with free
Entire Place • 5 bedrooms
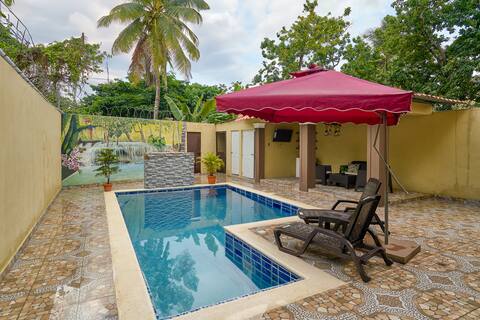
PrivatePool - BBQ - Terrace - Excelent for Big Fam
Entire Place • 3 bedrooms

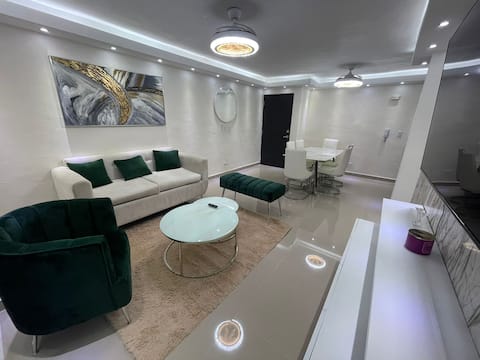
Cozy, Safe and Beautiful Apt
Entire Place • 2 bedrooms

Wake up to a beautiful morning, near the US Embassy.
Entire Place • 3 bedrooms

Garden city II apartment with a pool and a private Jacuzzi
Entire Place • 2 bedrooms
Beautiful apartment on the first floor
Entire Place • 2 bedrooms
Note: Performance varies based on location, size, amenities, seasonality, and management quality. Data reflects the past 12 months.
Top Performing Airbnb Hosts in Villa Mella (2026)
Learn from the best! This table showcases top-performing Airbnb hosts in Villa Mella based on the number of properties managed and estimated total revenue over the past year. Analyze their scale and performance metrics.
| Host Name | Properties | Grossing Revenue | Stay Reviews | Avg Rating |
|---|---|---|---|---|
| Richard | 1 | $43,662 | 111 | 4.83/5.0 |
| Miguel | 1 | $31,648 | 39 | 4.85/5.0 |
| Luisa | 3 | $23,740 | 126 | 4.86/5.0 |
| Aurelina | 1 | $17,954 | 46 | 4.98/5.0 |
| Santa Germania | 11 | $15,094 | 323 | 4.32/5.0 |
| Moralma | 3 | $13,499 | 53 | 4.43/5.0 |
| Ruth Esther | 1 | $11,728 | 17 | 4.88/5.0 |
| Vanessa | 4 | $10,973 | 62 | 4.88/5.0 |
| Host In Rd | 2 | $10,844 | 98 | 4.90/5.0 |
| Wilkin | 2 | $10,305 | 75 | 4.82/5.0 |
Analyzing the strategies of top hosts, such as their property selection, pricing, and guest communication, can offer valuable lessons for optimizing your own Airbnb operations in Villa Mella.
Dive Deeper: Advanced Villa Mella STR Market Data (2026)
Ready to unlock more insights? AirROI provides access to advanced metrics and comprehensive Airbnb data for Villa Mella. Explore detailed analytics beyond this report to refine your investment strategy, optimize pricing, and maximize your vacation rental profits.
Explore Advanced MetricsVilla Mella Short-Term Rental Market Composition (2026): Property & Room Types
Room Type Distribution
Property Type Distribution
Market Composition Insights for Villa Mella
- The Villa Mella Airbnb market composition is heavily skewed towards Entire Home/Apt listings, which make up 98.9% of the 93 active rentals. This indicates strong guest preference for privacy and space.
- Looking at the property type distribution in Villa Mella, Apartment/Condo properties are the most common (87.1%), reflecting the local real estate landscape.
- Smaller segments like hotel/boutique (combined 2.2%) offer potential for unique stay experiences.
Villa Mella Airbnb Room Capacity Analysis (2026): Bedroom Distribution
Distribution of Listings by Number of Bedrooms
Room Capacity Insights for Villa Mella
- The dominant room capacity in Villa Mella is 3 bedrooms listings, making up 48.4% of the market. This suggests a strong demand for properties suitable for families or small groups.
- Together, 3 bedrooms and 2 bedrooms properties represent 78.5% of the active Airbnb listings in Villa Mella, indicating a high concentration in these sizes.
- A significant 52.7% of listings offer 3+ bedrooms, catering to larger groups and families seeking more space in Villa Mella.
Villa Mella Vacation Rental Guest Capacity Trends (2026)
Distribution of Listings by Guest Capacity
Guest Capacity Insights for Villa Mella
- The most common guest capacity trend in Villa Mella vacation rentals is listings accommodating 6 guests (43%). This suggests the primary traveler segment is likely larger groups.
- Properties designed for 6 guests and 4 guests dominate the Villa Mella STR market, accounting for 69.9% of listings.
- 50.6% of properties accommodate 6+ guests, serving the market segment for larger families or group travel in Villa Mella.
- On average, properties in Villa Mella are equipped to host 4.9 guests.
Villa Mella Airbnb Booking Patterns (2026): Available vs. Booked Days
Available Days Distribution
Booked Days Distribution
Booking Pattern Insights for Villa Mella
- The most common availability pattern in Villa Mella falls within the 271-366 days range, representing 68.8% of listings. This suggests many properties have significant open periods on their calendars.
- Approximately 88.2% of listings show high availability (181+ days open annually), indicating potential for increased bookings or specific owner usage patterns.
- For booked days, the 31-90 days range is most frequent in Villa Mella (34.4%), reflecting common guest stay durations or potential owner blocking patterns.
- A notable 12.9% of properties secure long booking periods (181+ days booked per year), highlighting successful long-term rental strategies or significant owner usage.
Villa Mella Airbnb Minimum Stay Requirements Analysis
Distribution of Listings by Minimum Night Requirement
1 Night
19 listings
20.4% of total
2 Nights
29 listings
31.2% of total
3 Nights
14 listings
15.1% of total
4-6 Nights
7 listings
7.5% of total
7-29 Nights
4 listings
4.3% of total
30+ Nights
20 listings
21.5% of total
Key Insights
- The most prevalent minimum stay requirement in Villa Mella is 2 Nights, adopted by 31.2% of listings. This highlights the market's preference for shorter, flexible bookings.
- A significant segment (21.5%) caters to monthly stays (30+ nights) in Villa Mella, pointing to opportunities in the extended-stay market.
Recommendations
- Align with the market by considering a 2 Nights minimum stay, as 31.2% of Villa Mella hosts use this setting.
- If feasible, allowing 1-night stays, especially midweek or during low season, could capture last-minute bookings, as only 20.4% currently do.
- Explore offering discounts for stays of 30+ nights to attract the 21.5% of the market seeking extended stays.
- Adjust minimum nights based on seasonality – potentially shorter during low season and longer during peak demand periods in Villa Mella.
Villa Mella Airbnb Cancellation Policy Trends Analysis (2026)
Flexible
44 listings
47.8% of total
Moderate
19 listings
20.7% of total
Firm
19 listings
20.7% of total
Strict
10 listings
10.9% of total
Cancellation Policy Insights for Villa Mella
- The prevailing Airbnb cancellation policy trend in Villa Mella is Flexible, used by 47.8% of listings.
- There's a relatively balanced mix between guest-friendly (68.5%) and stricter (31.6%) policies, offering choices for different guest needs.
Recommendations for Hosts
- Consider adopting a Flexible policy to align with the 47.8% market standard in Villa Mella.
- Using a Strict policy might deter some guests, as only 10.9% of listings use it. Evaluate if potential revenue protection outweighs possible lower booking rates.
- Regularly review your cancellation policy against competitors and market demand shifts in Villa Mella.
Villa Mella STR Booking Lead Time Analysis (2026)
Average Booking Lead Time by Month
Booking Lead Time Insights for Villa Mella
- The overall average booking lead time for vacation rentals in Villa Mella is 15 days.
- Guests book furthest in advance for stays during August (average 28 days), likely coinciding with peak travel demand or local events.
- The shortest booking windows occur for stays in March (average 8 days), indicating more last-minute travel plans during this time.
- Seasonally, Summer (25 days avg.) sees the longest lead times, while Spring (10 days avg.) has the shortest, reflecting typical travel planning cycles.
Recommendations for Hosts
- Use the overall average lead time (15 days) as a baseline for your pricing and availability strategy in Villa Mella.
- For August stays, consider implementing length-of-stay discounts or slightly higher rates for bookings made less than 28 days out to capitalize on advance planning.
- Target marketing efforts for the Summer season well in advance (at least 25 days) to capture early planners.
- Monitor your own booking lead times against these Villa Mella averages to identify opportunities for dynamic pricing adjustments.
Popular & Essential Airbnb Amenities in Villa Mella (2026)
Amenity Prevalence
Amenity Insights for Villa Mella
- Essential amenities in Villa Mella that guests expect include: Kitchen, TV, Wifi, Air conditioning. Lacking these (any) could significantly impact bookings.
- Popular amenities like Washer, Free parking on premises, Cooking basics are common but not universal. Offering these can provide a competitive edge.
Recommendations for Hosts
- Ensure your listing includes all essential amenities for Villa Mella: Kitchen, TV, Wifi, Air conditioning.
- Prioritize adding missing essentials: TV, Wifi, Air conditioning.
- Consider adding popular differentiators like Washer or Free parking on premises to increase appeal.
- Highlight unique or less common amenities you offer (e.g., hot tub, dedicated workspace, EV charger) in your listing description and photos.
- Regularly check competitor amenities in Villa Mella to stay competitive.
Villa Mella Airbnb Guest Demographics & Profile Analysis (2026)
Guest Profile Summary for Villa Mella
- The typical guest profile for Airbnb in Villa Mella consists of predominantly international visitors (81%), with top international origins including Dominican Republic, typically belonging to the Post-2000s (Gen Z/Alpha) group (50%), primarily speaking Spanish or English.
- Domestic travelers account for 18.9% of guests.
- Key international markets include United States (64.8%) and Dominican Republic (18.9%).
- Top languages spoken are Spanish (47.9%) followed by English (41.2%).
- A significant demographic segment is the Post-2000s (Gen Z/Alpha) group, representing 50% of guests.
Recommendations for Hosts
- Focus marketing internationally, particularly towards travelers from Dominican Republic.
- Offer listing details and communication support in Spanish.
- Tailor amenities and listing descriptions to appeal to the dominant Post-2000s (Gen Z/Alpha) demographic (e.g., highlight fast WiFi, smart home features, local guides).
- Highlight unique local experiences or amenities relevant to the primary guest profile.
- Consider seasonal promotions aligned with peak travel times for key origin markets.
Nearby Short-Term Rental Market Comparison
How does the Villa Mella Airbnb market stack up against its neighbors? Compare key performance metrics like average monthly revenue, ADR, and occupancy rates in surrounding areas to understand the broader regional STR landscape.
| Market | Active Properties | Monthly Revenue | Daily Rate | Avg. Occupancy |
|---|---|---|---|---|
| La Romana | 850 | $3,826 | $702.77 | 27% |
| Abreu | 15 | $2,503 | $204.50 | 26% |
| Higüey | 4,126 | $1,786 | $251.99 | 35% |
| Las Terrenas | 2,242 | $1,559 | $225.03 | 32% |
| Las Charcas | 57 | $1,432 | $304.97 | 19% |
| Sosúa | 1,556 | $1,233 | $208.18 | 31% |
| Buena Vista | 22 | $1,170 | $235.10 | 24% |
| Cabarete | 1,025 | $1,066 | $159.24 | 35% |
| Tamboril | 33 | $1,050 | $135.33 | 27% |
| Monte Plata | 17 | $1,033 | $170.06 | 21% |