Andrés Airbnb Market Analysis 2026: Short Term Rental Data & Vacation Rental Statistics in Santo Domingo, Dominican Republic
Is Airbnb profitable in Andrés in 2026? Explore comprehensive Airbnb analytics for Andrés, Santo Domingo, Dominican Republic to uncover income potential. This 2026 STR market report for Andrés, based on AirROI data from February 2025 to January 2026, reveals key trends in the niche market of 60 active listings.
Whether you're considering an Airbnb investment in Andrés, optimizing your existing vacation rental, or exploring rental arbitrage opportunities, understanding the Andrés Airbnb data is crucial. Leveraging the low regulation environment is key to maximizing your short term rental income potential. Let's dive into the specifics.
Key Andrés Airbnb Performance Metrics Overview
Monthly Airbnb Revenue Variations & Income Potential in Andrés (2026)
Understanding the monthly revenue variations for Airbnb listings in Andrés is key to maximizing your short term rental income potential. Seasonality significantly impacts earnings. Our analysis, based on data from the past 12 months, shows that the peak revenue month for STRs in Andrés is typically August, while May often presents the lowest earnings, highlighting opportunities for strategic pricing adjustments during shoulder and low seasons. Explore the typical Airbnb income in Andrés across different performance tiers:
- Best-in-class properties (Top 10%) achieve $1,360+ monthly, often utilizing dynamic pricing and superior guest experiences.
- Strong performing properties (Top 25%) earn $865 or more, indicating effective management and desirable locations/amenities.
- Typical properties (Median) generate around $427 per month, representing the average market performance.
- Entry-level properties (Bottom 25%) see earnings around $150, often with potential for optimization.
Average Monthly Airbnb Earnings Trend in Andrés
Andrés Airbnb Occupancy Rate Trends (2026)
Maximize your bookings by understanding the Andrés STR occupancy trends. Seasonal demand shifts significantly influence how often properties are booked. Typically, Februarysees the highest demand (peak season occupancy), while May experiences the lowest (low season). Effective strategies, like adjusting minimum stays or offering promotions, can boost occupancy during slower periods. Here's how different property tiers perform in Andrés:
- Best-in-class properties (Top 10%) achieve 66%+ occupancy, indicating high desirability and potentially optimized availability.
- Strong performing properties (Top 25%) maintain 44% or higher occupancy, suggesting good market fit and guest satisfaction.
- Typical properties (Median) have an occupancy rate around 20%.
- Entry-level properties (Bottom 25%) average 9% occupancy, potentially facing higher vacancy.
Average Monthly Occupancy Rate Trend in Andrés
Average Daily Rate (ADR) Airbnb Trends in Andrés (2026)
Effective short term rental pricing strategy in Andrés involves understanding monthly ADR fluctuations. The Average Daily Rate (ADR) for Airbnb in Andrés typically peaks in September and dips lowest during March. Leveraging Airbnb dynamic pricing tools or strategies based on this seasonality can significantly boost revenue. Here's a look at the typical nightly rates achieved:
- Best-in-class properties (Top 10%) command rates of $94+ per night, often due to premium features or locations.
- Strong performing properties (Top 25%) achieve nightly rates of $78 or more.
- Typical properties (Median) charge around $56 per night.
- Entry-level properties (Bottom 25%) earn around $39 per night.
Average Daily Rate (ADR) Trend by Month in Andrés
Get Live Andrés Market Intelligence 👇

Explore Real-time Analytics
Airbnb Seasonality Analysis & Trends in Andrés (2026)
Peak Season (August, June, October)
- Revenue averages $755 per month
- Occupancy rates average 30.2%
- Daily rates average $89
Shoulder Season
- Revenue averages $658 per month
- Occupancy maintains around 29.4%
- Daily rates hold near $89
Low Season (April, May, September)
- Revenue drops to average $534 per month
- Occupancy decreases to average 27.5%
- Daily rates adjust to average $90
Seasonality Insights for Andrés
- The Airbnb seasonality in Andrés shows moderate seasonality with distinct peak and low periods. While the sections above show seasonal averages, it's also insightful to look at the extremes:
- During the high season, the absolute peak month showcases Andrés's highest earning potential, with monthly revenues capable of climbing to $813, occupancy reaching a high of 33.1%, and ADRs peaking at $95.
- Conversely, the slowest single month of the year, typically falling within the low season, marks the market's lowest point. In this month, revenue might dip to $469, occupancy could drop to 25.6%, and ADRs may adjust down to $86.
- Understanding both the seasonal averages and these monthly peaks and troughs in revenue, occupancy, and ADR is crucial for maximizing your Airbnb profit potential in Andrés.
Seasonal Strategies for Maximizing Profit
- Peak Season: Maximize revenue through premium pricing and potentially longer minimum stays. Ensure high availability.
- Low Season: Offer competitive pricing, special promotions (e.g., extended stay discounts), and flexible cancellation policies. Target off-season travelers like remote workers or budget-conscious guests.
- Shoulder Seasons: Implement dynamic pricing that balances peak and low rates. Target weekend travelers or specific events. Offer slightly more flexible terms than peak season.
- Regularly analyze your own performance against these Andrés seasonality benchmarks and adjust your pricing and availability strategy accordingly.
Best Areas for Airbnb Investment in Andrés (2026)
Exploring the top neighborhoods for short-term rentals in Andrés? This section highlights key areas, outlining why they are attractive for hosts and guests, along with notable local attractions. Consider these locations based on your target guest profile and investment strategy.
| Neighborhood / Area | Why Host Here? (Target Guests & Appeal) | Key Attractions & Landmarks |
|---|---|---|
| Punta Cana | Famous resort town known for its beautiful beaches and luxury resorts. A prime destination for tourists looking for an all-inclusive vacation experience, making it ideal for short-term rentals. | Bavaro Beach, Punta Cana Beach, Saona Island, Indigenous Eyes Ecological Park, La Cana Golf Club |
| Santo Domingo Colonial Zone | The historic heart of the Dominican Republic, featuring colonial architecture, rich history, and vibrant culture. It attracts tourists interested in history, culture, and nightlife. | Alcázar de Colón, Catedral Primada de América, Plaza de España, Malecón, Colón Park |
| Bayahibe | A picturesque fishing village close to natural parks and beautiful beaches. Favored by tourists for its proximity to Saona Island and excellent diving spots. | Bayahibe Beach, Saona Island, Parque Nacional del Este, Diving and snorkeling spots, Local seafood restaurants |
| Sosúa | Known for its beautiful beaches and vibrant expatriate community. Popular among tourists seeking a lively atmosphere, with plenty of nightlife and outdoor activities. | Sosúa Beach, Playa Encuentro, Cabarete Beach, Local bars and clubs, Snorkeling and diving opportunities |
| Las Terrenas | A stunning beach town that combines a laid-back Caribbean vibe with chic boutiques and gourmet restaurants. Attracts tourists looking for a mix of relaxation and luxury. | Playa Bonita, Playa Coson, El Limón Waterfall, Local artisan markets, Water sports activities |
| Jarabacoa | Known as the 'Pine Valley', this area is popular for its cooler climate, stunning mountain landscapes, and adventure sports, appealing to both local and international tourists. | Jimenoa Waterfalls, Baiguate Waterfall, Pico Duarte, Adventure sports (rafting, paragliding), Cenotes |
| La Romana | An attractive area known for its golf courses, luxury resorts, and beautiful beaches. It's appealing to both vacationers and those seeking a second home in a tropical setting. | Casa de Campo, Altos de Chavón, La Romana Beach, Teeth of the Dog Golf Course, Cultural events and festivals |
| Boca Chica | Popular beach destination close to Santo Domingo, known for its lively beach scene and water sports. Ideal for tourists looking for a beach getaway without going far from the capital. | Boca Chica Beach, Island of Saona tours, Water sports, Local restaurants, Nightlife |
Understanding Airbnb License Requirements & STR Laws in Andrés (2026)
While Andrés, Santo Domingo, Dominican Republic currently shows low STR regulations, specific Airbnb license requirements might still exist or change. Always verify the latest short term rental regulations and Airbnb license requirements directly with local government authorities for Andrés to ensure full compliance before hosting.
(Source: AirROI data, 2026, based on 2% licensed listings)
Top Performing Airbnb Properties in Andrés (2026)
Benchmark your potential! Explore examples of top-performing Airbnb properties in Andrésbased on Trailing Twelve Month (TTM) revenue. Analyze their characteristics, revenue, occupancy rate, and ADR to understand what drives success in this market.

Villa El Remanso; Boca Chica DR (5 min away Airport)
Entire Place • 5 bedrooms
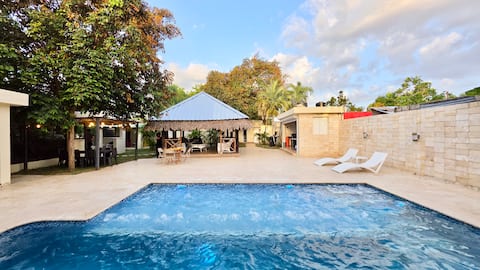
Country House + Pool Billiards BBQ Playground
Entire Place • 3 bedrooms

2 bedrooms splendid apartment with an ocean view
Entire Place • 2 bedrooms
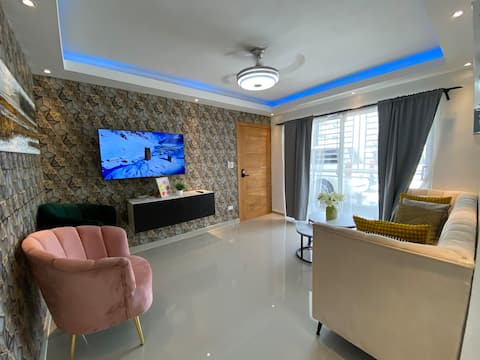
Private Jacuzzi Near Boca Chica Beach
Entire Place • 3 bedrooms
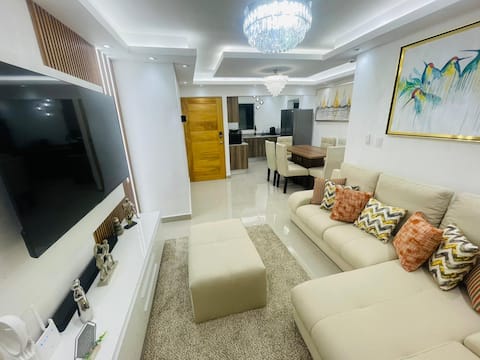
Apartment in Boca Chica,
Entire Place • 3 bedrooms

Home Stop IV | Comfortable | 5 Min. Airport
Entire Place • 3 bedrooms
Note: Performance varies based on location, size, amenities, seasonality, and management quality. Data reflects the past 12 months.
Top Performing Airbnb Hosts in Andrés (2026)
Learn from the best! This table showcases top-performing Airbnb hosts in Andrés based on the number of properties managed and estimated total revenue over the past year. Analyze their scale and performance metrics.
| Host Name | Properties | Grossing Revenue | Stay Reviews | Avg Rating |
|---|---|---|---|---|
| Roberto Ezequiel | 11 | $57,111 | 97 | 4.83/5.0 |
| Phillips | 1 | $39,821 | 194 | 4.76/5.0 |
| Wendy Fernández | Outstanding | 1 | $32,217 | 37 | 4.76/5.0 |
| Victor | 2 | $16,270 | 160 | 4.76/5.0 |
| David Gerardo | 1 | $13,100 | 36 | 4.67/5.0 |
| Omar | 1 | $12,355 | 156 | 4.91/5.0 |
| TSM Rentals SRL | 1 | $11,528 | 148 | 4.91/5.0 |
| Ivette | 1 | $10,736 | 16 | 5.00/5.0 |
| Fausto | 1 | $9,989 | 178 | 4.97/5.0 |
| Shary | 1 | $8,887 | 17 | 4.76/5.0 |
Analyzing the strategies of top hosts, such as their property selection, pricing, and guest communication, can offer valuable lessons for optimizing your own Airbnb operations in Andrés.
Dive Deeper: Advanced Andrés STR Market Data (2026)
Ready to unlock more insights? AirROI provides access to advanced metrics and comprehensive Airbnb data for Andrés. Explore detailed analytics beyond this report to refine your investment strategy, optimize pricing, and maximize your vacation rental profits.
Explore Advanced MetricsAndrés Short-Term Rental Market Composition (2026): Property & Room Types
Room Type Distribution
Property Type Distribution
Market Composition Insights for Andrés
- The Andrés Airbnb market composition is heavily skewed towards Entire Home/Apt listings, which make up 93.3% of the 60 active rentals. This indicates strong guest preference for privacy and space.
- Looking at the property type distribution in Andrés, Apartment/Condo properties are the most common (83.3%), reflecting the local real estate landscape.
- Smaller segments like hotel/boutique (combined 3.3%) offer potential for unique stay experiences.
Andrés Airbnb Room Capacity Analysis (2026): Bedroom Distribution
Distribution of Listings by Number of Bedrooms
Room Capacity Insights for Andrés
- The dominant room capacity in Andrés is 1 bedroom listings, making up 40% of the market. This suggests a strong demand for properties suitable for couples or solo travelers.
- Together, 1 bedroom and 2 bedrooms properties represent 68.3% of the active Airbnb listings in Andrés, indicating a high concentration in these sizes.
- A significant 28.4% of listings offer 3+ bedrooms, catering to larger groups and families seeking more space in Andrés.
Andrés Vacation Rental Guest Capacity Trends (2026)
Distribution of Listings by Guest Capacity
Guest Capacity Insights for Andrés
- The most common guest capacity trend in Andrés vacation rentals is listings accommodating 2 guests (35%). This suggests the primary traveler segment is likely couples or solo travelers.
- Properties designed for 2 guests and 4 guests dominate the Andrés STR market, accounting for 61.7% of listings.
- 28.3% of properties accommodate 6+ guests, serving the market segment for larger families or group travel in Andrés.
- On average, properties in Andrés are equipped to host 3.8 guests.
Andrés Airbnb Booking Patterns (2026): Available vs. Booked Days
Available Days Distribution
Booked Days Distribution
Booking Pattern Insights for Andrés
- The most common availability pattern in Andrés falls within the 271-366 days range, representing 71.7% of listings. This suggests many properties have significant open periods on their calendars.
- Approximately 96.7% of listings show high availability (181+ days open annually), indicating potential for increased bookings or specific owner usage patterns.
- For booked days, the 31-90 days range is most frequent in Andrés (43.3%), reflecting common guest stay durations or potential owner blocking patterns.
- A notable 5.0% of properties secure long booking periods (181+ days booked per year), highlighting successful long-term rental strategies or significant owner usage.
Andrés Airbnb Minimum Stay Requirements Analysis
Distribution of Listings by Minimum Night Requirement
1 Night
38 listings
63.3% of total
2 Nights
12 listings
20% of total
3 Nights
2 listings
3.3% of total
7-29 Nights
1 listings
1.7% of total
30+ Nights
7 listings
11.7% of total
Key Insights
- The most prevalent minimum stay requirement in Andrés is 1 Night, adopted by 63.3% of listings. This highlights the market's preference for shorter, flexible bookings.
- A strong majority (83.3%) of the Andrés Airbnb data shows acceptance of very short stays (1-2 nights), indicating a dynamic, high-turnover market.
- A significant segment (11.7%) caters to monthly stays (30+ nights) in Andrés, pointing to opportunities in the extended-stay market.
Recommendations
- Align with the market by considering a 1 Night minimum stay, as 63.3% of Andrés hosts use this setting.
- Explore offering discounts for stays of 30+ nights to attract the 11.7% of the market seeking extended stays.
- Adjust minimum nights based on seasonality – potentially shorter during low season and longer during peak demand periods in Andrés.
Andrés Airbnb Cancellation Policy Trends Analysis (2026)
Flexible
35 listings
58.3% of total
Moderate
19 listings
31.7% of total
Firm
5 listings
8.3% of total
Strict
1 listings
1.7% of total
Cancellation Policy Insights for Andrés
- The prevailing Airbnb cancellation policy trend in Andrés is Flexible, used by 58.3% of listings.
- The market strongly favors guest-friendly terms, with 90.0% of listings offering Flexible or Moderate policies. This suggests guests in Andrés may expect booking flexibility.
- Strict cancellation policies are quite rare (1.7%), potentially making listings with this policy less competitive unless justified by high demand or property type.
Recommendations for Hosts
- Consider adopting a Flexible policy to align with the 58.3% market standard in Andrés.
- Given the high prevalence of Flexible policies (58.3%), offering this can enhance booking appeal, especially during shoulder seasons.
- Using a Strict policy might deter some guests, as only 1.7% of listings use it. Evaluate if potential revenue protection outweighs possible lower booking rates.
- Regularly review your cancellation policy against competitors and market demand shifts in Andrés.
Andrés STR Booking Lead Time Analysis (2026)
Average Booking Lead Time by Month
Booking Lead Time Insights for Andrés
- The overall average booking lead time for vacation rentals in Andrés is 17 days.
- Guests book furthest in advance for stays during January (average 32 days), likely coinciding with peak travel demand or local events.
- The shortest booking windows occur for stays in August (average 12 days), indicating more last-minute travel plans during this time.
- Seasonally, Winter (22 days avg.) sees the longest lead times, while Summer (15 days avg.) has the shortest, reflecting typical travel planning cycles.
Recommendations for Hosts
- Use the overall average lead time (17 days) as a baseline for your pricing and availability strategy in Andrés.
- For January stays, consider implementing length-of-stay discounts or slightly higher rates for bookings made less than 32 days out to capitalize on advance planning.
- Target marketing efforts for the Winter season well in advance (at least 22 days) to capture early planners.
- Monitor your own booking lead times against these Andrés averages to identify opportunities for dynamic pricing adjustments.
Popular & Essential Airbnb Amenities in Andrés (2026)
Amenity Prevalence
Amenity Insights for Andrés
- Essential amenities in Andrés that guests expect include: Air conditioning, TV, Wifi, Free parking on premises. Lacking these (any) could significantly impact bookings.
- Popular amenities like Kitchen, Refrigerator, Cooking basics are common but not universal. Offering these can provide a competitive edge.
Recommendations for Hosts
- Ensure your listing includes all essential amenities for Andrés: Air conditioning, TV, Wifi, Free parking on premises.
- Prioritize adding missing essentials: Wifi, Free parking on premises.
- Consider adding popular differentiators like Kitchen or Refrigerator to increase appeal.
- Highlight unique or less common amenities you offer (e.g., hot tub, dedicated workspace, EV charger) in your listing description and photos.
- Regularly check competitor amenities in Andrés to stay competitive.
Andrés Airbnb Guest Demographics & Profile Analysis (2026)
Guest Profile Summary for Andrés
- The typical guest profile for Airbnb in Andrés consists of predominantly international visitors (87%), with top international origins including Dominican Republic, typically belonging to the Post-2000s (Gen Z/Alpha) group (50%), primarily speaking Spanish or English.
- Domestic travelers account for 12.8% of guests.
- Key international markets include United States (45.4%) and Dominican Republic (12.8%).
- Top languages spoken are Spanish (41.7%) followed by English (39%).
- A significant demographic segment is the Post-2000s (Gen Z/Alpha) group, representing 50% of guests.
Recommendations for Hosts
- Focus marketing internationally, particularly towards travelers from Dominican Republic.
- Offer listing details and communication support in Spanish.
- Tailor amenities and listing descriptions to appeal to the dominant Post-2000s (Gen Z/Alpha) demographic (e.g., highlight fast WiFi, smart home features, local guides).
- Highlight unique local experiences or amenities relevant to the primary guest profile.
- Consider seasonal promotions aligned with peak travel times for key origin markets.
Nearby Short-Term Rental Market Comparison
How does the Andrés Airbnb market stack up against its neighbors? Compare key performance metrics like average monthly revenue, ADR, and occupancy rates in surrounding areas to understand the broader regional STR landscape.
| Market | Active Properties | Monthly Revenue | Daily Rate | Avg. Occupancy |
|---|---|---|---|---|
| La Romana | 850 | $3,826 | $702.77 | 27% |
| Abreu | 15 | $2,503 | $204.50 | 26% |
| Higüey | 4,126 | $1,786 | $251.99 | 35% |
| Las Terrenas | 2,242 | $1,559 | $225.03 | 32% |
| Las Charcas | 57 | $1,432 | $304.97 | 19% |
| Sosúa | 1,556 | $1,233 | $208.18 | 31% |
| Buena Vista | 22 | $1,170 | $235.10 | 24% |
| Cabarete | 1,025 | $1,066 | $159.24 | 35% |
| Tamboril | 33 | $1,050 | $135.33 | 27% |
| Monte Plata | 17 | $1,033 | $170.06 | 21% |