Pedernales Airbnb Market Analysis 2026: Short Term Rental Data & Vacation Rental Statistics in Puerto nuevo, trudille, Dominican Republic
Is Airbnb profitable in Pedernales in 2026? Explore comprehensive Airbnb analytics for Pedernales, Puerto nuevo, trudille, Dominican Republic to uncover income potential. This 2026 STR market report for Pedernales, based on AirROI data from February 2025 to January 2026, reveals key trends in the niche market of 37 active listings.
Whether you're considering an Airbnb investment in Pedernales, optimizing your existing vacation rental, or exploring rental arbitrage opportunities, understanding the Pedernales Airbnb data is crucial. Leveraging the low regulation environment is key to maximizing your short term rental income potential. Let's dive into the specifics.
Key Pedernales Airbnb Performance Metrics Overview
Monthly Airbnb Revenue Variations & Income Potential in Pedernales (2026)
Understanding the monthly revenue variations for Airbnb listings in Pedernales is key to maximizing your short term rental income potential. Seasonality significantly impacts earnings. Our analysis, based on data from the past 12 months, shows that the peak revenue month for STRs in Pedernales is typically July, while October often presents the lowest earnings, highlighting opportunities for strategic pricing adjustments during shoulder and low seasons. Explore the typical Airbnb income in Pedernales across different performance tiers:
- Best-in-class properties (Top 10%) achieve $1,410+ monthly, often utilizing dynamic pricing and superior guest experiences.
- Strong performing properties (Top 25%) earn $952 or more, indicating effective management and desirable locations/amenities.
- Typical properties (Median) generate around $555 per month, representing the average market performance.
- Entry-level properties (Bottom 25%) see earnings around $373, often with potential for optimization.
Average Monthly Airbnb Earnings Trend in Pedernales
Pedernales Airbnb Occupancy Rate Trends (2026)
Maximize your bookings by understanding the Pedernales STR occupancy trends. Seasonal demand shifts significantly influence how often properties are booked. Typically, Februarysees the highest demand (peak season occupancy), while October experiences the lowest (low season). Effective strategies, like adjusting minimum stays or offering promotions, can boost occupancy during slower periods. Here's how different property tiers perform in Pedernales:
- Best-in-class properties (Top 10%) achieve 27%+ occupancy, indicating high desirability and potentially optimized availability.
- Strong performing properties (Top 25%) maintain 22% or higher occupancy, suggesting good market fit and guest satisfaction.
- Typical properties (Median) have an occupancy rate around 15%.
- Entry-level properties (Bottom 25%) average 9% occupancy, potentially facing higher vacancy.
Average Monthly Occupancy Rate Trend in Pedernales
Average Daily Rate (ADR) Airbnb Trends in Pedernales (2026)
Effective short term rental pricing strategy in Pedernales involves understanding monthly ADR fluctuations. The Average Daily Rate (ADR) for Airbnb in Pedernales typically peaks in April and dips lowest during November. Leveraging Airbnb dynamic pricing tools or strategies based on this seasonality can significantly boost revenue. Here's a look at the typical nightly rates achieved:
- Best-in-class properties (Top 10%) command rates of $235+ per night, often due to premium features or locations.
- Strong performing properties (Top 25%) achieve nightly rates of $185 or more.
- Typical properties (Median) charge around $139 per night.
- Entry-level properties (Bottom 25%) earn around $114 per night.
Average Daily Rate (ADR) Trend by Month in Pedernales
Get Live Pedernales Market Intelligence 👇
Explore Real-time Analytics
Airbnb Seasonality Analysis & Trends in Pedernales (2026)
Peak Season (July, February, August)
- Revenue averages $1,038 per month
- Occupancy rates average 22.1%
- Daily rates average $161
Shoulder Season
- Revenue averages $774 per month
- Occupancy maintains around 16.4%
- Daily rates hold near $157
Low Season (September, October, November)
- Revenue drops to average $358 per month
- Occupancy decreases to average 8.5%
- Daily rates adjust to average $139
Seasonality Insights for Pedernales
- The Airbnb seasonality in Pedernales shows highly seasonal trends requiring careful strategy. While the sections above show seasonal averages, it's also insightful to look at the extremes:
- During the high season, the absolute peak month showcases Pedernales's highest earning potential, with monthly revenues capable of climbing to $1,092, occupancy reaching a high of 23.5%, and ADRs peaking at $166.
- Conversely, the slowest single month of the year, typically falling within the low season, marks the market's lowest point. In this month, revenue might dip to $300, occupancy could drop to 6.8%, and ADRs may adjust down to $135.
- Understanding both the seasonal averages and these monthly peaks and troughs in revenue, occupancy, and ADR is crucial for maximizing your Airbnb profit potential in Pedernales.
Seasonal Strategies for Maximizing Profit
- Peak Season: Maximize revenue through premium pricing and potentially longer minimum stays. Ensure high availability.
- Low Season: Offer competitive pricing, special promotions (e.g., extended stay discounts), and flexible cancellation policies. Target off-season travelers like remote workers or budget-conscious guests.
- Shoulder Seasons: Implement dynamic pricing that balances peak and low rates. Target weekend travelers or specific events. Offer slightly more flexible terms than peak season.
- Regularly analyze your own performance against these Pedernales seasonality benchmarks and adjust your pricing and availability strategy accordingly.
Best Areas for Airbnb Investment in Pedernales (2026)
Exploring the top neighborhoods for short-term rentals in Pedernales? This section highlights key areas, outlining why they are attractive for hosts and guests, along with notable local attractions. Consider these locations based on your target guest profile and investment strategy.
| Neighborhood / Area | Why Host Here? (Target Guests & Appeal) | Key Attractions & Landmarks |
|---|---|---|
| Pedernales City Center | The central area of Pedernales offers local dining and shopping experiences, making it convenient for tourists and a great base for exploring the surrounding natural beauty. | Pedernales Market, Local restaurants, Central Park, Cultural events |
| Jaragua National Park | A major natural attraction featuring stunning landscapes, diverse wildlife, and opportunities for eco-tourism. Perfect for travelers who love nature and outdoor activities. | Los Bahías de las Águilas, Beaches within the park, Hiking trails, Biodiversity tours |
| Puerto Nuevo Beach | Known for its beautiful beaches and calm waters, Puerto Nuevo is ideal for sunbathers and families looking for a beach getaway without the crowds. | Beach activities, Local seafood restaurants, Water sports, Scenic views |
| La Ciénaga | A small fishing village with a laid-back atmosphere and authentic local culture, offering a unique experience to travelers looking to immerse in Dominican life. | Fishing and boating, Local culture, Fresh seafood |
| Cabo Rojo | Famous for its picturesque lighthouse and stunning coastal views, Cabo Rojo draws tourists for photography and scenic experiences. | Cabo Rojo Lighthouse, Beaches, Photography spots |
| Cerro de Maimón | A mountainous area with hiking opportunities and breathtaking views of the coastline, appealing to adventure seekers and nature lovers. | Hiking trails, Panoramic views, Flora and fauna |
| Bahía de las Águilas | Often considered one of the most beautiful beaches in the Caribbean, it attracts visitors for its pristine beauty and relatively untouched environment. | Stunning beach views, Snorkelling, Wildlife sightings, Boat tours |
| Local Cultural Sites | Offering a glimpse into the heritage of the region, these sites attract tourists interested in history and culture, making for enriching stays. | Museums, Historical buildings, Cultural festivals |
Understanding Airbnb License Requirements & STR Laws in Pedernales (2026)
While Pedernales, Puerto nuevo, trudille, Dominican Republic currently shows low STR regulations, specific Airbnb license requirements might still exist or change. Always verify the latest short term rental regulations and Airbnb license requirements directly with local government authorities for Pedernales to ensure full compliance before hosting.
(Source: AirROI data, 2026, finding no licensed listings among those analyzed)
Top Performing Airbnb Properties in Pedernales (2026)
Benchmark your potential! Explore examples of top-performing Airbnb properties in Pedernalesbased on Trailing Twelve Month (TTM) revenue. Analyze their characteristics, revenue, occupancy rate, and ADR to understand what drives success in this market.
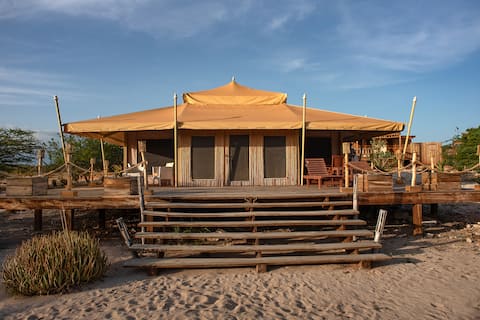
Unique accommodation with a terrace and ocean views
Private Room • 1 bedroom
Glamping Ecolodge Ocean Front Tent (6) Personas
Entire Place • 1 bedroom

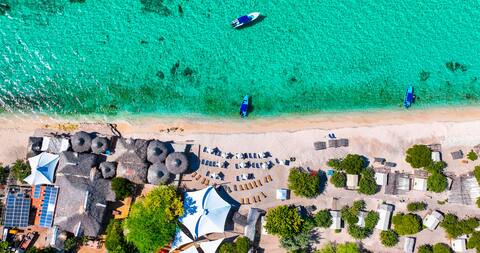
Glamping Ecolodge Ocean Front Tent (6) Personas
Entire Place • 1 bedroom
Glamping Ecolodge Ocean Front Tent (6) Personas
Entire Place • 1 bedroom

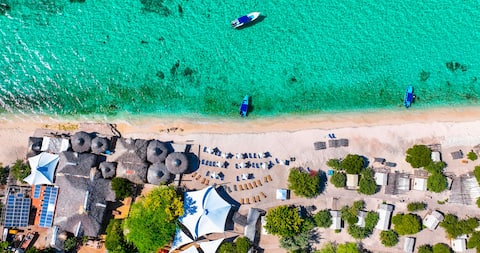
Glamping Ecolodge Ocean Front Tent (4) Personas
Entire Place • 1 bedroom

Glamping Ecolodge Ocean Front Tent (4) Personas
Entire Place • 1 bedroom
Note: Performance varies based on location, size, amenities, seasonality, and management quality. Data reflects the past 12 months.
Top Performing Airbnb Hosts in Pedernales (2026)
Learn from the best! This table showcases top-performing Airbnb hosts in Pedernales based on the number of properties managed and estimated total revenue over the past year. Analyze their scale and performance metrics.
| Host Name | Properties | Grossing Revenue | Stay Reviews | Avg Rating |
|---|---|---|---|---|
| Rancho Típico | 31 | $260,024 | 447 | 4.66/5.0 |
| Eco Del Mar | 6 | $46,915 | 73 | 4.36/5.0 |
Analyzing the strategies of top hosts, such as their property selection, pricing, and guest communication, can offer valuable lessons for optimizing your own Airbnb operations in Pedernales.
Dive Deeper: Advanced Pedernales STR Market Data (2026)
Ready to unlock more insights? AirROI provides access to advanced metrics and comprehensive Airbnb data for Pedernales. Explore detailed analytics beyond this report to refine your investment strategy, optimize pricing, and maximize your vacation rental profits.
Explore Advanced MetricsPedernales Short-Term Rental Market Composition (2026): Property & Room Types
Room Type Distribution
Property Type Distribution
Market Composition Insights for Pedernales
- The Pedernales Airbnb market composition is heavily skewed towards Entire Home/Apt listings, which make up 75.7% of the 37 active rentals. This indicates strong guest preference for privacy and space.
- Looking at the property type distribution in Pedernales, Outdoor/Unique properties are the most common (94.6%), reflecting the local real estate landscape.
- The presence of 5.4% Hotel/Boutique listings indicates integration with traditional hospitality.
Pedernales Airbnb Room Capacity Analysis (2026): Bedroom Distribution
Distribution of Listings by Number of Bedrooms
Room Capacity Insights for Pedernales
- The dominant room capacity in Pedernales is 1 bedroom listings, making up 100% of the market. This suggests a strong demand for properties suitable for couples or solo travelers.
- With over half the market (100%) consisting of studios or 1-bedroom units, Pedernales is particularly well-suited for individuals or couples.
Pedernales Vacation Rental Guest Capacity Trends (2026)
Distribution of Listings by Guest Capacity
Guest Capacity Insights for Pedernales
- The most common guest capacity trend in Pedernales vacation rentals is listings accommodating 2 guests (43.2%). This suggests the primary traveler segment is likely couples or solo travelers.
- Properties designed for 2 guests and 4 guests dominate the Pedernales STR market, accounting for 75.6% of listings.
- A significant 43.2% of listings cater specifically to 1-2 guests, highlighting strong demand from couples and solo travelers in Pedernales.
- 24.3% of properties accommodate 6+ guests, serving the market segment for larger families or group travel in Pedernales.
- On average, properties in Pedernales are equipped to host 3.6 guests.
Pedernales Airbnb Booking Patterns (2026): Available vs. Booked Days
Available Days Distribution
Booked Days Distribution
Booking Pattern Insights for Pedernales
- The most common availability pattern in Pedernales falls within the 271-366 days range, representing 100% of listings. This suggests many properties have significant open periods on their calendars.
- Approximately 100.0% of listings show high availability (181+ days open annually), indicating potential for increased bookings or specific owner usage patterns.
- For booked days, the 31-90 days range is most frequent in Pedernales (81.1%), reflecting common guest stay durations or potential owner blocking patterns.
Pedernales Airbnb Minimum Stay Requirements Analysis
Distribution of Listings by Minimum Night Requirement
1 Night
37 listings
100% of total
Key Insights
- The most prevalent minimum stay requirement in Pedernales is 1 Night, adopted by 100% of listings. This highlights the market's preference for shorter, flexible bookings.
- A strong majority (100.0%) of the Pedernales Airbnb data shows acceptance of very short stays (1-2 nights), indicating a dynamic, high-turnover market.
Recommendations
- Align with the market by considering a 1 Night minimum stay, as 100% of Pedernales hosts use this setting.
- Adjust minimum nights based on seasonality – potentially shorter during low season and longer during peak demand periods in Pedernales.
Pedernales Airbnb Cancellation Policy Trends Analysis (2026)
Super Strict 60 Days
31 listings
83.8% of total
Flexible
3 listings
8.1% of total
Moderate
3 listings
8.1% of total
Cancellation Policy Insights for Pedernales
- The prevailing Airbnb cancellation policy trend in Pedernales is Super Strict 60 Days, used by 83.8% of listings.
- There's a relatively balanced mix between guest-friendly (16.2%) and stricter (0.0%) policies, offering choices for different guest needs.
Recommendations for Hosts
- Consider adopting a Super Strict 60 Days policy to align with the 83.8% market standard in Pedernales.
- Regularly review your cancellation policy against competitors and market demand shifts in Pedernales.
Pedernales STR Booking Lead Time Analysis (2026)
Average Booking Lead Time by Month
Booking Lead Time Insights for Pedernales
- The overall average booking lead time for vacation rentals in Pedernales is 38 days.
- Guests book furthest in advance for stays during September (average 72 days), likely coinciding with peak travel demand or local events.
- The shortest booking windows occur for stays in March (average 12 days), indicating more last-minute travel plans during this time.
- Seasonally, Fall (46 days avg.) sees the longest lead times, while Spring (22 days avg.) has the shortest, reflecting typical travel planning cycles.
Recommendations for Hosts
- Use the overall average lead time (38 days) as a baseline for your pricing and availability strategy in Pedernales.
- For September stays, consider implementing length-of-stay discounts or slightly higher rates for bookings made less than 72 days out to capitalize on advance planning.
- During March, focus on last-minute booking availability and promotions, as guests book with very short notice (12 days avg.).
- Target marketing efforts for the Fall season well in advance (at least 46 days) to capture early planners.
- Monitor your own booking lead times against these Pedernales averages to identify opportunities for dynamic pricing adjustments.
Popular & Essential Airbnb Amenities in Pedernales (2026)
Amenity Prevalence
Amenity Insights for Pedernales
- Popular amenities like Dedicated workspace, Breakfast, Fire extinguisher are common but not universal. Offering these can provide a competitive edge.
- Warning: Wifi is not universally provided but is considered essential globally. Ensure reliable Wifi is offered.
Recommendations for Hosts
- Consider adding popular differentiators like Dedicated workspace or Breakfast to increase appeal.
- Highlight unique or less common amenities you offer (e.g., hot tub, dedicated workspace, EV charger) in your listing description and photos.
- Regularly check competitor amenities in Pedernales to stay competitive.
Pedernales Airbnb Guest Demographics & Profile Analysis (2026)
Guest Profile Summary for Pedernales
- The typical guest profile for Airbnb in Pedernales consists of predominantly international visitors (81%), with top international origins including Dominican Republic, typically belonging to the Post-2000s (Gen Z/Alpha) group (50%), primarily speaking Spanish or English.
- Domestic travelers account for 19.0% of guests.
- Key international markets include United States (45.6%) and Dominican Republic (19%).
- Top languages spoken are Spanish (39.6%) followed by English (37.8%).
- A significant demographic segment is the Post-2000s (Gen Z/Alpha) group, representing 50% of guests.
Recommendations for Hosts
- Focus marketing internationally, particularly towards travelers from Dominican Republic.
- Offer listing details and communication support in Spanish.
- Tailor amenities and listing descriptions to appeal to the dominant Post-2000s (Gen Z/Alpha) demographic (e.g., highlight fast WiFi, smart home features, local guides).
- Highlight unique local experiences or amenities relevant to the primary guest profile.
- Consider seasonal promotions aligned with peak travel times for key origin markets.
Nearby Short-Term Rental Market Comparison
How does the Pedernales Airbnb market stack up against its neighbors? Compare key performance metrics like average monthly revenue, ADR, and occupancy rates in surrounding areas to understand the broader regional STR landscape.
| Market | Active Properties | Monthly Revenue | Daily Rate | Avg. Occupancy |
|---|---|---|---|---|
| Juan Esteban | 12 | $1,703 | $346.19 | 21% |
| Las Charcas | 57 | $1,432 | $304.97 | 19% |
| La Sabina | 53 | $931 | $205.86 | 17% |
| Villa Altagracia | 24 | $917 | $240.40 | 18% |
| Tireo al Medio | 10 | $916 | $124.63 | 29% |
| Piedra Blanca | 21 | $912 | $254.92 | 21% |
| Pedro Brand | 59 | $887 | $238.32 | 21% |
| Bonao | 146 | $882 | $116.71 | 32% |
| Sabana Grande de Palenque | 15 | $774 | $163.20 | 23% |
| San José de Ocoa | 18 | $723 | $185.46 | 19% |