Cabrera Airbnb Market Analysis 2026: Short Term Rental Data & Vacation Rental Statistics in María Trinidad Sánchez, Dominican Republic
Is Airbnb profitable in Cabrera in 2026? Explore comprehensive Airbnb analytics for Cabrera, María Trinidad Sánchez, Dominican Republic to uncover income potential. This 2026 STR market report for Cabrera, based on AirROI data from February 2025 to January 2026, reveals key trends in the niche market of 170 active listings.
Whether you're considering an Airbnb investment in Cabrera, optimizing your existing vacation rental, or exploring rental arbitrage opportunities, understanding the Cabrera Airbnb data is crucial. Leveraging the low regulation environment is key to maximizing your short term rental income potential. Let's dive into the specifics.
Key Cabrera Airbnb Performance Metrics Overview
Monthly Airbnb Revenue Variations & Income Potential in Cabrera (2026)
Understanding the monthly revenue variations for Airbnb listings in Cabrera is key to maximizing your short term rental income potential. Seasonality significantly impacts earnings. Our analysis, based on data from the past 12 months, shows that the peak revenue month for STRs in Cabrera is typically July, while September often presents the lowest earnings, highlighting opportunities for strategic pricing adjustments during shoulder and low seasons. Explore the typical Airbnb income in Cabrera across different performance tiers:
- Best-in-class properties (Top 10%) achieve $3,410+ monthly, often utilizing dynamic pricing and superior guest experiences.
- Strong performing properties (Top 25%) earn $1,800 or more, indicating effective management and desirable locations/amenities.
- Typical properties (Median) generate around $877 per month, representing the average market performance.
- Entry-level properties (Bottom 25%) see earnings around $418, often with potential for optimization.
Average Monthly Airbnb Earnings Trend in Cabrera
Cabrera Airbnb Occupancy Rate Trends (2026)
Maximize your bookings by understanding the Cabrera STR occupancy trends. Seasonal demand shifts significantly influence how often properties are booked. Typically, Februarysees the highest demand (peak season occupancy), while October experiences the lowest (low season). Effective strategies, like adjusting minimum stays or offering promotions, can boost occupancy during slower periods. Here's how different property tiers perform in Cabrera:
- Best-in-class properties (Top 10%) achieve 54%+ occupancy, indicating high desirability and potentially optimized availability.
- Strong performing properties (Top 25%) maintain 33% or higher occupancy, suggesting good market fit and guest satisfaction.
- Typical properties (Median) have an occupancy rate around 19%.
- Entry-level properties (Bottom 25%) average 10% occupancy, potentially facing higher vacancy.
Average Monthly Occupancy Rate Trend in Cabrera
Average Daily Rate (ADR) Airbnb Trends in Cabrera (2026)
Effective short term rental pricing strategy in Cabrera involves understanding monthly ADR fluctuations. The Average Daily Rate (ADR) for Airbnb in Cabrera typically peaks in September and dips lowest during March. Leveraging Airbnb dynamic pricing tools or strategies based on this seasonality can significantly boost revenue. Here's a look at the typical nightly rates achieved:
- Best-in-class properties (Top 10%) command rates of $414+ per night, often due to premium features or locations.
- Strong performing properties (Top 25%) achieve nightly rates of $234 or more.
- Typical properties (Median) charge around $138 per night.
- Entry-level properties (Bottom 25%) earn around $86 per night.
Average Daily Rate (ADR) Trend by Month in Cabrera
Get Live Cabrera Market Intelligence 👇

Explore Real-time Analytics
Airbnb Seasonality Analysis & Trends in Cabrera (2026)
Peak Season (July, June, August)
- Revenue averages $1,965 per month
- Occupancy rates average 27.7%
- Daily rates average $251
Shoulder Season
- Revenue averages $1,553 per month
- Occupancy maintains around 23.1%
- Daily rates hold near $251
Low Season (February, May, September)
- Revenue drops to average $1,250 per month
- Occupancy decreases to average 25.5%
- Daily rates adjust to average $255
Seasonality Insights for Cabrera
- The Airbnb seasonality in Cabrera shows moderate seasonality with distinct peak and low periods. While the sections above show seasonal averages, it's also insightful to look at the extremes:
- During the high season, the absolute peak month showcases Cabrera's highest earning potential, with monthly revenues capable of climbing to $2,068, occupancy reaching a high of 31.7%, and ADRs peaking at $266.
- Conversely, the slowest single month of the year, typically falling within the low season, marks the market's lowest point. In this month, revenue might dip to $1,236, occupancy could drop to 20.5%, and ADRs may adjust down to $246.
- Understanding both the seasonal averages and these monthly peaks and troughs in revenue, occupancy, and ADR is crucial for maximizing your Airbnb profit potential in Cabrera.
Seasonal Strategies for Maximizing Profit
- Peak Season: Maximize revenue through premium pricing and potentially longer minimum stays. Ensure high availability.
- Low Season: Offer competitive pricing, special promotions (e.g., extended stay discounts), and flexible cancellation policies. Target off-season travelers like remote workers or budget-conscious guests.
- Shoulder Seasons: Implement dynamic pricing that balances peak and low rates. Target weekend travelers or specific events. Offer slightly more flexible terms than peak season.
- Regularly analyze your own performance against these Cabrera seasonality benchmarks and adjust your pricing and availability strategy accordingly.
Best Areas for Airbnb Investment in Cabrera (2026)
Exploring the top neighborhoods for short-term rentals in Cabrera? This section highlights key areas, outlining why they are attractive for hosts and guests, along with notable local attractions. Consider these locations based on your target guest profile and investment strategy.
| Neighborhood / Area | Why Host Here? (Target Guests & Appeal) | Key Attractions & Landmarks |
|---|---|---|
| Cabrera Beach | A beautiful beach destination known for its clear waters and tranquil atmosphere. It's perfect for tourists looking for relaxation and sun. | Cabrera Beach, La Entrada Beach, Playa Grande, Río San Juan, Scuba diving spots |
| Cabrera Town Center | The heart of Cabrera with local shops, eateries, and cultural experiences. Great for visitors who want to immerse themselves in Dominican culture. | Cabrera Central Park, Local markets, Restaurants and cafés, Artisan shops, Cultural festivals |
| Playa Grande | Renowned for its stunning coastline and great surf. A hotspot for adventure seekers and beach lovers alike. | Playa Grande Beach, Surf spots, Beach clubs, Ecotourism sites, Natural pools |
| Río San Juan | A neighboring town with lush landscapes and beautiful beaches. Ideal for nature lovers and those seeking adventure. | Dudú Lagoon, Laguna Gri Gri, Caves of Cabarete, Scenic viewpoints, Water sports |
| Sabaneta | A quaint village close to Cabrera with a more local feel. Good for those wanting to experience the everyday Dominican lifestyle. | Local farms, Community gatherings, Rural tourism, Cultural events |
| Las Terrenas | A bit further afield but known for its stunning beaches and vibrant expat community. Very popular for vacation rentals. | Beautiful beaches, Water activities, Nightlife, Restaurants, Sunset views |
| La Entrada | A small beach town offering a more relaxed atmosphere and close proximity to nature, appealing to eco-tourists. | Quiet beaches, Nature trails, Local wildlife, Fishing spots, Friendly local community |
| Playa Caleton | A picturesque beach often less crowded, perfect for those seeking peace and quiet while enjoying the sea. | Caleton Beach, Secluded spots, Swimming, Picnic areas, Relaxation spots |
Understanding Airbnb License Requirements & STR Laws in Cabrera (2026)
While Cabrera, María Trinidad Sánchez, Dominican Republic currently shows low STR regulations, specific Airbnb license requirements might still exist or change. Always verify the latest short term rental regulations and Airbnb license requirements directly with local government authorities for Cabrera to ensure full compliance before hosting.
(Source: AirROI data, 2026, based on 1% licensed listings)
Top Performing Airbnb Properties in Cabrera (2026)
Benchmark your potential! Explore examples of top-performing Airbnb properties in Cabrerabased on Trailing Twelve Month (TTM) revenue. Analyze their characteristics, revenue, occupancy rate, and ADR to understand what drives success in this market.
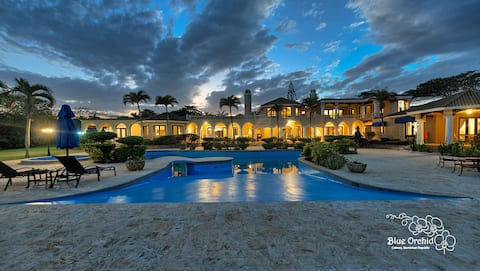
Luxury Private Oceanfront Villa Blue Orchid
Entire Place • 9 bedrooms

Casa Kimball
Entire Place • 8 bedrooms

Beachfront Villa in Orchid Bay-Cabrera
Entire Place • 6 bedrooms

Casa Grandview king bed pool and ocean view!
Entire Place • 4 bedrooms

Villa Oceanfront steps to Beach-Family & Friends
Entire Place • 5 bedrooms
Amelia villa Comfortable and Majestic view
Entire Place • 6 bedrooms
Note: Performance varies based on location, size, amenities, seasonality, and management quality. Data reflects the past 12 months.
Top Performing Airbnb Hosts in Cabrera (2026)
Learn from the best! This table showcases top-performing Airbnb hosts in Cabrera based on the number of properties managed and estimated total revenue over the past year. Analyze their scale and performance metrics.
| Host Name | Properties | Grossing Revenue | Stay Reviews | Avg Rating |
|---|---|---|---|---|
| Vickie | 1 | $113,614 | 17 | 4.88/5.0 |
| Spencer | 1 | $103,665 | 1 | Not Rated |
| Andy | 6 | $97,907 | 137 | 4.77/5.0 |
| Adieurys | 2 | $93,914 | 2 | Not Rated |
| Elena | 14 | $64,031 | 105 | 4.79/5.0 |
| Nadesha | 3 | $62,477 | 12 | 4.61/5.0 |
| Juan Carlos | 3 | $50,801 | 181 | 4.98/5.0 |
| Carmen | 2 | $47,713 | 2 | Not Rated |
| Franny | 2 | $46,497 | 52 | 5.00/5.0 |
| Carlos | 1 | $44,977 | 103 | 4.83/5.0 |
Analyzing the strategies of top hosts, such as their property selection, pricing, and guest communication, can offer valuable lessons for optimizing your own Airbnb operations in Cabrera.
Dive Deeper: Advanced Cabrera STR Market Data (2026)
Ready to unlock more insights? AirROI provides access to advanced metrics and comprehensive Airbnb data for Cabrera. Explore detailed analytics beyond this report to refine your investment strategy, optimize pricing, and maximize your vacation rental profits.
Explore Advanced MetricsCabrera Short-Term Rental Market Composition (2026): Property & Room Types
Room Type Distribution
Property Type Distribution
Market Composition Insights for Cabrera
- The Cabrera Airbnb market composition is heavily skewed towards Entire Home/Apt listings, which make up 83.5% of the 170 active rentals. This indicates strong guest preference for privacy and space.
- Looking at the property type distribution in Cabrera, House properties are the most common (62.9%), reflecting the local real estate landscape.
- Houses represent a significant 62.9% portion, catering likely to families or larger groups.
- The presence of 13.5% Hotel/Boutique listings indicates integration with traditional hospitality.
- Smaller segments like unique stays, others, outdoor/unique (combined 3.0%) offer potential for unique stay experiences.
Cabrera Airbnb Room Capacity Analysis (2026): Bedroom Distribution
Distribution of Listings by Number of Bedrooms
Room Capacity Insights for Cabrera
- The dominant room capacity in Cabrera is 2 bedrooms listings, making up 24.7% of the market. This suggests a strong demand for properties suitable for couples or solo travelers.
- Together, 2 bedrooms and 3 bedrooms properties represent 48.2% of the active Airbnb listings in Cabrera, indicating a high concentration in these sizes.
- A significant 54.1% of listings offer 3+ bedrooms, catering to larger groups and families seeking more space in Cabrera.
Cabrera Vacation Rental Guest Capacity Trends (2026)
Distribution of Listings by Guest Capacity
Guest Capacity Insights for Cabrera
- The most common guest capacity trend in Cabrera vacation rentals is listings accommodating 8+ guests (38.8%). This suggests the primary traveler segment is likely larger groups.
- Properties designed for 8+ guests and 4 guests dominate the Cabrera STR market, accounting for 55.9% of listings.
- 61.2% of properties accommodate 6+ guests, serving the market segment for larger families or group travel in Cabrera.
- On average, properties in Cabrera are equipped to host 5.6 guests.
Cabrera Airbnb Booking Patterns (2026): Available vs. Booked Days
Available Days Distribution
Booked Days Distribution
Booking Pattern Insights for Cabrera
- The most common availability pattern in Cabrera falls within the 271-366 days range, representing 83.5% of listings. This suggests many properties have significant open periods on their calendars.
- Approximately 97.0% of listings show high availability (181+ days open annually), indicating potential for increased bookings or specific owner usage patterns.
- For booked days, the 1-30 days range is most frequent in Cabrera (47.1%), reflecting common guest stay durations or potential owner blocking patterns.
- A notable 2.9% of properties secure long booking periods (181+ days booked per year), highlighting successful long-term rental strategies or significant owner usage.
Cabrera Airbnb Minimum Stay Requirements Analysis
Distribution of Listings by Minimum Night Requirement
1 Night
85 listings
50% of total
2 Nights
49 listings
28.8% of total
3 Nights
2 listings
1.2% of total
4-6 Nights
3 listings
1.8% of total
30+ Nights
31 listings
18.2% of total
Key Insights
- The most prevalent minimum stay requirement in Cabrera is 1 Night, adopted by 50% of listings. This highlights the market's preference for shorter, flexible bookings.
- A strong majority (78.8%) of the Cabrera Airbnb data shows acceptance of very short stays (1-2 nights), indicating a dynamic, high-turnover market.
- A significant segment (18.2%) caters to monthly stays (30+ nights) in Cabrera, pointing to opportunities in the extended-stay market.
Recommendations
- Align with the market by considering a 1 Night minimum stay, as 50% of Cabrera hosts use this setting.
- Explore offering discounts for stays of 30+ nights to attract the 18.2% of the market seeking extended stays.
- Adjust minimum nights based on seasonality – potentially shorter during low season and longer during peak demand periods in Cabrera.
Cabrera Airbnb Cancellation Policy Trends Analysis (2026)
Limited
1 listings
0.6% of total
Super Strict 60 Days
1 listings
0.6% of total
Flexible
71 listings
41.8% of total
Moderate
48 listings
28.2% of total
Firm
39 listings
22.9% of total
Strict
10 listings
5.9% of total
Cancellation Policy Insights for Cabrera
- The prevailing Airbnb cancellation policy trend in Cabrera is Flexible, used by 41.8% of listings.
- There's a relatively balanced mix between guest-friendly (70.0%) and stricter (28.8%) policies, offering choices for different guest needs.
- Strict cancellation policies are quite rare (5.9%), potentially making listings with this policy less competitive unless justified by high demand or property type.
Recommendations for Hosts
- Consider adopting a Flexible policy to align with the 41.8% market standard in Cabrera.
- Using a Strict policy might deter some guests, as only 5.9% of listings use it. Evaluate if potential revenue protection outweighs possible lower booking rates.
- Regularly review your cancellation policy against competitors and market demand shifts in Cabrera.
Cabrera STR Booking Lead Time Analysis (2026)
Average Booking Lead Time by Month
Booking Lead Time Insights for Cabrera
- The overall average booking lead time for vacation rentals in Cabrera is 34 days.
- Guests book furthest in advance for stays during April (average 46 days), likely coinciding with peak travel demand or local events.
- The shortest booking windows occur for stays in May (average 16 days), indicating more last-minute travel plans during this time.
- Seasonally, Fall (36 days avg.) sees the longest lead times, while Summer (24 days avg.) has the shortest, reflecting typical travel planning cycles.
Recommendations for Hosts
- Use the overall average lead time (34 days) as a baseline for your pricing and availability strategy in Cabrera.
- For April stays, consider implementing length-of-stay discounts or slightly higher rates for bookings made less than 46 days out to capitalize on advance planning.
- Target marketing efforts for the Fall season well in advance (at least 36 days) to capture early planners.
- Monitor your own booking lead times against these Cabrera averages to identify opportunities for dynamic pricing adjustments.
Popular & Essential Airbnb Amenities in Cabrera (2026)
Amenity Prevalence
Amenity Insights for Cabrera
- Essential amenities in Cabrera that guests expect include: Wifi. Lacking these (this) could significantly impact bookings.
- Popular amenities like Free parking on premises, Air conditioning, Kitchen are common but not universal. Offering these can provide a competitive edge.
- A pool is a highly desired but not standard amenity, making it a key feature for attracting guests seeking leisure in Cabrera.
Recommendations for Hosts
- Ensure your listing includes all essential amenities for Cabrera: Wifi.
- Consider adding popular differentiators like Free parking on premises or Air conditioning to increase appeal.
- Highlight unique or less common amenities you offer (e.g., hot tub, dedicated workspace, EV charger) in your listing description and photos.
- Regularly check competitor amenities in Cabrera to stay competitive.
Cabrera Airbnb Guest Demographics & Profile Analysis (2026)
Guest Profile Summary for Cabrera
- The typical guest profile for Airbnb in Cabrera consists of a mix of domestic (45%) and international guests, with top international origins including United States, typically belonging to the Post-2000s (Gen Z/Alpha) group (50%), primarily speaking Spanish or English.
- Domestic travelers account for 45.3% of guests.
- Key international markets include Dominican Republic (45.3%) and United States (39.5%).
- Top languages spoken are Spanish (46.7%) followed by English (40.9%).
- A significant demographic segment is the Post-2000s (Gen Z/Alpha) group, representing 50% of guests.
Recommendations for Hosts
- Balance marketing efforts between domestic and international channels based on the guest mix.
- Tailor amenities and listing descriptions to appeal to the dominant Post-2000s (Gen Z/Alpha) demographic (e.g., highlight fast WiFi, smart home features, local guides).
- Highlight unique local experiences or amenities relevant to the primary guest profile.
- Consider seasonal promotions aligned with peak travel times for key origin markets.
Nearby Short-Term Rental Market Comparison
How does the Cabrera Airbnb market stack up against its neighbors? Compare key performance metrics like average monthly revenue, ADR, and occupancy rates in surrounding areas to understand the broader regional STR landscape.
| Market | Active Properties | Monthly Revenue | Daily Rate | Avg. Occupancy |
|---|---|---|---|---|
| La Romana | 850 | $3,826 | $702.77 | 27% |
| Abreu | 15 | $2,503 | $204.50 | 26% |
| Higüey | 4,126 | $1,786 | $251.99 | 35% |
| Las Terrenas | 2,242 | $1,559 | $225.03 | 32% |
| Las Charcas | 57 | $1,432 | $304.97 | 19% |
| Sosúa | 1,556 | $1,233 | $208.18 | 31% |
| Buena Vista | 22 | $1,170 | $235.10 | 24% |
| Cabarete | 1,025 | $1,066 | $159.24 | 35% |
| Tamboril | 33 | $1,050 | $135.33 | 27% |
| Monte Plata | 17 | $1,033 | $170.06 | 21% |