Manabao Airbnb Market Analysis 2026: Short Term Rental Data & Vacation Rental Statistics in La Vega, Dominican Republic
Is Airbnb profitable in Manabao in 2026? Explore comprehensive Airbnb analytics for Manabao, La Vega, Dominican Republic to uncover income potential. This 2026 STR market report for Manabao, based on AirROI data from February 2025 to January 2026, reveals key trends in the niche market of 20 active listings.
Whether you're considering an Airbnb investment in Manabao, optimizing your existing vacation rental, or exploring rental arbitrage opportunities, understanding the Manabao Airbnb data is crucial. Leveraging the low regulation environment is key to maximizing your short term rental income potential. Let's dive into the specifics.
Key Manabao Airbnb Performance Metrics Overview
Monthly Airbnb Revenue Variations & Income Potential in Manabao (2026)
Understanding the monthly revenue variations for Airbnb listings in Manabao is key to maximizing your short term rental income potential. Seasonality significantly impacts earnings. Our analysis, based on data from the past 12 months, shows that the peak revenue month for STRs in Manabao is typically April, while June often presents the lowest earnings, highlighting opportunities for strategic pricing adjustments during shoulder and low seasons. Explore the typical Airbnb income in Manabao across different performance tiers:
- Best-in-class properties (Top 10%) achieve $2,178+ monthly, often utilizing dynamic pricing and superior guest experiences.
- Strong performing properties (Top 25%) earn $949 or more, indicating effective management and desirable locations/amenities.
- Typical properties (Median) generate around $460 per month, representing the average market performance.
- Entry-level properties (Bottom 25%) see earnings around $277, often with potential for optimization.
Average Monthly Airbnb Earnings Trend in Manabao
Manabao Airbnb Occupancy Rate Trends (2026)
Maximize your bookings by understanding the Manabao STR occupancy trends. Seasonal demand shifts significantly influence how often properties are booked. Typically, Septembersees the highest demand (peak season occupancy), while May experiences the lowest (low season). Effective strategies, like adjusting minimum stays or offering promotions, can boost occupancy during slower periods. Here's how different property tiers perform in Manabao:
- Best-in-class properties (Top 10%) achieve 52%+ occupancy, indicating high desirability and potentially optimized availability.
- Strong performing properties (Top 25%) maintain 31% or higher occupancy, suggesting good market fit and guest satisfaction.
- Typical properties (Median) have an occupancy rate around 13%.
- Entry-level properties (Bottom 25%) average 8% occupancy, potentially facing higher vacancy.
Average Monthly Occupancy Rate Trend in Manabao
Average Daily Rate (ADR) Airbnb Trends in Manabao (2026)
Effective short term rental pricing strategy in Manabao involves understanding monthly ADR fluctuations. The Average Daily Rate (ADR) for Airbnb in Manabao typically peaks in June and dips lowest during January. Leveraging Airbnb dynamic pricing tools or strategies based on this seasonality can significantly boost revenue. Here's a look at the typical nightly rates achieved:
- Best-in-class properties (Top 10%) command rates of $275+ per night, often due to premium features or locations.
- Strong performing properties (Top 25%) achieve nightly rates of $214 or more.
- Typical properties (Median) charge around $117 per night.
- Entry-level properties (Bottom 25%) earn around $72 per night.
Average Daily Rate (ADR) Trend by Month in Manabao
Get Live Manabao Market Intelligence 👇

Explore Real-time Analytics
Airbnb Seasonality Analysis & Trends in Manabao (2026)
Peak Season (April, September, August)
- Revenue averages $1,336 per month
- Occupancy rates average 24.1%
- Daily rates average $153
Shoulder Season
- Revenue averages $822 per month
- Occupancy maintains around 21.1%
- Daily rates hold near $146
Low Season (May, June, October)
- Revenue drops to average $547 per month
- Occupancy decreases to average 18.7%
- Daily rates adjust to average $153
Seasonality Insights for Manabao
- The Airbnb seasonality in Manabao shows highly seasonal trends requiring careful strategy. While the sections above show seasonal averages, it's also insightful to look at the extremes:
- During the high season, the absolute peak month showcases Manabao's highest earning potential, with monthly revenues capable of climbing to $1,350, occupancy reaching a high of 26.7%, and ADRs peaking at $159.
- Conversely, the slowest single month of the year, typically falling within the low season, marks the market's lowest point. In this month, revenue might dip to $528, occupancy could drop to 8.6%, and ADRs may adjust down to $136.
- Understanding both the seasonal averages and these monthly peaks and troughs in revenue, occupancy, and ADR is crucial for maximizing your Airbnb profit potential in Manabao.
Seasonal Strategies for Maximizing Profit
- Peak Season: Maximize revenue through premium pricing and potentially longer minimum stays. Ensure high availability.
- Low Season: Offer competitive pricing, special promotions (e.g., extended stay discounts), and flexible cancellation policies. Target off-season travelers like remote workers or budget-conscious guests.
- Shoulder Seasons: Implement dynamic pricing that balances peak and low rates. Target weekend travelers or specific events. Offer slightly more flexible terms than peak season.
- Regularly analyze your own performance against these Manabao seasonality benchmarks and adjust your pricing and availability strategy accordingly.
Best Areas for Airbnb Investment in Manabao (2026)
Exploring the top neighborhoods for short-term rentals in Manabao? This section highlights key areas, outlining why they are attractive for hosts and guests, along with notable local attractions. Consider these locations based on your target guest profile and investment strategy.
| Neighborhood / Area | Why Host Here? (Target Guests & Appeal) | Key Attractions & Landmarks |
|---|---|---|
| La Nevera | A serene, picturesque spot in Manabao known for its beautiful natural scenery and cool climate. It's perfect for tourists seeking relaxation and outdoor adventures such as hiking and birdwatching. | Cascada de Baiguate, Parque Nacional Jaragua, Hiking trails, Birdwatching spots, Natural pools |
| El Patio | Popular among locals and visitors, this area offers a charming community atmosphere with easy access to local cuisine and shops. It’s ideal for travelers wanting a local experience. | Local restaurants, Artisan markets, Cultural festivals, Community events |
| Los Alpes de Manabao | Famous for its breathtaking views and cooler temperatures, Los Alpes is gaining interest for eco-tourism and those wanting to escape the heat of the coast. | Coffee plantations, Scenic viewpoints, Hiking opportunities, Eco-lodges |
| La Salada | A vibrant area close to natural wonders and adventure, favored by tourists seeking outdoor activities such as river rafting and trekking. | Río Yaque del Norte, Adventure sports, Picnic areas, Waterfalls |
| Cerro de la Vieja | Known for its stunning landscapes and wildlife, an ideal destination for eco-conscious travelers and nature enthusiasts who wish to explore the rich biodiversity. | Birdwatching, Ecological parks, Local flora and fauna, Nature trails |
| Manabao Center | The main hub of the town, offering various amenities, local shops, and services. It’s convenient for guests who prefer easy access to daily necessities. | Local shops, Cafes, Community center, Market days |
| Reserva Científica Ébano Verde | A unique investment for those looking to cater to eco-tourists, this area has rich biodiversity and guided tours to explore its natural beauty. | Scientific research tours, Nature walks, Exotic species of flora and fauna, Local guides |
| Las Cabral | A quiet, rural area that provides an authentic Dominican experience, attracting visitors interested in the local culture and lifestyle. | Traditional villages, Cultural immersion experiences, Local farms, Handicraft markets |
Understanding Airbnb License Requirements & STR Laws in Manabao (2026)
While Manabao, La Vega, Dominican Republic currently shows low STR regulations, specific Airbnb license requirements might still exist or change. Always verify the latest short term rental regulations and Airbnb license requirements directly with local government authorities for Manabao to ensure full compliance before hosting.
(Source: AirROI data, 2026, finding no licensed listings among those analyzed)
Top Performing Airbnb Properties in Manabao (2026)
Benchmark your potential! Explore examples of top-performing Airbnb properties in Manabaobased on Trailing Twelve Month (TTM) revenue. Analyze their characteristics, revenue, occupancy rate, and ADR to understand what drives success in this market.
Casa Nube 1000
Entire Place • 3 bedrooms

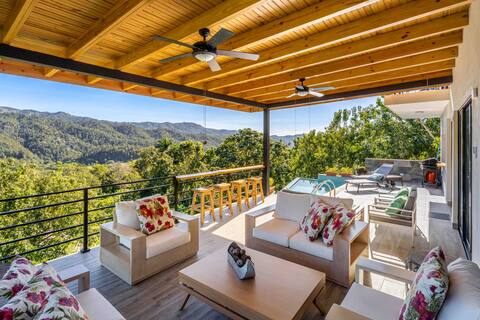
Treehouse at Spirit Mountain Coffee Farm
Entire Place • 1 bedroom

Independent apartment in "Villa las 3B"
Entire Place • N/A

Michelle's Village, a dream in the mountains!!!
Entire Place • 4 bedrooms

Letti's Villa
Private Room • 5 bedrooms
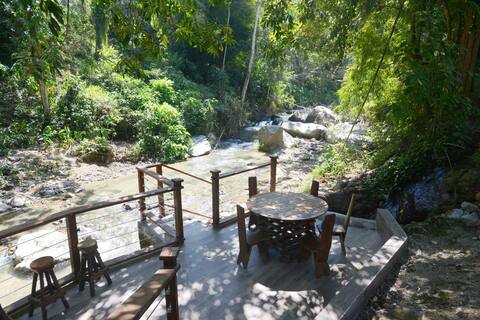
La Casita del Rio de Manabao (Jarabacoa)
Entire Place • 2 bedrooms
Note: Performance varies based on location, size, amenities, seasonality, and management quality. Data reflects the past 12 months.
Top Performing Airbnb Hosts in Manabao (2026)
Learn from the best! This table showcases top-performing Airbnb hosts in Manabao based on the number of properties managed and estimated total revenue over the past year. Analyze their scale and performance metrics.
| Host Name | Properties | Grossing Revenue | Stay Reviews | Avg Rating |
|---|---|---|---|---|
| Milagros | 1 | $39,818 | 37 | 4.97/5.0 |
| Chadley And Krista | 1 | $9,129 | 159 | 4.87/5.0 |
| David | 1 | $8,397 | 79 | 4.94/5.0 |
| Francisco | 4 | $7,883 | 24 | 4.94/5.0 |
| Michael | 1 | $6,744 | 59 | 4.68/5.0 |
| Jonathan | 1 | $6,394 | 64 | 4.91/5.0 |
| Albert | 1 | $4,342 | 32 | 4.63/5.0 |
| Rosalies | 1 | $3,559 | 30 | 4.73/5.0 |
| Marlyng | 1 | $2,661 | 19 | 4.37/5.0 |
| Julian | 1 | $2,421 | 9 | 4.56/5.0 |
Analyzing the strategies of top hosts, such as their property selection, pricing, and guest communication, can offer valuable lessons for optimizing your own Airbnb operations in Manabao.
Dive Deeper: Advanced Manabao STR Market Data (2026)
Ready to unlock more insights? AirROI provides access to advanced metrics and comprehensive Airbnb data for Manabao. Explore detailed analytics beyond this report to refine your investment strategy, optimize pricing, and maximize your vacation rental profits.
Explore Advanced MetricsManabao Short-Term Rental Market Composition (2026): Property & Room Types
Room Type Distribution
Property Type Distribution
Market Composition Insights for Manabao
- The Manabao Airbnb market composition is heavily skewed towards Entire Home/Apt listings, which make up 80% of the 20 active rentals. This indicates strong guest preference for privacy and space.
- Looking at the property type distribution in Manabao, Outdoor/Unique properties are the most common (35%), reflecting the local real estate landscape.
- Houses represent a significant 30% portion, catering likely to families or larger groups.
- The presence of 10% Hotel/Boutique listings indicates integration with traditional hospitality.
Manabao Airbnb Room Capacity Analysis (2026): Bedroom Distribution
Distribution of Listings by Number of Bedrooms
Room Capacity Insights for Manabao
- The dominant room capacity in Manabao is 1 bedroom listings, making up 45% of the market. This suggests a strong demand for properties suitable for couples or solo travelers.
- Together, 1 bedroom and 3 bedrooms properties represent 65.0% of the active Airbnb listings in Manabao, indicating a high concentration in these sizes.
- A significant 45.0% of listings offer 3+ bedrooms, catering to larger groups and families seeking more space in Manabao.
Manabao Vacation Rental Guest Capacity Trends (2026)
Distribution of Listings by Guest Capacity
Guest Capacity Insights for Manabao
- The most common guest capacity trend in Manabao vacation rentals is listings accommodating 2 guests (50%). This suggests the primary traveler segment is likely couples or solo travelers.
- Properties designed for 2 guests and 8+ guests dominate the Manabao STR market, accounting for 100.0% of listings.
- A significant 50.0% of listings cater specifically to 1-2 guests, highlighting strong demand from couples and solo travelers in Manabao.
- 50.0% of properties accommodate 6+ guests, serving the market segment for larger families or group travel in Manabao.
- On average, properties in Manabao are equipped to host 5.0 guests.
Manabao Airbnb Booking Patterns (2026): Available vs. Booked Days
Available Days Distribution
Booked Days Distribution
Booking Pattern Insights for Manabao
- The most common availability pattern in Manabao falls within the 271-366 days range, representing 90% of listings. This suggests many properties have significant open periods on their calendars.
- Approximately 95.0% of listings show high availability (181+ days open annually), indicating potential for increased bookings or specific owner usage patterns.
- For booked days, the 1-30 days range is most frequent in Manabao (70%), reflecting common guest stay durations or potential owner blocking patterns.
- A notable 5.0% of properties secure long booking periods (181+ days booked per year), highlighting successful long-term rental strategies or significant owner usage.
Manabao Airbnb Minimum Stay Requirements Analysis
Distribution of Listings by Minimum Night Requirement
1 Night
12 listings
60% of total
2 Nights
3 listings
15% of total
30+ Nights
5 listings
25% of total
Key Insights
- The most prevalent minimum stay requirement in Manabao is 1 Night, adopted by 60% of listings. This highlights the market's preference for shorter, flexible bookings.
- A strong majority (75.0%) of the Manabao Airbnb data shows acceptance of very short stays (1-2 nights), indicating a dynamic, high-turnover market.
- A significant segment (25%) caters to monthly stays (30+ nights) in Manabao, pointing to opportunities in the extended-stay market.
Recommendations
- Align with the market by considering a 1 Night minimum stay, as 60% of Manabao hosts use this setting.
- Explore offering discounts for stays of 30+ nights to attract the 25% of the market seeking extended stays.
- Adjust minimum nights based on seasonality – potentially shorter during low season and longer during peak demand periods in Manabao.
Manabao Airbnb Cancellation Policy Trends Analysis (2026)
Flexible
6 listings
30% of total
Moderate
3 listings
15% of total
Firm
7 listings
35% of total
Strict
4 listings
20% of total
Cancellation Policy Insights for Manabao
- The prevailing Airbnb cancellation policy trend in Manabao is Firm, used by 35% of listings.
- A majority (55.0%) of hosts in Manabao utilize Firm or Strict policies, indicating a market where hosts prioritize booking security.
Recommendations for Hosts
- Consider adopting a Firm policy to align with the 35% market standard in Manabao.
- Regularly review your cancellation policy against competitors and market demand shifts in Manabao.
Manabao STR Booking Lead Time Analysis (2026)
Average Booking Lead Time by Month
Booking Lead Time Insights for Manabao
- The overall average booking lead time for vacation rentals in Manabao is 24 days.
- Guests book furthest in advance for stays during April (average 30 days), likely coinciding with peak travel demand or local events.
- The shortest booking windows occur for stays in October (average 13 days), indicating more last-minute travel plans during this time.
- Seasonally, Spring (26 days avg.) sees the longest lead times, while Fall (17 days avg.) has the shortest, reflecting typical travel planning cycles.
Recommendations for Hosts
- Use the overall average lead time (24 days) as a baseline for your pricing and availability strategy in Manabao.
- During October, focus on last-minute booking availability and promotions, as guests book with very short notice (13 days avg.).
- Target marketing efforts for the Spring season well in advance (at least 26 days) to capture early planners.
- Monitor your own booking lead times against these Manabao averages to identify opportunities for dynamic pricing adjustments.
Popular & Essential Airbnb Amenities in Manabao (2026)
Amenity Prevalence
Amenity Insights for Manabao
- Essential amenities in Manabao that guests expect include: Free parking on premises, Wifi. Lacking these (any) could significantly impact bookings.
- Popular amenities like Pets allowed, Kitchen, Dishes and silverware are common but not universal. Offering these can provide a competitive edge.
Recommendations for Hosts
- Ensure your listing includes all essential amenities for Manabao: Free parking on premises, Wifi.
- Prioritize adding missing essentials: Wifi.
- Consider adding popular differentiators like Pets allowed or Kitchen to increase appeal.
- Highlight unique or less common amenities you offer (e.g., hot tub, dedicated workspace, EV charger) in your listing description and photos.
- Regularly check competitor amenities in Manabao to stay competitive.
Manabao Airbnb Guest Demographics & Profile Analysis (2026)
Guest Profile Summary for Manabao
- The typical guest profile for Airbnb in Manabao consists of primarily domestic travelers (74%), often arriving from nearby Santo Domingo, typically belonging to the Post-2000s (Gen Z/Alpha) group (50%), primarily speaking Spanish or English.
- Domestic travelers account for 73.6% of guests.
- Key international markets include Dominican Republic (73.6%) and United States (15.1%).
- Top languages spoken are Spanish (46.6%) followed by English (41.1%).
- A significant demographic segment is the Post-2000s (Gen Z/Alpha) group, representing 50% of guests.
Recommendations for Hosts
- Target domestic marketing efforts towards travelers from Santo Domingo and Santiago De Los Caballeros.
- Tailor amenities and listing descriptions to appeal to the dominant Post-2000s (Gen Z/Alpha) demographic (e.g., highlight fast WiFi, smart home features, local guides).
- Highlight unique local experiences or amenities relevant to the primary guest profile.
- Consider seasonal promotions aligned with peak travel times for key origin markets.
Nearby Short-Term Rental Market Comparison
How does the Manabao Airbnb market stack up against its neighbors? Compare key performance metrics like average monthly revenue, ADR, and occupancy rates in surrounding areas to understand the broader regional STR landscape.
| Market | Active Properties | Monthly Revenue | Daily Rate | Avg. Occupancy |
|---|---|---|---|---|
| Abreu | 15 | $2,503 | $204.50 | 26% |
| Juan Esteban | 12 | $1,703 | $346.19 | 21% |
| Punta Rucia;Damaris | 33 | $1,683 | $223.57 | 21% |
| Las Terrenas | 2,242 | $1,559 | $225.03 | 32% |
| Las Charcas | 57 | $1,432 | $304.97 | 19% |
| Punta Rucia | 14 | $1,403 | $203.53 | 21% |
| Sosúa | 1,556 | $1,233 | $208.18 | 31% |
| Buena Vista | 22 | $1,170 | $235.10 | 24% |
| Cabarete | 1,025 | $1,066 | $159.24 | 35% |
| Tamboril | 33 | $1,050 | $135.33 | 27% |