Buena Vista Airbnb Market Analysis 2026: Short Term Rental Data & Vacation Rental Statistics in La Vega, Dominican Republic
Is Airbnb profitable in Buena Vista in 2026? Explore comprehensive Airbnb analytics for Buena Vista, La Vega, Dominican Republic to uncover income potential. This 2026 STR market report for Buena Vista, based on AirROI data from February 2025 to January 2026, reveals key trends in the niche market of 22 active listings.
Whether you're considering an Airbnb investment in Buena Vista, optimizing your existing vacation rental, or exploring rental arbitrage opportunities, understanding the Buena Vista Airbnb data is crucial. Leveraging the low regulation environment is key to maximizing your short term rental income potential. Let's dive into the specifics.
Key Buena Vista Airbnb Performance Metrics Overview
Monthly Airbnb Revenue Variations & Income Potential in Buena Vista (2026)
Understanding the monthly revenue variations for Airbnb listings in Buena Vista is key to maximizing your short term rental income potential. Seasonality significantly impacts earnings. Our analysis, based on data from the past 12 months, shows that the peak revenue month for STRs in Buena Vista is typically August, while June often presents the lowest earnings, highlighting opportunities for strategic pricing adjustments during shoulder and low seasons. Explore the typical Airbnb income in Buena Vista across different performance tiers:
- Best-in-class properties (Top 10%) achieve $4,709+ monthly, often utilizing dynamic pricing and superior guest experiences.
- Strong performing properties (Top 25%) earn $2,259 or more, indicating effective management and desirable locations/amenities.
- Typical properties (Median) generate around $1,209 per month, representing the average market performance.
- Entry-level properties (Bottom 25%) see earnings around $607, often with potential for optimization.
Average Monthly Airbnb Earnings Trend in Buena Vista
Buena Vista Airbnb Occupancy Rate Trends (2026)
Maximize your bookings by understanding the Buena Vista STR occupancy trends. Seasonal demand shifts significantly influence how often properties are booked. Typically, Februarysees the highest demand (peak season occupancy), while January experiences the lowest (low season). Effective strategies, like adjusting minimum stays or offering promotions, can boost occupancy during slower periods. Here's how different property tiers perform in Buena Vista:
- Best-in-class properties (Top 10%) achieve 53%+ occupancy, indicating high desirability and potentially optimized availability.
- Strong performing properties (Top 25%) maintain 37% or higher occupancy, suggesting good market fit and guest satisfaction.
- Typical properties (Median) have an occupancy rate around 20%.
- Entry-level properties (Bottom 25%) average 10% occupancy, potentially facing higher vacancy.
Average Monthly Occupancy Rate Trend in Buena Vista
Average Daily Rate (ADR) Airbnb Trends in Buena Vista (2026)
Effective short term rental pricing strategy in Buena Vista involves understanding monthly ADR fluctuations. The Average Daily Rate (ADR) for Airbnb in Buena Vista typically peaks in June and dips lowest during January. Leveraging Airbnb dynamic pricing tools or strategies based on this seasonality can significantly boost revenue. Here's a look at the typical nightly rates achieved:
- Best-in-class properties (Top 10%) command rates of $458+ per night, often due to premium features or locations.
- Strong performing properties (Top 25%) achieve nightly rates of $358 or more.
- Typical properties (Median) charge around $192 per night.
- Entry-level properties (Bottom 25%) earn around $76 per night.
Average Daily Rate (ADR) Trend by Month in Buena Vista
Get Live Buena Vista Market Intelligence 👇

Explore Real-time Analytics
Airbnb Seasonality Analysis & Trends in Buena Vista (2026)
Peak Season (August, July, October)
- Revenue averages $2,808 per month
- Occupancy rates average 29.9%
- Daily rates average $253
Shoulder Season
- Revenue averages $1,961 per month
- Occupancy maintains around 25.8%
- Daily rates hold near $250
Low Season (January, April, June)
- Revenue drops to average $1,353 per month
- Occupancy decreases to average 21.3%
- Daily rates adjust to average $251
Seasonality Insights for Buena Vista
- The Airbnb seasonality in Buena Vista shows highly seasonal trends requiring careful strategy. While the sections above show seasonal averages, it's also insightful to look at the extremes:
- During the high season, the absolute peak month showcases Buena Vista's highest earning potential, with monthly revenues capable of climbing to $2,981, occupancy reaching a high of 39.7%, and ADRs peaking at $264.
- Conversely, the slowest single month of the year, typically falling within the low season, marks the market's lowest point. In this month, revenue might dip to $1,227, occupancy could drop to 15.7%, and ADRs may adjust down to $233.
- Understanding both the seasonal averages and these monthly peaks and troughs in revenue, occupancy, and ADR is crucial for maximizing your Airbnb profit potential in Buena Vista.
Seasonal Strategies for Maximizing Profit
- Peak Season: Maximize revenue through premium pricing and potentially longer minimum stays. Ensure high availability.
- Low Season: Offer competitive pricing, special promotions (e.g., extended stay discounts), and flexible cancellation policies. Target off-season travelers like remote workers or budget-conscious guests.
- Shoulder Seasons: Implement dynamic pricing that balances peak and low rates. Target weekend travelers or specific events. Offer slightly more flexible terms than peak season.
- Regularly analyze your own performance against these Buena Vista seasonality benchmarks and adjust your pricing and availability strategy accordingly.
Best Areas for Airbnb Investment in Buena Vista (2026)
Exploring the top neighborhoods for short-term rentals in Buena Vista? This section highlights key areas, outlining why they are attractive for hosts and guests, along with notable local attractions. Consider these locations based on your target guest profile and investment strategy.
| Neighborhood / Area | Why Host Here? (Target Guests & Appeal) | Key Attractions & Landmarks |
|---|---|---|
| Los Caobos | A central and lively district in Buena Vista, known for its accessibility and proximity to local amenities. It's a preferred area for tourists who want to experience the local culture and nightlife. | Parque Las Flores, Café Internacional, Plaza La Vega, local markets, nearby restaurants, art galleries |
| La Colonia | A vibrant neighborhood known for its local ambiance and community spirit. It attracts both families and tourists looking for a more authentic Dominican experience. | Centro Cultural La Vega, Local artisan shops, Traditional Dominican eateries, Cultural events, family parks |
| La Hoya | An emerging area with natural beauty and scenic views, ideal for visitors who appreciate nature and outdoor activities. Perfect for eco-tourism and nature retreats. | Cerro La Hoya, hiking trails, local flora and fauna, viewpoints, camping spots |
| El Descanso | Known for its tranquility and stunning natural landscapes, making it ideal for relaxation travelers. It offers a peaceful environment while still being close to La Vega's attractions. | Cascada El Descanso, botanical gardens, picnic areas, nature walks |
| Villa Mella | A family-friendly neighborhood that balances urban and suburban life. It's gaining popularity for those traveling with families or groups looking for spacious accommodations. | local parks, families-friendly restaurants, community events, shopping areas |
| Santiago Road | A bustling corridor that connects major points in the region. It's perfect for guests who prefer accessibility to transportation and local commerce. | shopping plazas, public transport access, local attractions, dining spots |
| Parque Nacional Juan Bautista Pérez Rancier | This area offers unique opportunities for nature lovers and adventure seekers due to its national park status, enticing visitors looking for outdoor adventures. | hiking paths, natural reserves, wildlife viewing, camping locations |
| Villamagante | A picturesque neighborhood known for its friendly locals and inviting atmosphere. It’s ideal for those seeking cultural immersion and authentic experiences. | Casa de Cultura, local festivals, community markets, art shows |
Understanding Airbnb License Requirements & STR Laws in Buena Vista (2026)
While Buena Vista, La Vega, Dominican Republic currently shows low STR regulations, specific Airbnb license requirements might still exist or change. Always verify the latest short term rental regulations and Airbnb license requirements directly with local government authorities for Buena Vista to ensure full compliance before hosting.
(Source: AirROI data, 2026, finding no licensed listings among those analyzed)
Top Performing Airbnb Properties in Buena Vista (2026)
Benchmark your potential! Explore examples of top-performing Airbnb properties in Buena Vistabased on Trailing Twelve Month (TTM) revenue. Analyze their characteristics, revenue, occupancy rate, and ADR to understand what drives success in this market.
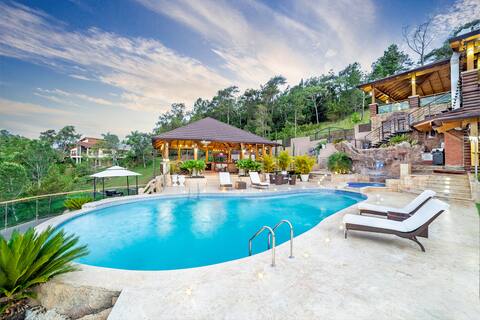
Villa Eli Jarabacoa ¡Chef Included! 20+ Guests
Entire Place • 7 bedrooms
A villa with a private heated pool, billiards, and a BBQ
Entire Place • 3 bedrooms
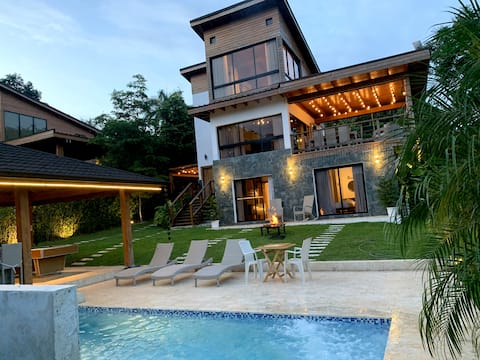
Villa Palmeras Jarabacoa/ 30 guests
Entire Place • 4 bedrooms

Jarabacoa Villa | Pool, Jacuzzi, BBQ, Billiards
Entire Place • 6 bedrooms
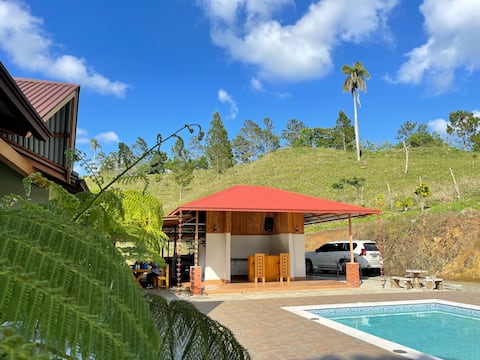
Symphony of the Field- Villa
Entire Place • 6 bedrooms

Modern and cozy
Entire Place • 3 bedrooms
Note: Performance varies based on location, size, amenities, seasonality, and management quality. Data reflects the past 12 months.
Top Performing Airbnb Hosts in Buena Vista (2026)
Learn from the best! This table showcases top-performing Airbnb hosts in Buena Vista based on the number of properties managed and estimated total revenue over the past year. Analyze their scale and performance metrics.
| Host Name | Properties | Grossing Revenue | Stay Reviews | Avg Rating |
|---|---|---|---|---|
| Michael | 1 | $93,642 | 119 | 4.77/5.0 |
| Yameyry | 1 | $36,792 | 116 | 4.87/5.0 |
| Laura Mariel | 1 | $30,941 | 12 | 4.83/5.0 |
| Keny | 1 | $18,470 | 4 | 5.00/5.0 |
| Francisco | 7 | $18,234 | 118 | 4.95/5.0 |
| Ada | 1 | $17,507 | 13 | 4.77/5.0 |
| Lotus | 1 | $15,986 | 21 | 4.95/5.0 |
| Angela Maria | 1 | $15,876 | 29 | 4.93/5.0 |
| Boris | 1 | $15,251 | 104 | 4.93/5.0 |
| Maheli | 1 | $14,559 | 4 | 4.75/5.0 |
Analyzing the strategies of top hosts, such as their property selection, pricing, and guest communication, can offer valuable lessons for optimizing your own Airbnb operations in Buena Vista.
Dive Deeper: Advanced Buena Vista STR Market Data (2026)
Ready to unlock more insights? AirROI provides access to advanced metrics and comprehensive Airbnb data for Buena Vista. Explore detailed analytics beyond this report to refine your investment strategy, optimize pricing, and maximize your vacation rental profits.
Explore Advanced MetricsBuena Vista Short-Term Rental Market Composition (2026): Property & Room Types
Room Type Distribution
Property Type Distribution
Market Composition Insights for Buena Vista
- The Buena Vista Airbnb market composition is heavily skewed towards Entire Home/Apt listings, which make up 68.2% of the 22 active rentals. This indicates strong guest preference for privacy and space.
- However, a notable 31.8% share for Private Rooms suggests opportunities for budget-conscious travelers or hosts renting out spare rooms.
- Looking at the property type distribution in Buena Vista, House properties are the most common (81.8%), reflecting the local real estate landscape.
- Houses represent a significant 81.8% portion, catering likely to families or larger groups.
Buena Vista Airbnb Room Capacity Analysis (2026): Bedroom Distribution
Distribution of Listings by Number of Bedrooms
Room Capacity Insights for Buena Vista
- The dominant room capacity in Buena Vista is 3 bedrooms listings, making up 31.8% of the market. This suggests a strong demand for properties suitable for families or small groups.
- Together, 3 bedrooms and 5+ bedrooms properties represent 50.0% of the active Airbnb listings in Buena Vista, indicating a high concentration in these sizes.
- A significant 63.6% of listings offer 3+ bedrooms, catering to larger groups and families seeking more space in Buena Vista.
Buena Vista Vacation Rental Guest Capacity Trends (2026)
Distribution of Listings by Guest Capacity
Guest Capacity Insights for Buena Vista
- The most common guest capacity trend in Buena Vista vacation rentals is listings accommodating 8+ guests (59.1%). This suggests the primary traveler segment is likely larger groups.
- Properties designed for 8+ guests and 4 guests dominate the Buena Vista STR market, accounting for 72.7% of listings.
- 63.6% of properties accommodate 6+ guests, serving the market segment for larger families or group travel in Buena Vista.
- On average, properties in Buena Vista are equipped to host 5.8 guests.
Buena Vista Airbnb Booking Patterns (2026): Available vs. Booked Days
Available Days Distribution
Booked Days Distribution
Booking Pattern Insights for Buena Vista
- The most common availability pattern in Buena Vista falls within the 271-366 days range, representing 86.4% of listings. This suggests many properties have significant open periods on their calendars.
- Approximately 95.5% of listings show high availability (181+ days open annually), indicating potential for increased bookings or specific owner usage patterns.
- For booked days, the 31-90 days range is most frequent in Buena Vista (54.5%), reflecting common guest stay durations or potential owner blocking patterns.
- A notable 4.5% of properties secure long booking periods (181+ days booked per year), highlighting successful long-term rental strategies or significant owner usage.
Buena Vista Airbnb Minimum Stay Requirements Analysis
Distribution of Listings by Minimum Night Requirement
1 Night
14 listings
63.6% of total
2 Nights
3 listings
13.6% of total
30+ Nights
5 listings
22.7% of total
Key Insights
- The most prevalent minimum stay requirement in Buena Vista is 1 Night, adopted by 63.6% of listings. This highlights the market's preference for shorter, flexible bookings.
- A strong majority (77.2%) of the Buena Vista Airbnb data shows acceptance of very short stays (1-2 nights), indicating a dynamic, high-turnover market.
- A significant segment (22.7%) caters to monthly stays (30+ nights) in Buena Vista, pointing to opportunities in the extended-stay market.
Recommendations
- Align with the market by considering a 1 Night minimum stay, as 63.6% of Buena Vista hosts use this setting.
- Explore offering discounts for stays of 30+ nights to attract the 22.7% of the market seeking extended stays.
- Adjust minimum nights based on seasonality – potentially shorter during low season and longer during peak demand periods in Buena Vista.
Buena Vista Airbnb Cancellation Policy Trends Analysis (2026)
Flexible
12 listings
54.5% of total
Moderate
6 listings
27.3% of total
Firm
3 listings
13.6% of total
Strict
1 listings
4.5% of total
Cancellation Policy Insights for Buena Vista
- The prevailing Airbnb cancellation policy trend in Buena Vista is Flexible, used by 54.5% of listings.
- The market strongly favors guest-friendly terms, with 81.8% of listings offering Flexible or Moderate policies. This suggests guests in Buena Vista may expect booking flexibility.
- Strict cancellation policies are quite rare (4.5%), potentially making listings with this policy less competitive unless justified by high demand or property type.
Recommendations for Hosts
- Consider adopting a Flexible policy to align with the 54.5% market standard in Buena Vista.
- Given the high prevalence of Flexible policies (54.5%), offering this can enhance booking appeal, especially during shoulder seasons.
- Using a Strict policy might deter some guests, as only 4.5% of listings use it. Evaluate if potential revenue protection outweighs possible lower booking rates.
- Regularly review your cancellation policy against competitors and market demand shifts in Buena Vista.
Buena Vista STR Booking Lead Time Analysis (2026)
Average Booking Lead Time by Month
Booking Lead Time Insights for Buena Vista
- The overall average booking lead time for vacation rentals in Buena Vista is 34 days.
- Guests book furthest in advance for stays during April (average 53 days), likely coinciding with peak travel demand or local events.
- The shortest booking windows occur for stays in May (average 21 days), indicating more last-minute travel plans during this time.
- Seasonally, Winter (39 days avg.) sees the longest lead times, while Summer (27 days avg.) has the shortest, reflecting typical travel planning cycles.
Recommendations for Hosts
- Use the overall average lead time (34 days) as a baseline for your pricing and availability strategy in Buena Vista.
- For April stays, consider implementing length-of-stay discounts or slightly higher rates for bookings made less than 53 days out to capitalize on advance planning.
- Target marketing efforts for the Winter season well in advance (at least 39 days) to capture early planners.
- Monitor your own booking lead times against these Buena Vista averages to identify opportunities for dynamic pricing adjustments.
Popular & Essential Airbnb Amenities in Buena Vista (2026)
Amenity Prevalence
Amenity Insights for Buena Vista
- Essential amenities in Buena Vista that guests expect include: Free parking on premises. Lacking these (this) could significantly impact bookings.
- Popular amenities like BBQ grill, Backyard, Patio or balcony are common but not universal. Offering these can provide a competitive edge.
- Warning: Wifi is not universally provided but is considered essential globally. Ensure reliable Wifi is offered.
Recommendations for Hosts
- Ensure your listing includes all essential amenities for Buena Vista: Free parking on premises.
- Consider adding popular differentiators like BBQ grill or Backyard to increase appeal.
- Highlight unique or less common amenities you offer (e.g., hot tub, dedicated workspace, EV charger) in your listing description and photos.
- Regularly check competitor amenities in Buena Vista to stay competitive.
Buena Vista Airbnb Guest Demographics & Profile Analysis (2026)
Guest Profile Summary for Buena Vista
- The typical guest profile for Airbnb in Buena Vista consists of a mix of domestic (41%) and international guests, with top international origins including Dominican Republic, typically belonging to the Post-2000s (Gen Z/Alpha) group (50%), primarily speaking Spanish or English.
- Domestic travelers account for 41.0% of guests.
- Key international markets include United States (42.6%) and Dominican Republic (41%).
- Top languages spoken are Spanish (48.6%) followed by English (42.9%).
- A significant demographic segment is the Post-2000s (Gen Z/Alpha) group, representing 50% of guests.
Recommendations for Hosts
- Balance marketing efforts between domestic and international channels based on the guest mix.
- Tailor amenities and listing descriptions to appeal to the dominant Post-2000s (Gen Z/Alpha) demographic (e.g., highlight fast WiFi, smart home features, local guides).
- Highlight unique local experiences or amenities relevant to the primary guest profile.
- Consider seasonal promotions aligned with peak travel times for key origin markets.
Nearby Short-Term Rental Market Comparison
How does the Buena Vista Airbnb market stack up against its neighbors? Compare key performance metrics like average monthly revenue, ADR, and occupancy rates in surrounding areas to understand the broader regional STR landscape.
| Market | Active Properties | Monthly Revenue | Daily Rate | Avg. Occupancy |
|---|---|---|---|---|
| Abreu | 15 | $2,503 | $204.50 | 26% |
| Juan Esteban | 12 | $1,703 | $346.19 | 21% |
| Punta Rucia;Damaris | 33 | $1,683 | $223.57 | 21% |
| Las Terrenas | 2,242 | $1,559 | $225.03 | 32% |
| Las Charcas | 57 | $1,432 | $304.97 | 19% |
| Punta Rucia | 14 | $1,403 | $203.53 | 21% |
| Sosúa | 1,556 | $1,233 | $208.18 | 31% |
| Cabarete | 1,025 | $1,066 | $159.24 | 35% |
| Tamboril | 33 | $1,050 | $135.33 | 27% |
| Monte Plata | 17 | $1,033 | $170.06 | 21% |