Santo Domingo Airbnb Market Analysis 2026: Short Term Rental Data & Vacation Rental Statistics in Distrito Nacional, Dominican Republic
Is Airbnb profitable in Santo Domingo in 2026? Explore comprehensive Airbnb analytics for Santo Domingo, Distrito Nacional, Dominican Republic to uncover income potential. This 2026 STR market report for Santo Domingo, based on AirROI data from February 2025 to January 2026, reveals key trends in the bustling market of 4,364 active listings.
Whether you're considering an Airbnb investment in Santo Domingo, optimizing your existing vacation rental, or exploring rental arbitrage opportunities, understanding the Santo Domingo Airbnb data is crucial. Leveraging the low regulation environment is key to maximizing your short term rental income potential. Let's dive into the specifics.
Key Santo Domingo Airbnb Performance Metrics Overview
Monthly Airbnb Revenue Variations & Income Potential in Santo Domingo (2026)
Understanding the monthly revenue variations for Airbnb listings in Santo Domingo is key to maximizing your short term rental income potential. Seasonality significantly impacts earnings. Our analysis, based on data from the past 12 months, shows that the peak revenue month for STRs in Santo Domingo is typically July, while May often presents the lowest earnings, highlighting opportunities for strategic pricing adjustments during shoulder and low seasons. Explore the typical Airbnb income in Santo Domingo across different performance tiers:
- Best-in-class properties (Top 10%) achieve $2,027+ monthly, often utilizing dynamic pricing and superior guest experiences.
- Strong performing properties (Top 25%) earn $1,351 or more, indicating effective management and desirable locations/amenities.
- Typical properties (Median) generate around $741 per month, representing the average market performance.
- Entry-level properties (Bottom 25%) see earnings around $326, often with potential for optimization.
Average Monthly Airbnb Earnings Trend in Santo Domingo
Santo Domingo Airbnb Occupancy Rate Trends (2026)
Maximize your bookings by understanding the Santo Domingo STR occupancy trends. Seasonal demand shifts significantly influence how often properties are booked. Typically, Februarysees the highest demand (peak season occupancy), while May experiences the lowest (low season). Effective strategies, like adjusting minimum stays or offering promotions, can boost occupancy during slower periods. Here's how different property tiers perform in Santo Domingo:
- Best-in-class properties (Top 10%) achieve 78%+ occupancy, indicating high desirability and potentially optimized availability.
- Strong performing properties (Top 25%) maintain 60% or higher occupancy, suggesting good market fit and guest satisfaction.
- Typical properties (Median) have an occupancy rate around 37%.
- Entry-level properties (Bottom 25%) average 17% occupancy, potentially facing higher vacancy.
Average Monthly Occupancy Rate Trend in Santo Domingo
Average Daily Rate (ADR) Airbnb Trends in Santo Domingo (2026)
Effective short term rental pricing strategy in Santo Domingo involves understanding monthly ADR fluctuations. The Average Daily Rate (ADR) for Airbnb in Santo Domingo typically peaks in December and dips lowest during March. Leveraging Airbnb dynamic pricing tools or strategies based on this seasonality can significantly boost revenue. Here's a look at the typical nightly rates achieved:
- Best-in-class properties (Top 10%) command rates of $125+ per night, often due to premium features or locations.
- Strong performing properties (Top 25%) achieve nightly rates of $89 or more.
- Typical properties (Median) charge around $66 per night.
- Entry-level properties (Bottom 25%) earn around $48 per night.
Average Daily Rate (ADR) Trend by Month in Santo Domingo
Get Live Santo Domingo Market Intelligence 👇

Explore Real-time Analytics
Airbnb Seasonality Analysis & Trends in Santo Domingo (2026)
Peak Season (July, August, December)
- Revenue averages $1,094 per month
- Occupancy rates average 42.1%
- Daily rates average $80
Shoulder Season
- Revenue averages $975 per month
- Occupancy maintains around 40.5%
- Daily rates hold near $79
Low Season (January, May, September)
- Revenue drops to average $889 per month
- Occupancy decreases to average 36.2%
- Daily rates adjust to average $80
Seasonality Insights for Santo Domingo
- The Airbnb seasonality in Santo Domingo shows relatively stable year-round demand. While the sections above show seasonal averages, it's also insightful to look at the extremes:
- During the high season, the absolute peak month showcases Santo Domingo's highest earning potential, with monthly revenues capable of climbing to $1,152, occupancy reaching a high of 44.5%, and ADRs peaking at $81.
- Conversely, the slowest single month of the year, typically falling within the low season, marks the market's lowest point. In this month, revenue might dip to $865, occupancy could drop to 34.5%, and ADRs may adjust down to $77.
- Understanding both the seasonal averages and these monthly peaks and troughs in revenue, occupancy, and ADR is crucial for maximizing your Airbnb profit potential in Santo Domingo.
Seasonal Strategies for Maximizing Profit
- Peak Season: Maximize revenue through premium pricing and potentially longer minimum stays. Ensure high availability.
- Low Season: Offer competitive pricing, special promotions (e.g., extended stay discounts), and flexible cancellation policies. Target off-season travelers like remote workers or budget-conscious guests.
- Shoulder Seasons: Implement dynamic pricing that balances peak and low rates. Target weekend travelers or specific events. Offer slightly more flexible terms than peak season.
- Regularly analyze your own performance against these Santo Domingo seasonality benchmarks and adjust your pricing and availability strategy accordingly.
Best Areas for Airbnb Investment in Santo Domingo (2026)
Exploring the top neighborhoods for short-term rentals in Santo Domingo? This section highlights key areas, outlining why they are attractive for hosts and guests, along with notable local attractions. Consider these locations based on your target guest profile and investment strategy.
| Neighborhood / Area | Why Host Here? (Target Guests & Appeal) | Key Attractions & Landmarks |
|---|---|---|
| Zona Colonial | Historic heart of Santo Domingo, known for its colonial architecture and rich history. Attracts tourists who want to explore the roots of the Americas and enjoy vibrant nightlife. | Alcázar de Colón, Catedral Primada de América, Parque Colón, Museo de las Casas Reales, Calle Las Damas |
| Piantini | Upscale residential area with modern amenities, luxury shopping, and fine dining. Popular among business travelers and expatriates looking for comfort and convenience. | Blue Mall, Shangri-La Plaza, Centro Comercial Sambil, restaurants and cafes, proximity to business centers |
| Naco | A foremost modern neighborhood that combines residential living with commercial accessibility. Known for its upscale apartments and proximity to key areas of the city. | Naco Park, Cine Mark, shopping centers, restaurants, fitness centers |
| Los Cacicazgos | An exclusive and affluent area with spacious homes and green spaces. Favored by high-income tourists and expatriates seeking luxury accommodations. | Parque Mirador Sur, Boulevard de Los Cacicazgos, restaurants and cafes, proximity to business districts |
| Las Terrenas | Popular beach destination near Santo Domingo that offers a laid-back atmosphere and beautiful beaches. Attracts tourists looking for a coastal getaway. | Playa Las Ballenas, Cascada El Limón, Los Haitises National Park, local eateries and shops, water sports |
| Gazcue | A cultural neighborhood known for its art scene and proximity to cultural institutions. Attracts visitors interested in arts and local life. | Museo de Arte Moderno, Art galleries, Cafés and cultural spaces, Parque Eugenio María de Hostos, Calle El Conde |
| Malecon | The beachfront boulevard of Santo Domingo, known for its views, nightlife, and entertainment. Great for tourists looking to enjoy the ocean and local culture. | Malecon Center, Café del Mar, Seafood restaurants, Cultural events, Beaches and bars |
| Santo Domingo Este | An expanding area with affordable accommodations and growing popularity among travelers. Offers a mix of local culture and emerging tourist attractions. | Los Tres Ojos, Escenario de los Cuentos, Playa Caribe, local markets, cultural festivals |
Understanding Airbnb License Requirements & STR Laws in Santo Domingo (2026)
While Santo Domingo, Distrito Nacional, Dominican Republic currently shows low STR regulations, specific Airbnb license requirements might still exist or change. Always verify the latest short term rental regulations and Airbnb license requirements directly with local government authorities for Santo Domingo to ensure full compliance before hosting.
(Source: AirROI data, 2026, based on 0% licensed listings)
Top Performing Airbnb Properties in Santo Domingo (2026)
Benchmark your potential! Explore examples of top-performing Airbnb properties in Santo Domingobased on Trailing Twelve Month (TTM) revenue. Analyze their characteristics, revenue, occupancy rate, and ADR to understand what drives success in this market.
Casa Pantheon Luxury Colonial House
Entire Place • 4 bedrooms

Beautiful and comfortable house in the Colonial City
Entire Place • 4 bedrooms

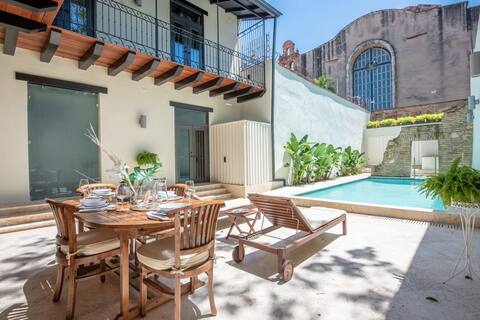
Atypical pool house, ciudad colonial
Entire Place • 9 bedrooms
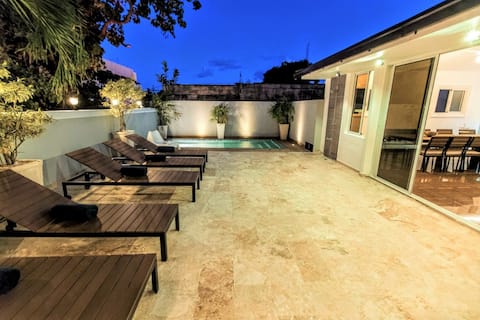
✔️ 20-PAX VILLA | POOL | 8-BEDROOM | ZONA COLONIAL
Entire Place • 8 bedrooms

Stunning villa in Zona Colonial
Entire Place • 4 bedrooms

casa_vacacional_el_papi_ny2 a unique place for you
Entire Place • 10 bedrooms
Note: Performance varies based on location, size, amenities, seasonality, and management quality. Data reflects the past 12 months.
Top Performing Airbnb Hosts in Santo Domingo (2026)
Learn from the best! This table showcases top-performing Airbnb hosts in Santo Domingo based on the number of properties managed and estimated total revenue over the past year. Analyze their scale and performance metrics.
| Host Name | Properties | Grossing Revenue | Stay Reviews | Avg Rating |
|---|---|---|---|---|
| GoRentry | 73 | $1,284,494 | 9124 | 4.79/5.0 |
| Edwin | 45 | $1,071,434 | 5623 | 4.86/5.0 |
| Francisco And Daniel | 75 | $884,007 | 4061 | 4.70/5.0 |
| DR Vacation Stay | 32 | $608,984 | 1861 | 4.77/5.0 |
| Jennifer & Tim | 68 | $575,802 | 10280 | 4.86/5.0 |
| Flor | 48 | $435,827 | 2999 | 4.91/5.0 |
| Potenza Rentals | 58 | $422,913 | 7460 | 4.61/5.0 |
| Miguel | 23 | $366,560 | 1897 | 4.84/5.0 |
| WeHost DR | 29 | $300,961 | 2138 | 4.65/5.0 |
| NH Liriano | 41 | $279,145 | 2996 | 4.88/5.0 |
Analyzing the strategies of top hosts, such as their property selection, pricing, and guest communication, can offer valuable lessons for optimizing your own Airbnb operations in Santo Domingo.
Dive Deeper: Advanced Santo Domingo STR Market Data (2026)
Ready to unlock more insights? AirROI provides access to advanced metrics and comprehensive Airbnb data for Santo Domingo. Explore detailed analytics beyond this report to refine your investment strategy, optimize pricing, and maximize your vacation rental profits.
Explore Advanced MetricsSanto Domingo Short-Term Rental Market Composition (2026): Property & Room Types
Room Type Distribution
Property Type Distribution
Market Composition Insights for Santo Domingo
- The Santo Domingo Airbnb market composition is heavily skewed towards Entire Home/Apt listings, which make up 90.4% of the 4,364 active rentals. This indicates strong guest preference for privacy and space.
- Looking at the property type distribution in Santo Domingo, Apartment/Condo properties are the most common (90.1%), reflecting the local real estate landscape.
- Smaller segments like hotel/boutique, others, unique stays (combined 4.5%) offer potential for unique stay experiences.
Santo Domingo Airbnb Room Capacity Analysis (2026): Bedroom Distribution
Distribution of Listings by Number of Bedrooms
Room Capacity Insights for Santo Domingo
- The dominant room capacity in Santo Domingo is 1 bedroom listings, making up 55.2% of the market. This suggests a strong demand for properties suitable for couples or solo travelers.
- Together, 1 bedroom and 2 bedrooms properties represent 81.5% of the active Airbnb listings in Santo Domingo, indicating a high concentration in these sizes.
- With over half the market (55.2%) consisting of studios or 1-bedroom units, Santo Domingo is particularly well-suited for individuals or couples.
Santo Domingo Vacation Rental Guest Capacity Trends (2026)
Distribution of Listings by Guest Capacity
Guest Capacity Insights for Santo Domingo
- The most common guest capacity trend in Santo Domingo vacation rentals is listings accommodating 2 guests (41.1%). This suggests the primary traveler segment is likely couples or solo travelers.
- Properties designed for 2 guests and 4 guests dominate the Santo Domingo STR market, accounting for 70.1% of listings.
- A significant 41.7% of listings cater specifically to 1-2 guests, highlighting strong demand from couples and solo travelers in Santo Domingo.
- 13.6% of properties accommodate 6+ guests, serving the market segment for larger families or group travel in Santo Domingo.
- On average, properties in Santo Domingo are equipped to host 3.3 guests.
Santo Domingo Airbnb Booking Patterns (2026): Available vs. Booked Days
Available Days Distribution
Booked Days Distribution
Booking Pattern Insights for Santo Domingo
- The most common availability pattern in Santo Domingo falls within the 271-366 days range, representing 53.4% of listings. This suggests many properties have significant open periods on their calendars.
- Approximately 84.4% of listings show high availability (181+ days open annually), indicating potential for increased bookings or specific owner usage patterns.
- For booked days, the 91-180 days range is most frequent in Santo Domingo (31.8%), reflecting common guest stay durations or potential owner blocking patterns.
- A notable 16.5% of properties secure long booking periods (181+ days booked per year), highlighting successful long-term rental strategies or significant owner usage.
Santo Domingo Airbnb Minimum Stay Requirements Analysis
Distribution of Listings by Minimum Night Requirement
1 Night
1646 listings
37.7% of total
2 Nights
1109 listings
25.4% of total
3 Nights
321 listings
7.4% of total
4-6 Nights
170 listings
3.9% of total
7-29 Nights
79 listings
1.8% of total
30+ Nights
1039 listings
23.8% of total
Key Insights
- The most prevalent minimum stay requirement in Santo Domingo is 1 Night, adopted by 37.7% of listings. This highlights the market's preference for shorter, flexible bookings.
- A strong majority (63.1%) of the Santo Domingo Airbnb data shows acceptance of very short stays (1-2 nights), indicating a dynamic, high-turnover market.
- A significant segment (23.8%) caters to monthly stays (30+ nights) in Santo Domingo, pointing to opportunities in the extended-stay market.
Recommendations
- Align with the market by considering a 1 Night minimum stay, as 37.7% of Santo Domingo hosts use this setting.
- Explore offering discounts for stays of 30+ nights to attract the 23.8% of the market seeking extended stays.
- Adjust minimum nights based on seasonality – potentially shorter during low season and longer during peak demand periods in Santo Domingo.
Santo Domingo Airbnb Cancellation Policy Trends Analysis (2026)
Super Strict 60 Days
2 listings
0% of total
Limited
101 listings
2.3% of total
Super Strict 30 Days
1 listings
0% of total
Flexible
1838 listings
42.2% of total
Moderate
1129 listings
25.9% of total
Firm
927 listings
21.3% of total
Strict
357 listings
8.2% of total
Cancellation Policy Insights for Santo Domingo
- The prevailing Airbnb cancellation policy trend in Santo Domingo is Flexible, used by 42.2% of listings.
- There's a relatively balanced mix between guest-friendly (68.1%) and stricter (29.5%) policies, offering choices for different guest needs.
- Strict cancellation policies are quite rare (8.2%), potentially making listings with this policy less competitive unless justified by high demand or property type.
Recommendations for Hosts
- Consider adopting a Flexible policy to align with the 42.2% market standard in Santo Domingo.
- Using a Strict policy might deter some guests, as only 8.2% of listings use it. Evaluate if potential revenue protection outweighs possible lower booking rates.
- Regularly review your cancellation policy against competitors and market demand shifts in Santo Domingo.
Santo Domingo STR Booking Lead Time Analysis (2026)
Average Booking Lead Time by Month
Booking Lead Time Insights for Santo Domingo
- The overall average booking lead time for vacation rentals in Santo Domingo is 17 days.
- Guests book furthest in advance for stays during November (average 28 days), likely coinciding with peak travel demand or local events.
- The shortest booking windows occur for stays in March (average 13 days), indicating more last-minute travel plans during this time.
- Seasonally, Winter (21 days avg.) sees the longest lead times, while Spring (15 days avg.) has the shortest, reflecting typical travel planning cycles.
Recommendations for Hosts
- Use the overall average lead time (17 days) as a baseline for your pricing and availability strategy in Santo Domingo.
- For November stays, consider implementing length-of-stay discounts or slightly higher rates for bookings made less than 28 days out to capitalize on advance planning.
- Target marketing efforts for the Winter season well in advance (at least 21 days) to capture early planners.
- Monitor your own booking lead times against these Santo Domingo averages to identify opportunities for dynamic pricing adjustments.
Popular & Essential Airbnb Amenities in Santo Domingo (2026)
Amenity Prevalence
Amenity Insights for Santo Domingo
- Essential amenities in Santo Domingo that guests expect include: Wifi, Air conditioning, TV. Lacking these (any) could significantly impact bookings.
- Popular amenities like Kitchen, Free parking on premises, Iron are common but not universal. Offering these can provide a competitive edge.
Recommendations for Hosts
- Ensure your listing includes all essential amenities for Santo Domingo: Wifi, Air conditioning, TV.
- Prioritize adding missing essentials: Wifi, Air conditioning, TV.
- Consider adding popular differentiators like Kitchen or Free parking on premises to increase appeal.
- Highlight unique or less common amenities you offer (e.g., hot tub, dedicated workspace, EV charger) in your listing description and photos.
- Regularly check competitor amenities in Santo Domingo to stay competitive.
Santo Domingo Airbnb Guest Demographics & Profile Analysis (2026)
Guest Profile Summary for Santo Domingo
- The typical guest profile for Airbnb in Santo Domingo consists of predominantly international visitors (75%), with top international origins including Dominican Republic, typically belonging to the Post-2000s (Gen Z/Alpha) group (50%), primarily speaking English or Spanish.
- Domestic travelers account for 25.4% of guests.
- Key international markets include United States (51.1%) and Dominican Republic (25.4%).
- Top languages spoken are English (43.7%) followed by Spanish (41.4%).
- A significant demographic segment is the Post-2000s (Gen Z/Alpha) group, representing 50% of guests.
Recommendations for Hosts
- Focus marketing internationally, particularly towards travelers from Dominican Republic.
- Tailor amenities and listing descriptions to appeal to the dominant Post-2000s (Gen Z/Alpha) demographic (e.g., highlight fast WiFi, smart home features, local guides).
- Highlight unique local experiences or amenities relevant to the primary guest profile.
- Consider seasonal promotions aligned with peak travel times for key origin markets.
Nearby Short-Term Rental Market Comparison
How does the Santo Domingo Airbnb market stack up against its neighbors? Compare key performance metrics like average monthly revenue, ADR, and occupancy rates in surrounding areas to understand the broader regional STR landscape.
| Market | Active Properties | Monthly Revenue | Daily Rate | Avg. Occupancy |
|---|---|---|---|---|
| La Romana | 850 | $3,826 | $702.77 | 27% |
| Abreu | 15 | $2,503 | $204.50 | 26% |
| Higüey | 4,126 | $1,786 | $251.99 | 35% |
| Las Terrenas | 2,242 | $1,559 | $225.03 | 32% |
| Las Charcas | 57 | $1,432 | $304.97 | 19% |
| Sosúa | 1,556 | $1,233 | $208.18 | 31% |
| Buena Vista | 22 | $1,170 | $235.10 | 24% |
| Cabarete | 1,025 | $1,066 | $159.24 | 35% |
| Tamboril | 33 | $1,050 | $135.33 | 27% |
| Monte Plata | 17 | $1,033 | $170.06 | 21% |