Øster Lyng Airbnb Market Analysis 2026: Short Term Rental Data & Vacation Rental Statistics in Region Zealand, Denmark
Is Airbnb profitable in Øster Lyng in 2026? Explore comprehensive Airbnb analytics for Øster Lyng, Region Zealand, Denmark to uncover income potential. This 2026 STR market report for Øster Lyng, based on AirROI data from February 2025 to January 2026, reveals key trends in the niche market of 56 active listings.
Whether you're considering an Airbnb investment in Øster Lyng, optimizing your existing vacation rental, or exploring rental arbitrage opportunities, understanding the Øster Lyng Airbnb data is crucial. Leveraging the low regulation environment is key to maximizing your short term rental income potential. Let's dive into the specifics.
Key Øster Lyng Airbnb Performance Metrics Overview
Monthly Airbnb Revenue Variations & Income Potential in Øster Lyng (2026)
Understanding the monthly revenue variations for Airbnb listings in Øster Lyng is key to maximizing your short term rental income potential. Seasonality significantly impacts earnings. Our analysis, based on data from the past 12 months, shows that the peak revenue month for STRs in Øster Lyng is typically July, while January often presents the lowest earnings, highlighting opportunities for strategic pricing adjustments during shoulder and low seasons. Explore the typical Airbnb income in Øster Lyng across different performance tiers:
- Best-in-class properties (Top 10%) achieve $3,266+ monthly, often utilizing dynamic pricing and superior guest experiences.
- Strong performing properties (Top 25%) earn $2,003 or more, indicating effective management and desirable locations/amenities.
- Typical properties (Median) generate around $1,260 per month, representing the average market performance.
- Entry-level properties (Bottom 25%) see earnings around $707, often with potential for optimization.
Average Monthly Airbnb Earnings Trend in Øster Lyng
Øster Lyng Airbnb Occupancy Rate Trends (2026)
Maximize your bookings by understanding the Øster Lyng STR occupancy trends. Seasonal demand shifts significantly influence how often properties are booked. Typically, Julysees the highest demand (peak season occupancy), while January experiences the lowest (low season). Effective strategies, like adjusting minimum stays or offering promotions, can boost occupancy during slower periods. Here's how different property tiers perform in Øster Lyng:
- Best-in-class properties (Top 10%) achieve 60%+ occupancy, indicating high desirability and potentially optimized availability.
- Strong performing properties (Top 25%) maintain 43% or higher occupancy, suggesting good market fit and guest satisfaction.
- Typical properties (Median) have an occupancy rate around 26%.
- Entry-level properties (Bottom 25%) average 15% occupancy, potentially facing higher vacancy.
Average Monthly Occupancy Rate Trend in Øster Lyng
Average Daily Rate (ADR) Airbnb Trends in Øster Lyng (2026)
Effective short term rental pricing strategy in Øster Lyng involves understanding monthly ADR fluctuations. The Average Daily Rate (ADR) for Airbnb in Øster Lyng typically peaks in October and dips lowest during February. Leveraging Airbnb dynamic pricing tools or strategies based on this seasonality can significantly boost revenue. Here's a look at the typical nightly rates achieved:
- Best-in-class properties (Top 10%) command rates of $235+ per night, often due to premium features or locations.
- Strong performing properties (Top 25%) achieve nightly rates of $185 or more.
- Typical properties (Median) charge around $151 per night.
- Entry-level properties (Bottom 25%) earn around $128 per night.
Average Daily Rate (ADR) Trend by Month in Øster Lyng
Get Live Øster Lyng Market Intelligence 👇

Explore Real-time Analytics
Airbnb Seasonality Analysis & Trends in Øster Lyng (2026)
Peak Season (July, August, June)
- Revenue averages $2,897 per month
- Occupancy rates average 51.3%
- Daily rates average $170
Shoulder Season
- Revenue averages $1,253 per month
- Occupancy maintains around 26.0%
- Daily rates hold near $167
Low Season (January, February, May)
- Revenue drops to average $888 per month
- Occupancy decreases to average 20.0%
- Daily rates adjust to average $161
Seasonality Insights for Øster Lyng
- The Airbnb seasonality in Øster Lyng shows highly seasonal trends requiring careful strategy. While the sections above show seasonal averages, it's also insightful to look at the extremes:
- During the high season, the absolute peak month showcases Øster Lyng's highest earning potential, with monthly revenues capable of climbing to $4,233, occupancy reaching a high of 74.0%, and ADRs peaking at $175.
- Conversely, the slowest single month of the year, typically falling within the low season, marks the market's lowest point. In this month, revenue might dip to $730, occupancy could drop to 14.6%, and ADRs may adjust down to $151.
- Understanding both the seasonal averages and these monthly peaks and troughs in revenue, occupancy, and ADR is crucial for maximizing your Airbnb profit potential in Øster Lyng.
Seasonal Strategies for Maximizing Profit
- Peak Season: Maximize revenue through premium pricing and potentially longer minimum stays. Ensure high availability.
- Low Season: Offer competitive pricing, special promotions (e.g., extended stay discounts), and flexible cancellation policies. Target off-season travelers like remote workers or budget-conscious guests.
- Shoulder Seasons: Implement dynamic pricing that balances peak and low rates. Target weekend travelers or specific events. Offer slightly more flexible terms than peak season.
- Regularly analyze your own performance against these Øster Lyng seasonality benchmarks and adjust your pricing and availability strategy accordingly.
Best Areas for Airbnb Investment in Øster Lyng (2026)
Exploring the top neighborhoods for short-term rentals in Øster Lyng? This section highlights key areas, outlining why they are attractive for hosts and guests, along with notable local attractions. Consider these locations based on your target guest profile and investment strategy.
| Neighborhood / Area | Why Host Here? (Target Guests & Appeal) | Key Attractions & Landmarks |
|---|---|---|
| Øster Lyng Beach | Beautiful sandy beach offering a relaxed coastal vibe, ideal for families and beachgoers. It's a peaceful area with opportunities for outdoor activities like swimming and sunbathing. | Øster Lyng Beach, Kerteminde Marina, Beach volleyball courts, Coastal trails, Picnic areas |
| Nørre Asmindrup | Quaint village atmosphere with access to local shops and cafes. Popular with those seeking a quiet retreat and a chance to explore the Danish countryside. | Local shops, Cafes, Beautiful landscapes, Cycling paths, Nearby forests |
| Høve Skov | Scenic forest area perfect for nature lovers and hiking enthusiasts. Offers tranquility and opportunities for exploring Danish flora and fauna. | Hiking trails, Birdwatching, Picnic spots, Cycling routes, Nature photography |
| Bakkebølle | Charming coastal village with picturesque views and a close-knit community. Great for those interested in a rural getaway near the coast. | Local beaches, Fishing opportunities, Nature walks, Community events, Artisan markets |
| Køge | Historical harbor town with a rich cultural heritage. Attractive for tourists interested in Danish history, architecture, and local cuisine. | Køge Museum, Historic town center, Køge Bay, Local markets, Museum of Trains |
| Vig | Lovely village close to the coast known for its peaceful environment and proximity to nature. Ideal for families and those looking to relax. | Vig Beach, Biking paths, Nature parks, Local farms, Art galleries |
| Holbæk | Vibrant town with a beautiful waterfront and plenty of amenities. Offers an inviting mix of history and modern suburban life, making it attractive to urban explorers. | Holbæk Harbor, Holbæk Museum, Shopping centers, Local eateries, Scenic walks |
| Fårevejle | A scenic area with abundant nature, perfect for those seeking a getaway from city life. Accessible rural charm with opportunities for outdoor adventures. | Fårevejle Beach, Hiking trails, Nature reserves, Local festivals, Countryside views |
Understanding Airbnb License Requirements & STR Laws in Øster Lyng (2026)
While Øster Lyng, Region Zealand, Denmark currently shows low STR regulations, specific Airbnb license requirements might still exist or change. Always verify the latest short term rental regulations and Airbnb license requirements directly with local government authorities for Øster Lyng to ensure full compliance before hosting.
(Source: AirROI data, 2026, based on 2% licensed listings)
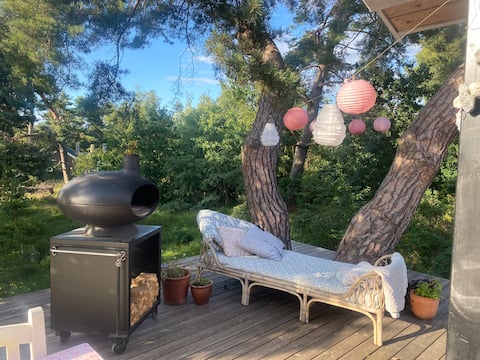
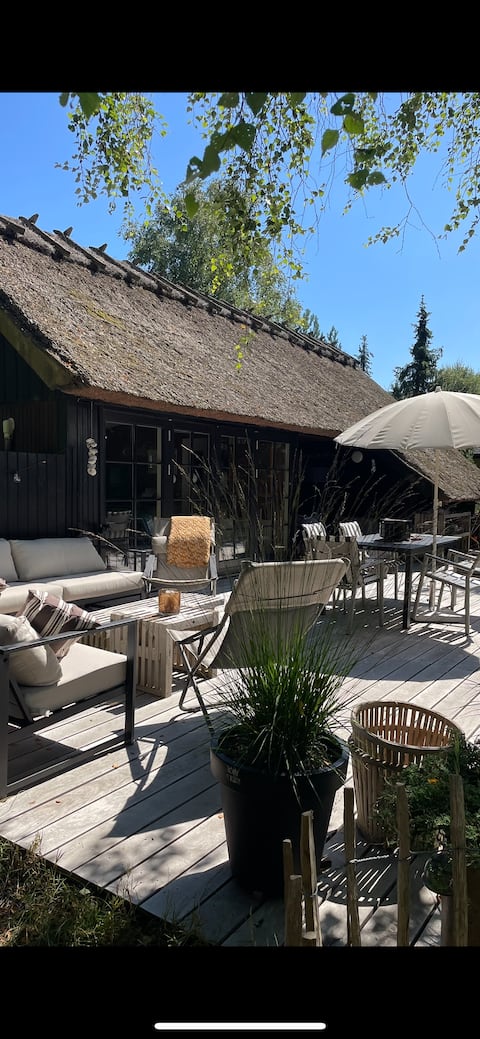
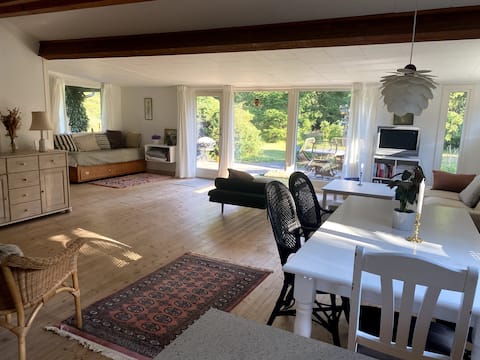
Top Performing Airbnb Properties in Øster Lyng (2026)
Benchmark your potential! Explore examples of top-performing Airbnb properties in Øster Lyngbased on Trailing Twelve Month (TTM) revenue. Analyze their characteristics, revenue, occupancy rate, and ADR to understand what drives success in this market.

Summer house near Rørvig.
Entire Place • 1 bedroom

Modern sommerhus
Entire Place • 5 bedrooms

Newly renovated classic cottage in Rørvig
Entire Place • 2 bedrooms
Fantastic log cabin
Entire Place • 3 bedrooms
Kløverhytten 400m to the beach. Large natural plot
Entire Place • 3 bedrooms
Spacious and cozy house near beach and harbour
Entire Place • 3 bedrooms
Note: Performance varies based on location, size, amenities, seasonality, and management quality. Data reflects the past 12 months.
Top Performing Airbnb Hosts in Øster Lyng (2026)
Learn from the best! This table showcases top-performing Airbnb hosts in Øster Lyng based on the number of properties managed and estimated total revenue over the past year. Analyze their scale and performance metrics.
| Host Name | Properties | Grossing Revenue | Stay Reviews | Avg Rating |
|---|---|---|---|---|
| Michael | 1 | $41,239 | 26 | 4.92/5.0 |
| Gitte | 1 | $32,278 | 15 | 4.80/5.0 |
| Annette | 1 | $29,308 | 22 | 4.86/5.0 |
| Rose-Marie | 1 | $28,292 | 17 | 4.94/5.0 |
| Mette B | 1 | $27,690 | 46 | 4.91/5.0 |
| Kristine | 1 | $25,007 | 25 | 4.68/5.0 |
| Helena | 1 | $24,212 | 6 | 5.00/5.0 |
| Stine Cecilie | 1 | $23,854 | 29 | 4.97/5.0 |
| Morten | 1 | $21,777 | 145 | 4.81/5.0 |
| Christian | 1 | $21,692 | 8 | 5.00/5.0 |
Analyzing the strategies of top hosts, such as their property selection, pricing, and guest communication, can offer valuable lessons for optimizing your own Airbnb operations in Øster Lyng.
Dive Deeper: Advanced Øster Lyng STR Market Data (2026)
Ready to unlock more insights? AirROI provides access to advanced metrics and comprehensive Airbnb data for Øster Lyng. Explore detailed analytics beyond this report to refine your investment strategy, optimize pricing, and maximize your vacation rental profits.
Explore Advanced MetricsØster Lyng Short-Term Rental Market Composition (2026): Property & Room Types
Room Type Distribution
Property Type Distribution
Market Composition Insights for Øster Lyng
- The Øster Lyng Airbnb market composition is heavily skewed towards Entire Home/Apt listings, which make up 100% of the 56 active rentals. This indicates strong guest preference for privacy and space.
- Looking at the property type distribution in Øster Lyng, House properties are the most common (55.4%), reflecting the local real estate landscape.
- Houses represent a significant 55.4% portion, catering likely to families or larger groups.
- Smaller segments like hotel/boutique (combined 3.6%) offer potential for unique stay experiences.
Øster Lyng Airbnb Room Capacity Analysis (2026): Bedroom Distribution
Distribution of Listings by Number of Bedrooms
Room Capacity Insights for Øster Lyng
- The dominant room capacity in Øster Lyng is 3 bedrooms listings, making up 44.6% of the market. This suggests a strong demand for properties suitable for families or small groups.
- Together, 3 bedrooms and 2 bedrooms properties represent 76.7% of the active Airbnb listings in Øster Lyng, indicating a high concentration in these sizes.
- A significant 62.5% of listings offer 3+ bedrooms, catering to larger groups and families seeking more space in Øster Lyng.
Øster Lyng Vacation Rental Guest Capacity Trends (2026)
Distribution of Listings by Guest Capacity
Guest Capacity Insights for Øster Lyng
- The most common guest capacity trend in Øster Lyng vacation rentals is listings accommodating 6 guests (37.5%). This suggests the primary traveler segment is likely larger groups.
- Properties designed for 6 guests and 4 guests dominate the Øster Lyng STR market, accounting for 62.5% of listings.
- 64.2% of properties accommodate 6+ guests, serving the market segment for larger families or group travel in Øster Lyng.
- On average, properties in Øster Lyng are equipped to host 5.8 guests.
Øster Lyng Airbnb Booking Patterns (2026): Available vs. Booked Days
Available Days Distribution
Booked Days Distribution
Booking Pattern Insights for Øster Lyng
- The most common availability pattern in Øster Lyng falls within the 271-366 days range, representing 75% of listings. This suggests many properties have significant open periods on their calendars.
- Approximately 96.4% of listings show high availability (181+ days open annually), indicating potential for increased bookings or specific owner usage patterns.
- For booked days, the 31-90 days range is most frequent in Øster Lyng (57.1%), reflecting common guest stay durations or potential owner blocking patterns.
- A notable 3.6% of properties secure long booking periods (181+ days booked per year), highlighting successful long-term rental strategies or significant owner usage.
Øster Lyng Airbnb Minimum Stay Requirements Analysis
Distribution of Listings by Minimum Night Requirement
1 Night
2 listings
3.6% of total
2 Nights
10 listings
17.9% of total
3 Nights
11 listings
19.6% of total
4-6 Nights
12 listings
21.4% of total
7-29 Nights
2 listings
3.6% of total
30+ Nights
19 listings
33.9% of total
Key Insights
- The most prevalent minimum stay requirement in Øster Lyng is 30+ Nights, adopted by 33.9% of listings. This highlights the market's preference for longer commitments.
- A significant segment (33.9%) caters to monthly stays (30+ nights) in Øster Lyng, pointing to opportunities in the extended-stay market.
Recommendations
- Align with the market by considering a 30+ Nights minimum stay, as 33.9% of Øster Lyng hosts use this setting.
- If feasible, allowing 1-night stays, especially midweek or during low season, could capture last-minute bookings, as only 3.6% currently do.
- Explore offering discounts for stays of 30+ nights to attract the 33.9% of the market seeking extended stays.
- Adjust minimum nights based on seasonality – potentially shorter during low season and longer during peak demand periods in Øster Lyng.
Øster Lyng Airbnb Cancellation Policy Trends Analysis (2026)
Super Strict 30 Days
1 listings
1.8% of total
Flexible
9 listings
16.1% of total
Moderate
23 listings
41.1% of total
Firm
19 listings
33.9% of total
Strict
4 listings
7.1% of total
Cancellation Policy Insights for Øster Lyng
- The prevailing Airbnb cancellation policy trend in Øster Lyng is Moderate, used by 41.1% of listings.
- There's a relatively balanced mix between guest-friendly (57.2%) and stricter (41.0%) policies, offering choices for different guest needs.
- Strict cancellation policies are quite rare (7.1%), potentially making listings with this policy less competitive unless justified by high demand or property type.
Recommendations for Hosts
- Consider adopting a Moderate policy to align with the 41.1% market standard in Øster Lyng.
- Using a Strict policy might deter some guests, as only 7.1% of listings use it. Evaluate if potential revenue protection outweighs possible lower booking rates.
- Regularly review your cancellation policy against competitors and market demand shifts in Øster Lyng.
Øster Lyng STR Booking Lead Time Analysis (2026)
Average Booking Lead Time by Month
Booking Lead Time Insights for Øster Lyng
- The overall average booking lead time for vacation rentals in Øster Lyng is 59 days.
- Guests book furthest in advance for stays during July (average 109 days), likely coinciding with peak travel demand or local events.
- The shortest booking windows occur for stays in November (average 16 days), indicating more last-minute travel plans during this time.
- Seasonally, Summer (80 days avg.) sees the longest lead times, while Fall (29 days avg.) has the shortest, reflecting typical travel planning cycles.
Recommendations for Hosts
- Use the overall average lead time (59 days) as a baseline for your pricing and availability strategy in Øster Lyng.
- For July stays, consider implementing length-of-stay discounts or slightly higher rates for bookings made less than 109 days out to capitalize on advance planning.
- Target marketing efforts for the Summer season well in advance (at least 80 days) to capture early planners.
- Monitor your own booking lead times against these Øster Lyng averages to identify opportunities for dynamic pricing adjustments.
Popular & Essential Airbnb Amenities in Øster Lyng (2026)
Amenity Prevalence
Amenity Insights for Øster Lyng
- Essential amenities in Øster Lyng that guests expect include: Kitchen. Lacking these (this) could significantly impact bookings.
- Popular amenities like Free parking on premises, Refrigerator, Outdoor dining area are common but not universal. Offering these can provide a competitive edge.
- Warning: Wifi is not universally provided but is considered essential globally. Ensure reliable Wifi is offered.
Recommendations for Hosts
- Ensure your listing includes all essential amenities for Øster Lyng: Kitchen.
- Consider adding popular differentiators like Free parking on premises or Refrigerator to increase appeal.
- Highlight unique or less common amenities you offer (e.g., hot tub, dedicated workspace, EV charger) in your listing description and photos.
- Regularly check competitor amenities in Øster Lyng to stay competitive.
Øster Lyng Airbnb Guest Demographics & Profile Analysis (2026)
Guest Profile Summary for Øster Lyng
- The typical guest profile for Airbnb in Øster Lyng consists of primarily domestic travelers (69%), often arriving from nearby Copenhagen, typically belonging to the Post-2000s (Gen Z/Alpha) group (50%), primarily speaking English or Danish.
- Domestic travelers account for 69.4% of guests.
- Key international markets include Denmark (69.4%) and Germany (14.5%).
- Top languages spoken are English (39%) followed by Danish (29.5%).
- A significant demographic segment is the Post-2000s (Gen Z/Alpha) group, representing 50% of guests.
Recommendations for Hosts
- Target domestic marketing efforts towards travelers from Copenhagen and Aarhus.
- Tailor amenities and listing descriptions to appeal to the dominant Post-2000s (Gen Z/Alpha) demographic (e.g., highlight fast WiFi, smart home features, local guides).
- Highlight unique local experiences or amenities relevant to the primary guest profile.
- Consider seasonal promotions aligned with peak travel times for key origin markets.
Nearby Short-Term Rental Market Comparison
How does the Øster Lyng Airbnb market stack up against its neighbors? Compare key performance metrics like average monthly revenue, ADR, and occupancy rates in surrounding areas to understand the broader regional STR landscape.
| Market | Active Properties | Monthly Revenue | Daily Rate | Avg. Occupancy |
|---|---|---|---|---|
| Wittenbeck | 14 | $2,937 | $224.34 | 43% |
| Lohals | 20 | $2,866 | $331.99 | 40% |
| Copenhagen | 9,111 | $2,347 | $222.94 | 52% |
| Bissee | 13 | $2,338 | $180.13 | 48% |
| Råbylille Strand | 31 | $2,254 | $190.70 | 45% |
| Saunte | 10 | $2,212 | $213.23 | 46% |
| Rude Strand | 27 | $2,198 | $254.15 | 41% |
| Korshavn | 14 | $2,192 | $244.24 | 41% |
| Tørresø Strand | 26 | $2,145 | $235.54 | 42% |
| Harmsdorf | 10 | $2,076 | $326.10 | 36% |