Vejers Strand Airbnb Market Analysis 2026: Short Term Rental Data & Vacation Rental Statistics in Region of Southern Denmark, Denmark
Is Airbnb profitable in Vejers Strand in 2026? Explore comprehensive Airbnb analytics for Vejers Strand, Region of Southern Denmark, Denmark to uncover income potential. This 2026 STR market report for Vejers Strand, based on AirROI data from February 2025 to January 2026, reveals key trends in the niche market of 97 active listings.
Whether you're considering an Airbnb investment in Vejers Strand, optimizing your existing vacation rental, or exploring rental arbitrage opportunities, understanding the Vejers Strand Airbnb data is crucial. Leveraging the low regulation environment is key to maximizing your short term rental income potential. Let's dive into the specifics.
Key Vejers Strand Airbnb Performance Metrics Overview
Monthly Airbnb Revenue Variations & Income Potential in Vejers Strand (2026)
Understanding the monthly revenue variations for Airbnb listings in Vejers Strand is key to maximizing your short term rental income potential. Seasonality significantly impacts earnings. Our analysis, based on data from the past 12 months, shows that the peak revenue month for STRs in Vejers Strand is typically August, while January often presents the lowest earnings, highlighting opportunities for strategic pricing adjustments during shoulder and low seasons. Explore the typical Airbnb income in Vejers Strand across different performance tiers:
- Best-in-class properties (Top 10%) achieve $5,049+ monthly, often utilizing dynamic pricing and superior guest experiences.
- Strong performing properties (Top 25%) earn $3,412 or more, indicating effective management and desirable locations/amenities.
- Typical properties (Median) generate around $2,106 per month, representing the average market performance.
- Entry-level properties (Bottom 25%) see earnings around $1,157, often with potential for optimization.
Average Monthly Airbnb Earnings Trend in Vejers Strand
Vejers Strand Airbnb Occupancy Rate Trends (2026)
Maximize your bookings by understanding the Vejers Strand STR occupancy trends. Seasonal demand shifts significantly influence how often properties are booked. Typically, Augustsees the highest demand (peak season occupancy), while January experiences the lowest (low season). Effective strategies, like adjusting minimum stays or offering promotions, can boost occupancy during slower periods. Here's how different property tiers perform in Vejers Strand:
- Best-in-class properties (Top 10%) achieve 73%+ occupancy, indicating high desirability and potentially optimized availability.
- Strong performing properties (Top 25%) maintain 58% or higher occupancy, suggesting good market fit and guest satisfaction.
- Typical properties (Median) have an occupancy rate around 37%.
- Entry-level properties (Bottom 25%) average 19% occupancy, potentially facing higher vacancy.
Average Monthly Occupancy Rate Trend in Vejers Strand
Average Daily Rate (ADR) Airbnb Trends in Vejers Strand (2026)
Effective short term rental pricing strategy in Vejers Strand involves understanding monthly ADR fluctuations. The Average Daily Rate (ADR) for Airbnb in Vejers Strand typically peaks in July and dips lowest during November. Leveraging Airbnb dynamic pricing tools or strategies based on this seasonality can significantly boost revenue. Here's a look at the typical nightly rates achieved:
- Best-in-class properties (Top 10%) command rates of $303+ per night, often due to premium features or locations.
- Strong performing properties (Top 25%) achieve nightly rates of $226 or more.
- Typical properties (Median) charge around $172 per night.
- Entry-level properties (Bottom 25%) earn around $132 per night.
Average Daily Rate (ADR) Trend by Month in Vejers Strand
Get Live Vejers Strand Market Intelligence 👇

Explore Real-time Analytics
Airbnb Seasonality Analysis & Trends in Vejers Strand (2026)
Peak Season (August, July, June)
- Revenue averages $4,297 per month
- Occupancy rates average 60.3%
- Daily rates average $220
Shoulder Season
- Revenue averages $2,282 per month
- Occupancy maintains around 40.0%
- Daily rates hold near $184
Low Season (January, October, November)
- Revenue drops to average $1,152 per month
- Occupancy decreases to average 21.4%
- Daily rates adjust to average $174
Seasonality Insights for Vejers Strand
- The Airbnb seasonality in Vejers Strand shows highly seasonal trends requiring careful strategy. While the sections above show seasonal averages, it's also insightful to look at the extremes:
- During the high season, the absolute peak month showcases Vejers Strand's highest earning potential, with monthly revenues capable of climbing to $5,167, occupancy reaching a high of 69.2%, and ADRs peaking at $232.
- Conversely, the slowest single month of the year, typically falling within the low season, marks the market's lowest point. In this month, revenue might dip to $727, occupancy could drop to 12.0%, and ADRs may adjust down to $164.
- Understanding both the seasonal averages and these monthly peaks and troughs in revenue, occupancy, and ADR is crucial for maximizing your Airbnb profit potential in Vejers Strand.
Seasonal Strategies for Maximizing Profit
- Peak Season: Maximize revenue through premium pricing and potentially longer minimum stays. Ensure high availability.
- Low Season: Offer competitive pricing, special promotions (e.g., extended stay discounts), and flexible cancellation policies. Target off-season travelers like remote workers or budget-conscious guests.
- Shoulder Seasons: Implement dynamic pricing that balances peak and low rates. Target weekend travelers or specific events. Offer slightly more flexible terms than peak season.
- Regularly analyze your own performance against these Vejers Strand seasonality benchmarks and adjust your pricing and availability strategy accordingly.
Best Areas for Airbnb Investment in Vejers Strand (2026)
Exploring the top neighborhoods for short-term rentals in Vejers Strand? This section highlights key areas, outlining why they are attractive for hosts and guests, along with notable local attractions. Consider these locations based on your target guest profile and investment strategy.
| Neighborhood / Area | Why Host Here? (Target Guests & Appeal) | Key Attractions & Landmarks |
|---|---|---|
| Vejers Strand Beach | A tranquil beach destination known for its wide sandy beaches and natural beauty, perfect for families and nature lovers. Offers a peaceful getaway with access to water activities. | Vejers Strand Beach, Bike trails, Dune landscapes, Local eateries, Fishing opportunities |
| Vejers Strand Center | The lively center of Vejers Strand with shops, restaurants, and cafes. A great spot for visitors who want to enjoy local amenities and a vibrant community atmosphere. | Local shops, Restaurants, Cafes, Art galleries, Community events |
| Nearby Nature Reserves | Proximity to natural reserves that offer hiking, bird watching, and outdoor activities. Attracts nature enthusiasts looking to explore the rich biodiversity of the region. | Blåvand Nature Reserve, Marbæk Plantage, Birdwatching spots, Scenic walking trails |
| Blåvand | Just a short drive from Vejers Strand, Blåvand is known for its beautiful beaches and lively tourism scene. Ideal for visitors looking for a mix of relaxation and activities. | Blåvand Beach, Blåvand's lighthouse, Shopping in Blåvand, Local seafood restaurants, Historical sites |
| Hvidbjerg Strand | A family-friendly area with great facilities, close to the beach and numerous vacation activities. Known for its campsites and summer houses. | Hvidbjerg Strand, Children's play areas, Water sports activities, Nearby camping sites |
| Billund | A bit farther but reachable, it's home to LEGOLAND and the Billund Airport, attracting families and international visitors. A good option for hosting families on holiday. | LEGOLAND, Billund Airport, Lalandia Water Park, Local dining options |
| Oksbøl | A nearby town with rich history and access to the natural beauty of the West Coast. A quieter alternative for visitors looking to explore the countryside. | Oksbøl Church, Local museums, Natural areas, Cycling routes |
| Aarhus | Though further away, Aarhus is Denmark's second-largest city with a vibrant culture and attractions, appealing to those who want to combine beach relaxation with city exploration. | Aarhus Art Museum, Den Gamle By, Aarhus Botanical Gardens, Shopping districts, Cafes and nightlife |
Understanding Airbnb License Requirements & STR Laws in Vejers Strand (2026)
While Vejers Strand, Region of Southern Denmark, Denmark currently shows low STR regulations, specific Airbnb license requirements might still exist or change. Always verify the latest short term rental regulations and Airbnb license requirements directly with local government authorities for Vejers Strand to ensure full compliance before hosting.
(Source: AirROI data, 2026, finding no licensed listings among those analyzed)
Top Performing Airbnb Properties in Vejers Strand (2026)
Benchmark your potential! Explore examples of top-performing Airbnb properties in Vejers Strandbased on Trailing Twelve Month (TTM) revenue. Analyze their characteristics, revenue, occupancy rate, and ADR to understand what drives success in this market.
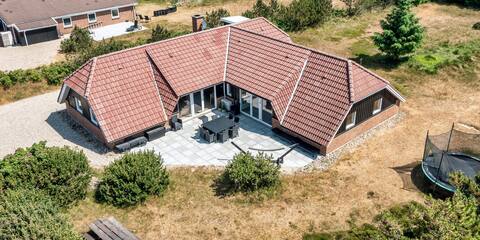
VE393 Cozy cottage with pool close to forest
Entire Place • 5 bedrooms
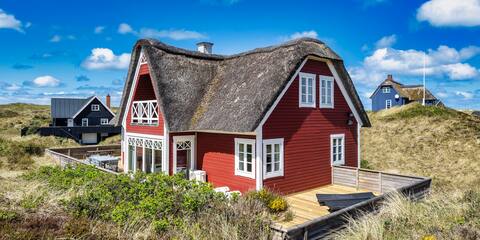
VE240 Tasteful thatched cottage
Entire Place • 4 bedrooms
VE281 Bright newly renovated pool house for 10
Entire Place • 4 bedrooms
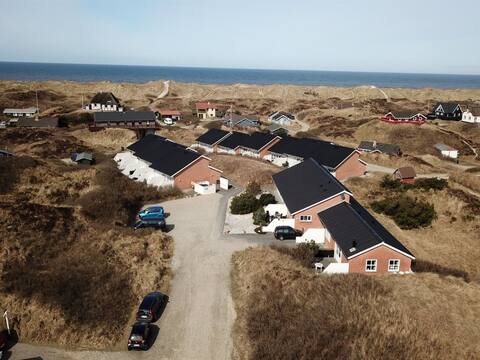
"Soufiane" - 100m from the sea by Interhome
Entire Place • 3 bedrooms

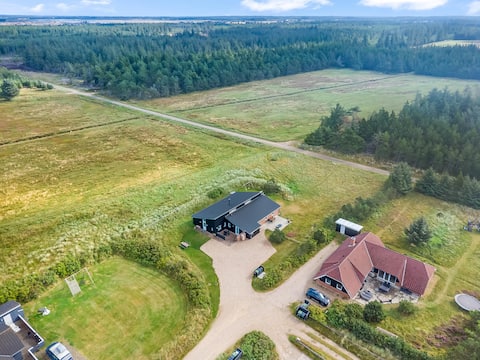
VE282 Welcoming holiday home with wilderness bath
Entire Place • 3 bedrooms
Summer house pearl by the North Sea
Entire Place • 2 bedrooms
Note: Performance varies based on location, size, amenities, seasonality, and management quality. Data reflects the past 12 months.
Top Performing Airbnb Hosts in Vejers Strand (2026)
Learn from the best! This table showcases top-performing Airbnb hosts in Vejers Strand based on the number of properties managed and estimated total revenue over the past year. Analyze their scale and performance metrics.
| Host Name | Properties | Grossing Revenue | Stay Reviews | Avg Rating |
|---|---|---|---|---|
| Die Hyggelige Dänen | 70 | $898,838 | 104 | 4.62/5.0 |
| Maike - Interhome | 6 | $56,193 | 8 | Not Rated |
| Annika - Interhome | 2 | $39,213 | 2 | Not Rated |
| Steffi - Interhome | 1 | $35,095 | 1 | Not Rated |
| David | 2 | $33,577 | 170 | 4.89/5.0 |
| Mike | 1 | $33,181 | 70 | 4.87/5.0 |
| Elise Sofie | 1 | $29,316 | 49 | 4.98/5.0 |
| Henning | 1 | $24,656 | 38 | 4.89/5.0 |
| Martina - Interhome | 1 | $22,469 | 1 | Not Rated |
| Maria Og Anders | 1 | $19,428 | 169 | 4.74/5.0 |
Analyzing the strategies of top hosts, such as their property selection, pricing, and guest communication, can offer valuable lessons for optimizing your own Airbnb operations in Vejers Strand.
Dive Deeper: Advanced Vejers Strand STR Market Data (2026)
Ready to unlock more insights? AirROI provides access to advanced metrics and comprehensive Airbnb data for Vejers Strand. Explore detailed analytics beyond this report to refine your investment strategy, optimize pricing, and maximize your vacation rental profits.
Explore Advanced MetricsVejers Strand Short-Term Rental Market Composition (2026): Property & Room Types
Room Type Distribution
Property Type Distribution
Market Composition Insights for Vejers Strand
- The Vejers Strand Airbnb market composition is heavily skewed towards Entire Home/Apt listings, which make up 99% of the 97 active rentals. This indicates strong guest preference for privacy and space.
- Looking at the property type distribution in Vejers Strand, House properties are the most common (89.7%), reflecting the local real estate landscape.
- Houses represent a significant 89.7% portion, catering likely to families or larger groups.
- Smaller segments like outdoor/unique, others, hotel/boutique (combined 5.1%) offer potential for unique stay experiences.
Vejers Strand Airbnb Room Capacity Analysis (2026): Bedroom Distribution
Distribution of Listings by Number of Bedrooms
Room Capacity Insights for Vejers Strand
- The dominant room capacity in Vejers Strand is 3 bedrooms listings, making up 45.4% of the market. This suggests a strong demand for properties suitable for families or small groups.
- Together, 3 bedrooms and 4 bedrooms properties represent 67.0% of the active Airbnb listings in Vejers Strand, indicating a high concentration in these sizes.
- A significant 75.2% of listings offer 3+ bedrooms, catering to larger groups and families seeking more space in Vejers Strand.
Vejers Strand Vacation Rental Guest Capacity Trends (2026)
Distribution of Listings by Guest Capacity
Guest Capacity Insights for Vejers Strand
- The most common guest capacity trend in Vejers Strand vacation rentals is listings accommodating 6 guests (39.2%). This suggests the primary traveler segment is likely larger groups.
- Properties designed for 6 guests and 8+ guests dominate the Vejers Strand STR market, accounting for 66.0% of listings.
- 68.1% of properties accommodate 6+ guests, serving the market segment for larger families or group travel in Vejers Strand.
- On average, properties in Vejers Strand are equipped to host 5.8 guests.
Vejers Strand Airbnb Booking Patterns (2026): Available vs. Booked Days
Available Days Distribution
Booked Days Distribution
Booking Pattern Insights for Vejers Strand
- The most common availability pattern in Vejers Strand falls within the 271-366 days range, representing 81.4% of listings. This suggests many properties have significant open periods on their calendars.
- Approximately 94.8% of listings show high availability (181+ days open annually), indicating potential for increased bookings or specific owner usage patterns.
- For booked days, the 31-90 days range is most frequent in Vejers Strand (50.5%), reflecting common guest stay durations or potential owner blocking patterns.
- A notable 6.2% of properties secure long booking periods (181+ days booked per year), highlighting successful long-term rental strategies or significant owner usage.
Vejers Strand Airbnb Minimum Stay Requirements Analysis
Distribution of Listings by Minimum Night Requirement
1 Night
70 listings
72.2% of total
4-6 Nights
2 listings
2.1% of total
7-29 Nights
1 listings
1% of total
30+ Nights
24 listings
24.7% of total
Key Insights
- The most prevalent minimum stay requirement in Vejers Strand is 1 Night, adopted by 72.2% of listings. This highlights the market's preference for shorter, flexible bookings.
- A strong majority (72.2%) of the Vejers Strand Airbnb data shows acceptance of very short stays (1-2 nights), indicating a dynamic, high-turnover market.
- A significant segment (24.7%) caters to monthly stays (30+ nights) in Vejers Strand, pointing to opportunities in the extended-stay market.
Recommendations
- Align with the market by considering a 1 Night minimum stay, as 72.2% of Vejers Strand hosts use this setting.
- Explore offering discounts for stays of 30+ nights to attract the 24.7% of the market seeking extended stays.
- Adjust minimum nights based on seasonality – potentially shorter during low season and longer during peak demand periods in Vejers Strand.
Vejers Strand Airbnb Cancellation Policy Trends Analysis (2026)
Flexible
3 listings
3.1% of total
Moderate
2 listings
2.1% of total
Firm
91 listings
93.8% of total
Strict
1 listings
1% of total
Cancellation Policy Insights for Vejers Strand
- The prevailing Airbnb cancellation policy trend in Vejers Strand is Firm, used by 93.8% of listings.
- A majority (94.8%) of hosts in Vejers Strand utilize Firm or Strict policies, indicating a market where hosts prioritize booking security.
- Strict cancellation policies are quite rare (1%), potentially making listings with this policy less competitive unless justified by high demand or property type.
Recommendations for Hosts
- Consider adopting a Firm policy to align with the 93.8% market standard in Vejers Strand.
- Using a Strict policy might deter some guests, as only 1% of listings use it. Evaluate if potential revenue protection outweighs possible lower booking rates.
- Regularly review your cancellation policy against competitors and market demand shifts in Vejers Strand.
Vejers Strand STR Booking Lead Time Analysis (2026)
Average Booking Lead Time by Month
Booking Lead Time Insights for Vejers Strand
- The overall average booking lead time for vacation rentals in Vejers Strand is 119 days.
- Guests book furthest in advance for stays during December (average 200 days), likely coinciding with peak travel demand or local events.
- The shortest booking windows occur for stays in February (average 24 days), indicating more last-minute travel plans during this time.
- Seasonally, Summer (144 days avg.) sees the longest lead times, while Spring (70 days avg.) has the shortest, reflecting typical travel planning cycles.
Recommendations for Hosts
- Use the overall average lead time (119 days) as a baseline for your pricing and availability strategy in Vejers Strand.
- For December stays, consider implementing length-of-stay discounts or slightly higher rates for bookings made less than 200 days out to capitalize on advance planning.
- Target marketing efforts for the Summer season well in advance (at least 144 days) to capture early planners.
- Monitor your own booking lead times against these Vejers Strand averages to identify opportunities for dynamic pricing adjustments.
Popular & Essential Airbnb Amenities in Vejers Strand (2026)
Amenity Prevalence
Amenity Insights for Vejers Strand
- Essential amenities in Vejers Strand that guests expect include: Kitchen, Heating, Private entrance, TV, Wifi, Refrigerator. Lacking these (any) could significantly impact bookings.
- Popular amenities like Stove, Freezer, Oven are common but not universal. Offering these can provide a competitive edge.
Recommendations for Hosts
- Ensure your listing includes all essential amenities for Vejers Strand: Kitchen, Heating, Private entrance, TV, Wifi, Refrigerator.
- Prioritize adding missing essentials: Kitchen, Heating, Private entrance, TV, Wifi, Refrigerator.
- Consider adding popular differentiators like Stove or Freezer to increase appeal.
- Highlight unique or less common amenities you offer (e.g., hot tub, dedicated workspace, EV charger) in your listing description and photos.
- Regularly check competitor amenities in Vejers Strand to stay competitive.
Vejers Strand Airbnb Guest Demographics & Profile Analysis (2026)
Guest Profile Summary for Vejers Strand
- The typical guest profile for Airbnb in Vejers Strand consists of predominantly international visitors (84%), with top international origins including Denmark, typically belonging to the Post-2000s (Gen Z/Alpha) group (50%), primarily speaking English or German.
- Domestic travelers account for 15.9% of guests.
- Key international markets include Germany (75.4%) and Denmark (15.9%).
- Top languages spoken are English (40.7%) followed by German (37.1%).
- A significant demographic segment is the Post-2000s (Gen Z/Alpha) group, representing 50% of guests.
Recommendations for Hosts
- Focus marketing internationally, particularly towards travelers from Denmark.
- Tailor amenities and listing descriptions to appeal to the dominant Post-2000s (Gen Z/Alpha) demographic (e.g., highlight fast WiFi, smart home features, local guides).
- Highlight unique local experiences or amenities relevant to the primary guest profile.
- Consider seasonal promotions aligned with peak travel times for key origin markets.
Nearby Short-Term Rental Market Comparison
How does the Vejers Strand Airbnb market stack up against its neighbors? Compare key performance metrics like average monthly revenue, ADR, and occupancy rates in surrounding areas to understand the broader regional STR landscape.
| Market | Active Properties | Monthly Revenue | Daily Rate | Avg. Occupancy |
|---|---|---|---|---|
| Husum-Ballum | 13 | $4,837 | $499.93 | 44% |
| Blåvand | 16 | $2,374 | $318.93 | 40% |
| Helgoland | 11 | $2,199 | $167.07 | 58% |
| Billund | 105 | $2,027 | $194.14 | 46% |
| Søndervig | 45 | $2,002 | $328.05 | 31% |
| Tetenbüll | 29 | $1,849 | $238.36 | 34% |
| Sunds | 18 | $1,845 | $229.08 | 43% |
| Fjaltring | 11 | $1,827 | $150.64 | 48% |
| Kampen (Sylt) | 25 | $1,824 | $508.88 | 23% |
| Ringkøbing-Skjern Municipality | 204 | $1,754 | $244.41 | 41% |