Tønder Municipality Airbnb Market Analysis 2026: Short Term Rental Data & Vacation Rental Statistics in Region of Southern Denmark, Denmark
Is Airbnb profitable in Tønder Municipality in 2026? Explore comprehensive Airbnb analytics for Tønder Municipality, Region of Southern Denmark, Denmark to uncover income potential. This 2026 STR market report for Tønder Municipality, based on AirROI data from February 2025 to January 2026, reveals key trends in the market of 218 active listings.
Whether you're considering an Airbnb investment in Tønder Municipality, optimizing your existing vacation rental, or exploring rental arbitrage opportunities, understanding the Tønder Municipality Airbnb data is crucial. Leveraging the low regulation environment is key to maximizing your short term rental income potential. Let's dive into the specifics.
Key Tønder Municipality Airbnb Performance Metrics Overview
Monthly Airbnb Revenue Variations & Income Potential in Tønder Municipality (2026)
Understanding the monthly revenue variations for Airbnb listings in Tønder Municipality is key to maximizing your short term rental income potential. Seasonality significantly impacts earnings. Our analysis, based on data from the past 12 months, shows that the peak revenue month for STRs in Tønder Municipality is typically July, while January often presents the lowest earnings, highlighting opportunities for strategic pricing adjustments during shoulder and low seasons. Explore the typical Airbnb income in Tønder Municipality across different performance tiers:
- Best-in-class properties (Top 10%) achieve $6,103+ monthly, often utilizing dynamic pricing and superior guest experiences.
- Strong performing properties (Top 25%) earn $3,733 or more, indicating effective management and desirable locations/amenities.
- Typical properties (Median) generate around $2,009 per month, representing the average market performance.
- Entry-level properties (Bottom 25%) see earnings around $906, often with potential for optimization.
Average Monthly Airbnb Earnings Trend in Tønder Municipality
Tønder Municipality Airbnb Occupancy Rate Trends (2026)
Maximize your bookings by understanding the Tønder Municipality STR occupancy trends. Seasonal demand shifts significantly influence how often properties are booked. Typically, Julysees the highest demand (peak season occupancy), while January experiences the lowest (low season). Effective strategies, like adjusting minimum stays or offering promotions, can boost occupancy during slower periods. Here's how different property tiers perform in Tønder Municipality:
- Best-in-class properties (Top 10%) achieve 80%+ occupancy, indicating high desirability and potentially optimized availability.
- Strong performing properties (Top 25%) maintain 60% or higher occupancy, suggesting good market fit and guest satisfaction.
- Typical properties (Median) have an occupancy rate around 37%.
- Entry-level properties (Bottom 25%) average 18% occupancy, potentially facing higher vacancy.
Average Monthly Occupancy Rate Trend in Tønder Municipality
Average Daily Rate (ADR) Airbnb Trends in Tønder Municipality (2026)
Effective short term rental pricing strategy in Tønder Municipality involves understanding monthly ADR fluctuations. The Average Daily Rate (ADR) for Airbnb in Tønder Municipality typically peaks in December and dips lowest during March. Leveraging Airbnb dynamic pricing tools or strategies based on this seasonality can significantly boost revenue. Here's a look at the typical nightly rates achieved:
- Best-in-class properties (Top 10%) command rates of $463+ per night, often due to premium features or locations.
- Strong performing properties (Top 25%) achieve nightly rates of $302 or more.
- Typical properties (Median) charge around $188 per night.
- Entry-level properties (Bottom 25%) earn around $126 per night.
Average Daily Rate (ADR) Trend by Month in Tønder Municipality
Get Live Tønder Municipality Market Intelligence 👇

Explore Real-time Analytics
Airbnb Seasonality Analysis & Trends in Tønder Municipality (2026)
Peak Season (July, August, June)
- Revenue averages $3,874 per month
- Occupancy rates average 52.2%
- Daily rates average $254
Shoulder Season
- Revenue averages $2,680 per month
- Occupancy maintains around 38.6%
- Daily rates hold near $245
Low Season (January, February, March)
- Revenue drops to average $2,248 per month
- Occupancy decreases to average 33.6%
- Daily rates adjust to average $242
Seasonality Insights for Tønder Municipality
- The Airbnb seasonality in Tønder Municipality shows highly seasonal trends requiring careful strategy. While the sections above show seasonal averages, it's also insightful to look at the extremes:
- During the high season, the absolute peak month showcases Tønder Municipality's highest earning potential, with monthly revenues capable of climbing to $4,469, occupancy reaching a high of 58.4%, and ADRs peaking at $260.
- Conversely, the slowest single month of the year, typically falling within the low season, marks the market's lowest point. In this month, revenue might dip to $1,904, occupancy could drop to 23.3%, and ADRs may adjust down to $234.
- Understanding both the seasonal averages and these monthly peaks and troughs in revenue, occupancy, and ADR is crucial for maximizing your Airbnb profit potential in Tønder Municipality.
Seasonal Strategies for Maximizing Profit
- Peak Season: Maximize revenue through premium pricing and potentially longer minimum stays. Ensure high availability.
- Low Season: Offer competitive pricing, special promotions (e.g., extended stay discounts), and flexible cancellation policies. Target off-season travelers like remote workers or budget-conscious guests.
- Shoulder Seasons: Implement dynamic pricing that balances peak and low rates. Target weekend travelers or specific events. Offer slightly more flexible terms than peak season.
- Regularly analyze your own performance against these Tønder Municipality seasonality benchmarks and adjust your pricing and availability strategy accordingly.
Best Areas for Airbnb Investment in Tønder Municipality (2026)
Exploring the top neighborhoods for short-term rentals in Tønder Municipality? This section highlights key areas, outlining why they are attractive for hosts and guests, along with notable local attractions. Consider these locations based on your target guest profile and investment strategy.
| Neighborhood / Area | Why Host Here? (Target Guests & Appeal) | Key Attractions & Landmarks |
|---|---|---|
| Tønder City Center | The heart of Tønder with charming historic buildings and a rich cultural heritage. Ideal for visitors wanting to experience local Danish life and traditions. | Tønder Museum, Tønder Town Hall, The Parade Ground, Sønderjyllands Kunstmuseum, St. Laurentius Church |
| Løgumkloster | A quaint village known for its historic abbey and peaceful environment. Great for travelers looking for a relaxing stay amidst beautiful nature. | Løgum Abbey, Løgumkloster Museum, Sønderhåb Forest, Local cafes and shops |
| Møgeltønder | This picturesque village is near Schackenborg Castle, offering a unique blend of history and natural beauty. Ideal for heritage tourism. | Schackenborg Castle, The Windmill, Art galleries, Nature trails |
| Højer | A village close to the Wadden Sea, renowned for its unique landscape and bird watching opportunities. Perfect for nature enthusiasts. | Wadden Sea National Park, Højer Molle, Højer Windmill, Bird watching spots |
| Bov | Located near the border with Germany, it offers a multicultural atmosphere and easy access to both countries, appealing to a diverse range of guests. | Bov Church, Bov Museum, Shopping in nearby Germany |
| Rømø | An island destination known for beautiful beaches and outdoor activities. Attracts families and adventure seekers, especially in summer. | Rømø Beach, Lakolk Strand, Rømø's Wadden Sea |
| Skærbæk | A quiet town offering an authentic Danish experience, suitable for families and those seeking tranquility away from tourist crowds. | Skærbæk Kirke, Nature walks, Local markets |
| Ballum | A small village with a rich farming tradition, providing a peaceful country escape and close proximity to attractions in the Wadden Sea. | Ballum Church, Nature reserves, Traditional farms |
Understanding Airbnb License Requirements & STR Laws in Tønder Municipality (2026)
While Tønder Municipality, Region of Southern Denmark, Denmark currently shows low STR regulations, specific Airbnb license requirements might still exist or change. Always verify the latest short term rental regulations and Airbnb license requirements directly with local government authorities for Tønder Municipality to ensure full compliance before hosting.
(Source: AirROI data, 2026, finding no licensed listings among those analyzed)
Top Performing Airbnb Properties in Tønder Municipality (2026)
Benchmark your potential! Explore examples of top-performing Airbnb properties in Tønder Municipalitybased on Trailing Twelve Month (TTM) revenue. Analyze their characteristics, revenue, occupancy rate, and ADR to understand what drives success in this market.
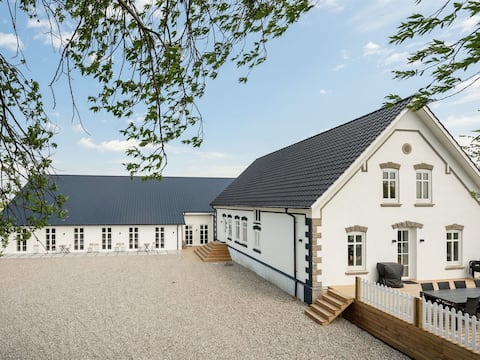
"Guthorm" by Interhome
Entire Place • 12 bedrooms
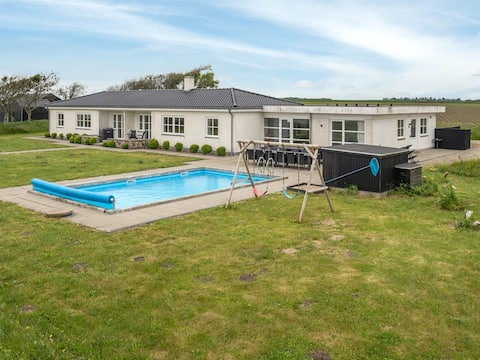
"Annagrete" - 12km from the sea by Interhome
Entire Place • 11 bedrooms
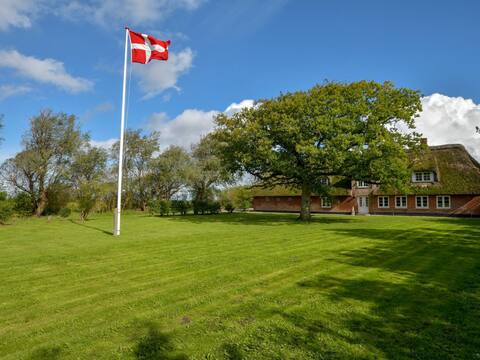
"Knut" - 10km from the sea by Interhome
Entire Place • 7 bedrooms
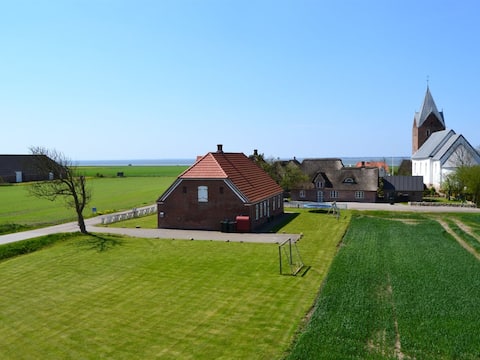
"Adine" - 13km from the sea by Interhome
Entire Place • 4 bedrooms

"Henrike" - 3.3km from the sea by Interhome
Entire Place • 6 bedrooms

"Elke" - 3.5km from the sea by Interhome
Entire Place • 3 bedrooms
Note: Performance varies based on location, size, amenities, seasonality, and management quality. Data reflects the past 12 months.
Top Performing Airbnb Hosts in Tønder Municipality (2026)
Learn from the best! This table showcases top-performing Airbnb hosts in Tønder Municipality based on the number of properties managed and estimated total revenue over the past year. Analyze their scale and performance metrics.
| Host Name | Properties | Grossing Revenue | Stay Reviews | Avg Rating |
|---|---|---|---|---|
| Steffi - Interhome | 20 | $845,864 | 45 | 4.42/5.0 |
| Martina - Interhome | 30 | $734,899 | 44 | 3.97/5.0 |
| Martina - Interhome | 32 | $581,158 | 47 | 4.67/5.0 |
| Johanne - DANCENTER | 24 | $210,125 | 225 | 4.14/5.0 |
| Campaya | 3 | $142,909 | 22 | 4.35/5.0 |
| Christence | 2 | $69,041 | 184 | 4.98/5.0 |
| Torsten | 2 | $60,935 | 214 | 4.58/5.0 |
| Lotte Og Daniel | 1 | $58,589 | 24 | 4.79/5.0 |
| Hanne + Kurt | 2 | $56,040 | 130 | 4.71/5.0 |
| Maike - Interhome | 2 | $51,695 | 3 | Not Rated |
Analyzing the strategies of top hosts, such as their property selection, pricing, and guest communication, can offer valuable lessons for optimizing your own Airbnb operations in Tønder Municipality.
Dive Deeper: Advanced Tønder Municipality STR Market Data (2026)
Ready to unlock more insights? AirROI provides access to advanced metrics and comprehensive Airbnb data for Tønder Municipality. Explore detailed analytics beyond this report to refine your investment strategy, optimize pricing, and maximize your vacation rental profits.
Explore Advanced MetricsTønder Municipality Short-Term Rental Market Composition (2026): Property & Room Types
Room Type Distribution
Property Type Distribution
Market Composition Insights for Tønder Municipality
- The Tønder Municipality Airbnb market composition is heavily skewed towards Entire Home/Apt listings, which make up 92.2% of the 218 active rentals. This indicates strong guest preference for privacy and space.
- Looking at the property type distribution in Tønder Municipality, House properties are the most common (72%), reflecting the local real estate landscape.
- Houses represent a significant 72% portion, catering likely to families or larger groups.
- Smaller segments like hotel/boutique, others (combined 5.1%) offer potential for unique stay experiences.
Tønder Municipality Airbnb Room Capacity Analysis (2026): Bedroom Distribution
Distribution of Listings by Number of Bedrooms
Room Capacity Insights for Tønder Municipality
- The dominant room capacity in Tønder Municipality is 3 bedrooms listings, making up 34.9% of the market. This suggests a strong demand for properties suitable for families or small groups.
- Together, 3 bedrooms and 2 bedrooms properties represent 52.8% of the active Airbnb listings in Tønder Municipality, indicating a high concentration in these sizes.
- A significant 66.1% of listings offer 3+ bedrooms, catering to larger groups and families seeking more space in Tønder Municipality.
Tønder Municipality Vacation Rental Guest Capacity Trends (2026)
Distribution of Listings by Guest Capacity
Guest Capacity Insights for Tønder Municipality
- The most common guest capacity trend in Tønder Municipality vacation rentals is listings accommodating 8+ guests (33%). This suggests the primary traveler segment is likely larger groups.
- Properties designed for 8+ guests and 6 guests dominate the Tønder Municipality STR market, accounting for 61.9% of listings.
- 64.7% of properties accommodate 6+ guests, serving the market segment for larger families or group travel in Tønder Municipality.
- On average, properties in Tønder Municipality are equipped to host 5.7 guests.
Tønder Municipality Airbnb Booking Patterns (2026): Available vs. Booked Days
Available Days Distribution
Booked Days Distribution
Booking Pattern Insights for Tønder Municipality
- The most common availability pattern in Tønder Municipality falls within the 271-366 days range, representing 59.6% of listings. This suggests many properties have significant open periods on their calendars.
- Approximately 85.7% of listings show high availability (181+ days open annually), indicating potential for increased bookings or specific owner usage patterns.
- For booked days, the 31-90 days range is most frequent in Tønder Municipality (29.8%), reflecting common guest stay durations or potential owner blocking patterns.
- A notable 15.1% of properties secure long booking periods (181+ days booked per year), highlighting successful long-term rental strategies or significant owner usage.
Tønder Municipality Airbnb Minimum Stay Requirements Analysis
Distribution of Listings by Minimum Night Requirement
1 Night
102 listings
46.8% of total
2 Nights
12 listings
5.5% of total
3 Nights
7 listings
3.2% of total
4-6 Nights
18 listings
8.3% of total
7-29 Nights
4 listings
1.8% of total
30+ Nights
75 listings
34.4% of total
Key Insights
- The most prevalent minimum stay requirement in Tønder Municipality is 1 Night, adopted by 46.8% of listings. This highlights the market's preference for shorter, flexible bookings.
- A significant segment (34.4%) caters to monthly stays (30+ nights) in Tønder Municipality, pointing to opportunities in the extended-stay market.
Recommendations
- Align with the market by considering a 1 Night minimum stay, as 46.8% of Tønder Municipality hosts use this setting.
- Explore offering discounts for stays of 30+ nights to attract the 34.4% of the market seeking extended stays.
- Adjust minimum nights based on seasonality – potentially shorter during low season and longer during peak demand periods in Tønder Municipality.
Tønder Municipality Airbnb Cancellation Policy Trends Analysis (2026)
Limited
1 listings
0.5% of total
Flexible
22 listings
10.1% of total
Moderate
23 listings
10.6% of total
Firm
149 listings
68.3% of total
Strict
23 listings
10.6% of total
Cancellation Policy Insights for Tønder Municipality
- The prevailing Airbnb cancellation policy trend in Tønder Municipality is Firm, used by 68.3% of listings.
- A majority (78.9%) of hosts in Tønder Municipality utilize Firm or Strict policies, indicating a market where hosts prioritize booking security.
Recommendations for Hosts
- Consider adopting a Firm policy to align with the 68.3% market standard in Tønder Municipality.
- Using a Strict policy might deter some guests, as only 10.6% of listings use it. Evaluate if potential revenue protection outweighs possible lower booking rates.
- Regularly review your cancellation policy against competitors and market demand shifts in Tønder Municipality.
Tønder Municipality STR Booking Lead Time Analysis (2026)
Average Booking Lead Time by Month
Booking Lead Time Insights for Tønder Municipality
- The overall average booking lead time for vacation rentals in Tønder Municipality is 101 days.
- Guests book furthest in advance for stays during August (average 146 days), likely coinciding with peak travel demand or local events.
- The shortest booking windows occur for stays in February (average 40 days), indicating more last-minute travel plans during this time.
- Seasonally, Summer (123 days avg.) sees the longest lead times, while Spring (78 days avg.) has the shortest, reflecting typical travel planning cycles.
Recommendations for Hosts
- Use the overall average lead time (101 days) as a baseline for your pricing and availability strategy in Tønder Municipality.
- For August stays, consider implementing length-of-stay discounts or slightly higher rates for bookings made less than 146 days out to capitalize on advance planning.
- Target marketing efforts for the Summer season well in advance (at least 123 days) to capture early planners.
- Monitor your own booking lead times against these Tønder Municipality averages to identify opportunities for dynamic pricing adjustments.
Popular & Essential Airbnb Amenities in Tønder Municipality (2026)
Amenity Prevalence
Amenity Insights for Tønder Municipality
- Essential amenities in Tønder Municipality that guests expect include: Kitchen. Lacking these (this) could significantly impact bookings.
- Popular amenities like Heating, Wifi, TV are common but not universal. Offering these can provide a competitive edge.
- Warning: Wifi is not universally provided but is considered essential globally. Ensure reliable Wifi is offered.
Recommendations for Hosts
- Ensure your listing includes all essential amenities for Tønder Municipality: Kitchen.
- Prioritize adding missing essentials: Kitchen.
- Consider adding popular differentiators like Heating or Wifi to increase appeal.
- Highlight unique or less common amenities you offer (e.g., hot tub, dedicated workspace, EV charger) in your listing description and photos.
- Regularly check competitor amenities in Tønder Municipality to stay competitive.
Tønder Municipality Airbnb Guest Demographics & Profile Analysis (2026)
Guest Profile Summary for Tønder Municipality
- The typical guest profile for Airbnb in Tønder Municipality consists of predominantly international visitors (80%), with top international origins including Denmark, typically belonging to the Post-2000s (Gen Z/Alpha) group (50%), primarily speaking English or German.
- Domestic travelers account for 19.7% of guests.
- Key international markets include Germany (56.7%) and Denmark (19.7%).
- Top languages spoken are English (38.2%) followed by German (29.9%).
- A significant demographic segment is the Post-2000s (Gen Z/Alpha) group, representing 50% of guests.
Recommendations for Hosts
- Focus marketing internationally, particularly towards travelers from Denmark.
- Tailor amenities and listing descriptions to appeal to the dominant Post-2000s (Gen Z/Alpha) demographic (e.g., highlight fast WiFi, smart home features, local guides).
- Highlight unique local experiences or amenities relevant to the primary guest profile.
- Consider seasonal promotions aligned with peak travel times for key origin markets.
Nearby Short-Term Rental Market Comparison
How does the Tønder Municipality Airbnb market stack up against its neighbors? Compare key performance metrics like average monthly revenue, ADR, and occupancy rates in surrounding areas to understand the broader regional STR landscape.
| Market | Active Properties | Monthly Revenue | Daily Rate | Avg. Occupancy |
|---|---|---|---|---|
| Husum-Ballum | 13 | $4,837 | $499.93 | 44% |
| Blåvand | 16 | $2,374 | $318.93 | 40% |
| Helgoland | 11 | $2,199 | $167.07 | 58% |
| Billund | 105 | $2,027 | $194.14 | 46% |
| Søndervig | 45 | $2,002 | $328.05 | 31% |
| Tetenbüll | 29 | $1,849 | $238.36 | 34% |
| Sunds | 18 | $1,845 | $229.08 | 43% |
| Fjaltring | 11 | $1,827 | $150.64 | 48% |
| Kampen (Sylt) | 25 | $1,824 | $508.88 | 23% |
| Ringkøbing-Skjern Municipality | 204 | $1,754 | $244.41 | 41% |