Odense Airbnb Market Analysis 2026: Short Term Rental Data & Vacation Rental Statistics in Region of Southern Denmark, Denmark
Is Airbnb profitable in Odense in 2026? Explore comprehensive Airbnb analytics for Odense, Region of Southern Denmark, Denmark to uncover income potential. This 2026 STR market report for Odense, based on AirROI data from February 2025 to January 2026, reveals key trends in the market of 562 active listings.
Whether you're considering an Airbnb investment in Odense, optimizing your existing vacation rental, or exploring rental arbitrage opportunities, understanding the Odense Airbnb data is crucial. Leveraging the low regulation environment is key to maximizing your short term rental income potential. Let's dive into the specifics.
Key Odense Airbnb Performance Metrics Overview
Monthly Airbnb Revenue Variations & Income Potential in Odense (2026)
Understanding the monthly revenue variations for Airbnb listings in Odense is key to maximizing your short term rental income potential. Seasonality significantly impacts earnings. Our analysis, based on data from the past 12 months, shows that the peak revenue month for STRs in Odense is typically August, while January often presents the lowest earnings, highlighting opportunities for strategic pricing adjustments during shoulder and low seasons. Explore the typical Airbnb income in Odense across different performance tiers:
- Best-in-class properties (Top 10%) achieve $3,747+ monthly, often utilizing dynamic pricing and superior guest experiences.
- Strong performing properties (Top 25%) earn $2,429 or more, indicating effective management and desirable locations/amenities.
- Typical properties (Median) generate around $1,387 per month, representing the average market performance.
- Entry-level properties (Bottom 25%) see earnings around $641, often with potential for optimization.
Average Monthly Airbnb Earnings Trend in Odense
Odense Airbnb Occupancy Rate Trends (2026)
Maximize your bookings by understanding the Odense STR occupancy trends. Seasonal demand shifts significantly influence how often properties are booked. Typically, Augustsees the highest demand (peak season occupancy), while January experiences the lowest (low season). Effective strategies, like adjusting minimum stays or offering promotions, can boost occupancy during slower periods. Here's how different property tiers perform in Odense:
- Best-in-class properties (Top 10%) achieve 82%+ occupancy, indicating high desirability and potentially optimized availability.
- Strong performing properties (Top 25%) maintain 66% or higher occupancy, suggesting good market fit and guest satisfaction.
- Typical properties (Median) have an occupancy rate around 40%.
- Entry-level properties (Bottom 25%) average 19% occupancy, potentially facing higher vacancy.
Average Monthly Occupancy Rate Trend in Odense
Average Daily Rate (ADR) Airbnb Trends in Odense (2026)
Effective short term rental pricing strategy in Odense involves understanding monthly ADR fluctuations. The Average Daily Rate (ADR) for Airbnb in Odense typically peaks in December and dips lowest during February. Leveraging Airbnb dynamic pricing tools or strategies based on this seasonality can significantly boost revenue. Here's a look at the typical nightly rates achieved:
- Best-in-class properties (Top 10%) command rates of $233+ per night, often due to premium features or locations.
- Strong performing properties (Top 25%) achieve nightly rates of $166 or more.
- Typical properties (Median) charge around $119 per night.
- Entry-level properties (Bottom 25%) earn around $82 per night.
Average Daily Rate (ADR) Trend by Month in Odense
Get Live Odense Market Intelligence 👇

Explore Real-time Analytics
Airbnb Seasonality Analysis & Trends in Odense (2026)
Peak Season (August, July, June)
- Revenue averages $2,335 per month
- Occupancy rates average 51.9%
- Daily rates average $140
Shoulder Season
- Revenue averages $1,796 per month
- Occupancy maintains around 43.8%
- Daily rates hold near $139
Low Season (January, February, December)
- Revenue drops to average $1,265 per month
- Occupancy decreases to average 33.9%
- Daily rates adjust to average $141
Seasonality Insights for Odense
- The Airbnb seasonality in Odense shows highly seasonal trends requiring careful strategy. While the sections above show seasonal averages, it's also insightful to look at the extremes:
- During the high season, the absolute peak month showcases Odense's highest earning potential, with monthly revenues capable of climbing to $2,615, occupancy reaching a high of 59.3%, and ADRs peaking at $148.
- Conversely, the slowest single month of the year, typically falling within the low season, marks the market's lowest point. In this month, revenue might dip to $965, occupancy could drop to 25.9%, and ADRs may adjust down to $128.
- Understanding both the seasonal averages and these monthly peaks and troughs in revenue, occupancy, and ADR is crucial for maximizing your Airbnb profit potential in Odense.
Seasonal Strategies for Maximizing Profit
- Peak Season: Maximize revenue through premium pricing and potentially longer minimum stays. Ensure high availability.
- Low Season: Offer competitive pricing, special promotions (e.g., extended stay discounts), and flexible cancellation policies. Target off-season travelers like remote workers or budget-conscious guests.
- Shoulder Seasons: Implement dynamic pricing that balances peak and low rates. Target weekend travelers or specific events. Offer slightly more flexible terms than peak season.
- Regularly analyze your own performance against these Odense seasonality benchmarks and adjust your pricing and availability strategy accordingly.
Best Areas for Airbnb Investment in Odense (2026)
Exploring the top neighborhoods for short-term rentals in Odense? This section highlights key areas, outlining why they are attractive for hosts and guests, along with notable local attractions. Consider these locations based on your target guest profile and investment strategy.
| Neighborhood / Area | Why Host Here? (Target Guests & Appeal) | Key Attractions & Landmarks |
|---|---|---|
| City Center | The vibrant heart of Odense filled with shops, cafes, and cultural attractions. It is ideal for tourists seeking easy access to sights and amenities. | Odense Cathedral, Hans Christian Andersen Museum, Brandts, The Funen Village, Café Gammelbro |
| Munkebo | A charming neighborhood with a laid-back atmosphere, close to nature and the coastline. Popular with families and travelers looking for a relaxing stay. | Kerteminde Beach, Munkebo Marina, Munkebo Harbour, Kerteminde Park, Kerteminde Golf Club |
| Parkeringshus | A modern area with convenient access to transport and local amenities. Great for business trips and exploring the city. | Odense Central Station, Shopping Center 'Rosengårdcentret', Odense Concert Hall, Local restaurants, Public parks |
| Nørre Street (Nørregade) | A bustling shopping street with various shops, restaurants, and cafes. Perfect for tourists looking to immerse themselves in local culture. | Street Market, Odense City Library, Shopping boutiques, Local artisans, Street performances |
| H.C. Andersen's Childhood Home | A historic area linked to the famous author Hans Christian Andersen, appealing to literature and history enthusiasts. | Hans Christian Andersen's House, The Old Town, The Andersen Museum, Gråbrødre Church, Odense City Museums |
| Odense Zoo Area | A family-friendly area close to Odense Zoo, attracting families and animal lovers. | Odense Zoo, Munke Mose Park, Nature trails around the zoo, Playgrounds, Cafés |
| Sonderborg | A picturesque area with nearby waterfront views and parks; suited for scenic retreats. | Waterfront promenade, Parks and picnic areas, Bike paths, Nearby beaches, Local eateries |
| The Old City (Den Gamle By) | A unique historical area with preserved buildings, providing a glimpse into Denmark’s past. | Den Gamle By open-air museum, Historic buildings, Cafés, Craft workshops, Guided tours |
Understanding Airbnb License Requirements & STR Laws in Odense (2026)
While Odense, Region of Southern Denmark, Denmark currently shows low STR regulations, specific Airbnb license requirements might still exist or change. Always verify the latest short term rental regulations and Airbnb license requirements directly with local government authorities for Odense to ensure full compliance before hosting.
(Source: AirROI data, 2026, based on 0% licensed listings)
Top Performing Airbnb Properties in Odense (2026)
Benchmark your potential! Explore examples of top-performing Airbnb properties in Odensebased on Trailing Twelve Month (TTM) revenue. Analyze their characteristics, revenue, occupancy rate, and ADR to understand what drives success in this market.

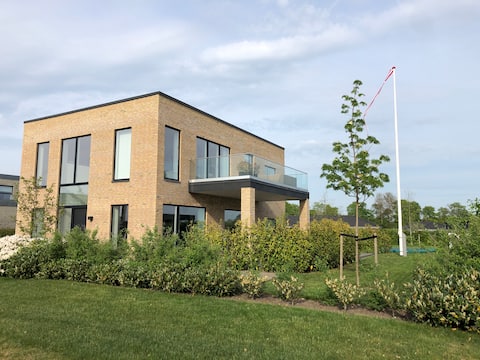
Exceptionally located villa
Entire Place ��• 7 bedrooms

Luksusvilla: exceptionel location i city (free P)
Entire Place • 4 bedrooms

Big house with many rooms in Odense for 11 persons
Entire Place • 5 bedrooms

Stylish country house in beautiful nature
Entire Place • 5 bedrooms
Modern and spacious house for the big family
Entire Place • 6 bedrooms

Beautiful 4 bedroom apartment in the heart of Odense.
Entire Place • 3 bedrooms
Note: Performance varies based on location, size, amenities, seasonality, and management quality. Data reflects the past 12 months.
Top Performing Airbnb Hosts in Odense (2026)
Learn from the best! This table showcases top-performing Airbnb hosts in Odense based on the number of properties managed and estimated total revenue over the past year. Analyze their scale and performance metrics.
| Host Name | Properties | Grossing Revenue | Stay Reviews | Avg Rating |
|---|---|---|---|---|
| Hassan - Wonderstay Housing | 4 | $213,610 | 105 | 4.83/5.0 |
| Frederik | 6 | $186,207 | 106 | 4.82/5.0 |
| Ole | 1 | $145,582 | 3 | 5.00/5.0 |
| Movinn | 15 | $127,506 | 115 | 4.51/5.0 |
| Ane Kirk | 1 | $109,852 | 31 | 5.00/5.0 |
| Trine & Michael | 2 | $74,130 | 470 | 4.93/5.0 |
| Nicolai | 3 | $73,918 | 75 | 4.74/5.0 |
| Mette | 1 | $67,279 | 81 | 4.95/5.0 |
| Karen | 1 | $64,899 | 17 | 5.00/5.0 |
| Christian | 5 | $62,515 | 12 | 4.89/5.0 |
Analyzing the strategies of top hosts, such as their property selection, pricing, and guest communication, can offer valuable lessons for optimizing your own Airbnb operations in Odense.
Dive Deeper: Advanced Odense STR Market Data (2026)
Ready to unlock more insights? AirROI provides access to advanced metrics and comprehensive Airbnb data for Odense. Explore detailed analytics beyond this report to refine your investment strategy, optimize pricing, and maximize your vacation rental profits.
Explore Advanced MetricsOdense Short-Term Rental Market Composition (2026): Property & Room Types
Room Type Distribution
Property Type Distribution
Market Composition Insights for Odense
- The Odense Airbnb market composition is heavily skewed towards Entire Home/Apt listings, which make up 75.4% of the 562 active rentals. This indicates strong guest preference for privacy and space.
- Looking at the property type distribution in Odense, Apartment/Condo properties are the most common (50.4%), reflecting the local real estate landscape.
- Houses represent a significant 43.4% portion, catering likely to families or larger groups.
- Smaller segments like hotel/boutique, others, outdoor/unique (combined 6.3%) offer potential for unique stay experiences.
Odense Airbnb Room Capacity Analysis (2026): Bedroom Distribution
Distribution of Listings by Number of Bedrooms
Room Capacity Insights for Odense
- The dominant room capacity in Odense is 1 bedroom listings, making up 39.1% of the market. This suggests a strong demand for properties suitable for couples or solo travelers.
- Together, 1 bedroom and 2 bedrooms properties represent 58.3% of the active Airbnb listings in Odense, indicating a high concentration in these sizes.
- A significant 21.7% of listings offer 3+ bedrooms, catering to larger groups and families seeking more space in Odense.
Odense Vacation Rental Guest Capacity Trends (2026)
Distribution of Listings by Guest Capacity
Guest Capacity Insights for Odense
- The most common guest capacity trend in Odense vacation rentals is listings accommodating 4 guests (25.3%). This suggests the primary traveler segment is likely small families or groups.
- Properties designed for 4 guests and 2 guests dominate the Odense STR market, accounting for 45.2% of listings.
- 19.8% of properties accommodate 6+ guests, serving the market segment for larger families or group travel in Odense.
- On average, properties in Odense are equipped to host 3.3 guests.
Odense Airbnb Booking Patterns (2026): Available vs. Booked Days
Available Days Distribution
Booked Days Distribution
Booking Pattern Insights for Odense
- The most common availability pattern in Odense falls within the 271-366 days range, representing 53.9% of listings. This suggests many properties have significant open periods on their calendars.
- Approximately 82.2% of listings show high availability (181+ days open annually), indicating potential for increased bookings or specific owner usage patterns.
- For booked days, the 91-180 days range is most frequent in Odense (29.5%), reflecting common guest stay durations or potential owner blocking patterns.
- A notable 18.7% of properties secure long booking periods (181+ days booked per year), highlighting successful long-term rental strategies or significant owner usage.
Odense Airbnb Minimum Stay Requirements Analysis
Distribution of Listings by Minimum Night Requirement
1 Night
190 listings
33.8% of total
2 Nights
132 listings
23.5% of total
3 Nights
37 listings
6.6% of total
4-6 Nights
46 listings
8.2% of total
7-29 Nights
17 listings
3% of total
30+ Nights
140 listings
24.9% of total
Key Insights
- The most prevalent minimum stay requirement in Odense is 1 Night, adopted by 33.8% of listings. This highlights the market's preference for shorter, flexible bookings.
- A significant segment (24.9%) caters to monthly stays (30+ nights) in Odense, pointing to opportunities in the extended-stay market.
Recommendations
- Align with the market by considering a 1 Night minimum stay, as 33.8% of Odense hosts use this setting.
- Explore offering discounts for stays of 30+ nights to attract the 24.9% of the market seeking extended stays.
- Adjust minimum nights based on seasonality – potentially shorter during low season and longer during peak demand periods in Odense.
Odense Airbnb Cancellation Policy Trends Analysis (2026)
Limited
1 listings
0.2% of total
Super Strict 60 Days
6 listings
1.1% of total
Flexible
216 listings
38.6% of total
Moderate
188 listings
33.6% of total
Firm
112 listings
20% of total
Strict
37 listings
6.6% of total
Cancellation Policy Insights for Odense
- The prevailing Airbnb cancellation policy trend in Odense is Flexible, used by 38.6% of listings.
- The market strongly favors guest-friendly terms, with 72.2% of listings offering Flexible or Moderate policies. This suggests guests in Odense may expect booking flexibility.
- Strict cancellation policies are quite rare (6.6%), potentially making listings with this policy less competitive unless justified by high demand or property type.
Recommendations for Hosts
- Consider adopting a Flexible policy to align with the 38.6% market standard in Odense.
- Using a Strict policy might deter some guests, as only 6.6% of listings use it. Evaluate if potential revenue protection outweighs possible lower booking rates.
- Regularly review your cancellation policy against competitors and market demand shifts in Odense.
Odense STR Booking Lead Time Analysis (2026)
Average Booking Lead Time by Month
Booking Lead Time Insights for Odense
- The overall average booking lead time for vacation rentals in Odense is 54 days.
- Guests book furthest in advance for stays during June (average 79 days), likely coinciding with peak travel demand or local events.
- The shortest booking windows occur for stays in February (average 30 days), indicating more last-minute travel plans during this time.
- Seasonally, Summer (67 days avg.) sees the longest lead times, while Winter (36 days avg.) has the shortest, reflecting typical travel planning cycles.
Recommendations for Hosts
- Use the overall average lead time (54 days) as a baseline for your pricing and availability strategy in Odense.
- For June stays, consider implementing length-of-stay discounts or slightly higher rates for bookings made less than 79 days out to capitalize on advance planning.
- Target marketing efforts for the Summer season well in advance (at least 67 days) to capture early planners.
- Monitor your own booking lead times against these Odense averages to identify opportunities for dynamic pricing adjustments.
Popular & Essential Airbnb Amenities in Odense (2026)
Amenity Prevalence
Amenity Insights for Odense
- Popular amenities like Wifi, Kitchen, Heating are common but not universal. Offering these can provide a competitive edge.
- Warning: Wifi is not universally provided but is considered essential globally. Ensure reliable Wifi is offered.
Recommendations for Hosts
- Consider adding popular differentiators like Wifi or Kitchen to increase appeal.
- Highlight unique or less common amenities you offer (e.g., hot tub, dedicated workspace, EV charger) in your listing description and photos.
- Regularly check competitor amenities in Odense to stay competitive.
Odense Airbnb Guest Demographics & Profile Analysis (2026)
Guest Profile Summary for Odense
- The typical guest profile for Airbnb in Odense consists of predominantly international visitors (70%), with top international origins including Germany, typically belonging to the Post-2000s (Gen Z/Alpha) group (50%), primarily speaking English or Danish.
- Domestic travelers account for 30.1% of guests.
- Key international markets include Denmark (30.1%) and Germany (13.6%).
- Top languages spoken are English (37.8%) followed by Danish (12.4%).
- A significant demographic segment is the Post-2000s (Gen Z/Alpha) group, representing 50% of guests.
Recommendations for Hosts
- Focus marketing internationally, particularly towards travelers from Germany.
- Tailor amenities and listing descriptions to appeal to the dominant Post-2000s (Gen Z/Alpha) demographic (e.g., highlight fast WiFi, smart home features, local guides).
- Highlight unique local experiences or amenities relevant to the primary guest profile.
- Consider seasonal promotions aligned with peak travel times for key origin markets.
Nearby Short-Term Rental Market Comparison
How does the Odense Airbnb market stack up against its neighbors? Compare key performance metrics like average monthly revenue, ADR, and occupancy rates in surrounding areas to understand the broader regional STR landscape.
| Market | Active Properties | Monthly Revenue | Daily Rate | Avg. Occupancy |
|---|---|---|---|---|
| Wittenbeck | 14 | $2,937 | $224.34 | 43% |
| Lohals | 20 | $2,866 | $331.99 | 40% |
| Bissee | 13 | $2,338 | $180.13 | 48% |
| Rude Strand | 27 | $2,198 | $254.15 | 41% |
| Korshavn | 14 | $2,192 | $244.24 | 41% |
| Tørresø Strand | 26 | $2,145 | $235.54 | 42% |
| Harmsdorf | 10 | $2,076 | $326.10 | 36% |
| Billund | 105 | $2,027 | $194.14 | 46% |
| Ærøskøbing | 33 | $1,996 | $177.48 | 46% |
| Stillinge Strand | 22 | $1,853 | $228.00 | 36% |