Havneby Airbnb Market Analysis 2026: Short Term Rental Data & Vacation Rental Statistics in Region of Southern Denmark, Denmark
Is Airbnb profitable in Havneby in 2026? Explore comprehensive Airbnb analytics for Havneby, Region of Southern Denmark, Denmark to uncover income potential. This 2026 STR market report for Havneby, based on AirROI data from February 2025 to January 2026, reveals key trends in the niche market of 56 active listings.
Whether you're considering an Airbnb investment in Havneby, optimizing your existing vacation rental, or exploring rental arbitrage opportunities, understanding the Havneby Airbnb data is crucial. Leveraging the low regulation environment is key to maximizing your short term rental income potential. Let's dive into the specifics.
Key Havneby Airbnb Performance Metrics Overview
Monthly Airbnb Revenue Variations & Income Potential in Havneby (2026)
Understanding the monthly revenue variations for Airbnb listings in Havneby is key to maximizing your short term rental income potential. Seasonality significantly impacts earnings. Our analysis, based on data from the past 12 months, shows that the peak revenue month for STRs in Havneby is typically August, while November often presents the lowest earnings, highlighting opportunities for strategic pricing adjustments during shoulder and low seasons. Explore the typical Airbnb income in Havneby across different performance tiers:
- Best-in-class properties (Top 10%) achieve $4,907+ monthly, often utilizing dynamic pricing and superior guest experiences.
- Strong performing properties (Top 25%) earn $2,772 or more, indicating effective management and desirable locations/amenities.
- Typical properties (Median) generate around $1,569 per month, representing the average market performance.
- Entry-level properties (Bottom 25%) see earnings around $792, often with potential for optimization.
Average Monthly Airbnb Earnings Trend in Havneby
Havneby Airbnb Occupancy Rate Trends (2026)
Maximize your bookings by understanding the Havneby STR occupancy trends. Seasonal demand shifts significantly influence how often properties are booked. Typically, Augustsees the highest demand (peak season occupancy), while November experiences the lowest (low season). Effective strategies, like adjusting minimum stays or offering promotions, can boost occupancy during slower periods. Here's how different property tiers perform in Havneby:
- Best-in-class properties (Top 10%) achieve 74%+ occupancy, indicating high desirability and potentially optimized availability.
- Strong performing properties (Top 25%) maintain 53% or higher occupancy, suggesting good market fit and guest satisfaction.
- Typical properties (Median) have an occupancy rate around 29%.
- Entry-level properties (Bottom 25%) average 13% occupancy, potentially facing higher vacancy.
Average Monthly Occupancy Rate Trend in Havneby
Average Daily Rate (ADR) Airbnb Trends in Havneby (2026)
Effective short term rental pricing strategy in Havneby involves understanding monthly ADR fluctuations. The Average Daily Rate (ADR) for Airbnb in Havneby typically peaks in May and dips lowest during November. Leveraging Airbnb dynamic pricing tools or strategies based on this seasonality can significantly boost revenue. Here's a look at the typical nightly rates achieved:
- Best-in-class properties (Top 10%) command rates of $396+ per night, often due to premium features or locations.
- Strong performing properties (Top 25%) achieve nightly rates of $311 or more.
- Typical properties (Median) charge around $184 per night.
- Entry-level properties (Bottom 25%) earn around $128 per night.
Average Daily Rate (ADR) Trend by Month in Havneby
Get Live Havneby Market Intelligence 👇

Explore Real-time Analytics
Airbnb Seasonality Analysis & Trends in Havneby (2026)
Peak Season (August, April, July)
- Revenue averages $3,019 per month
- Occupancy rates average 46.7%
- Daily rates average $240
Shoulder Season
- Revenue averages $2,149 per month
- Occupancy maintains around 34.1%
- Daily rates hold near $233
Low Season (January, November, December)
- Revenue drops to average $1,529 per month
- Occupancy decreases to average 23.8%
- Daily rates adjust to average $225
Seasonality Insights for Havneby
- The Airbnb seasonality in Havneby shows highly seasonal trends requiring careful strategy. While the sections above show seasonal averages, it's also insightful to look at the extremes:
- During the high season, the absolute peak month showcases Havneby's highest earning potential, with monthly revenues capable of climbing to $3,918, occupancy reaching a high of 55.5%, and ADRs peaking at $248.
- Conversely, the slowest single month of the year, typically falling within the low season, marks the market's lowest point. In this month, revenue might dip to $1,300, occupancy could drop to 21.8%, and ADRs may adjust down to $212.
- Understanding both the seasonal averages and these monthly peaks and troughs in revenue, occupancy, and ADR is crucial for maximizing your Airbnb profit potential in Havneby.
Seasonal Strategies for Maximizing Profit
- Peak Season: Maximize revenue through premium pricing and potentially longer minimum stays. Ensure high availability.
- Low Season: Offer competitive pricing, special promotions (e.g., extended stay discounts), and flexible cancellation policies. Target off-season travelers like remote workers or budget-conscious guests.
- Shoulder Seasons: Implement dynamic pricing that balances peak and low rates. Target weekend travelers or specific events. Offer slightly more flexible terms than peak season.
- Regularly analyze your own performance against these Havneby seasonality benchmarks and adjust your pricing and availability strategy accordingly.
Best Areas for Airbnb Investment in Havneby (2026)
Exploring the top neighborhoods for short-term rentals in Havneby? This section highlights key areas, outlining why they are attractive for hosts and guests, along with notable local attractions. Consider these locations based on your target guest profile and investment strategy.
| Neighborhood / Area | Why Host Here? (Target Guests & Appeal) | Key Attractions & Landmarks |
|---|---|---|
| Harbor Area | The beautiful marina and nearby beaches attract tourists looking for a scenic getaway. Ideal for water activities and relaxation by the sea. | Havneby Beach, Rømø Beach, Rømø Seal Safari, Rømø Golf Links, Wadden Sea National Park, Rømø Lege- og Labyrintpark |
| Rømø Island | A tranquil island known for its wide sandy beaches and nature reserves. Great for families and nature lovers seeking outdoor activities and pristine landscapes. | Rømø Windmill, Søndervig Beach, Lakolk Beach, National Park Vadehavet, Myrtles Research Center, Rømø's unique fauna and flora |
| Visitor Center | A hub for tourists needing information about the area. It hosts exhibitions and provides insights into local attractions, enhancing guest experiences. | Rømø Museum, Local art displays, Information about guided tours, Souvenir shops, Café serving local delicacies, Visitor talks and events |
| Nationalpark Vadehavet | A UNESCO World Heritage site known for its unique tidal flat ecosystem. Perfect for eco-tourists and nature enthusiasts. | Birdwatching opportunities, Tide walking tours, Stargazing in unpolluted skies, Environmental education programs, Flora and fauna exploration, Sunset views over the North Sea |
| Local Cuisine Spots | Areas renowned for traditional Danish cuisine. Attracts foodies looking to experience local flavors and culinary traditions. | Røkt Lam, Local seafood restaurants, Farmers' market, Cooking workshops, Food tours, Tasting menus |
| Cycling Trails | With numerous cycling routes around the island, it's a favorite for adventure seekers and families looking to explore the area on bikes. | Rømø cycling paths, Scenic routes, Bike rental shops, Stopping points with views, Guided cycling tours, Mapping local flora |
| Cultural Festivals Location | Centers or spaces where local cultural festivals take place, attracting tourists interested in local customs and traditions. | Annual summer festival, Music events, Arts and crafts fairs, Culinary experience festivals, Historical reenactments, Workshops for locals |
| Beachfront Properties | Properties directly facing the water offer breathtaking views and easy access to the sandy beach. High demand for summer rentals and family vacations. | Beach access, Sunset views, Engaging water sports, Beachfront cafes, Relaxation spots, Family-friendly fun areas |
Understanding Airbnb License Requirements & STR Laws in Havneby (2026)
While Havneby, Region of Southern Denmark, Denmark currently shows low STR regulations, specific Airbnb license requirements might still exist or change. Always verify the latest short term rental regulations and Airbnb license requirements directly with local government authorities for Havneby to ensure full compliance before hosting.
(Source: AirROI data, 2026, finding no licensed listings among those analyzed)
Top Performing Airbnb Properties in Havneby (2026)
Benchmark your potential! Explore examples of top-performing Airbnb properties in Havnebybased on Trailing Twelve Month (TTM) revenue. Analyze their characteristics, revenue, occupancy rate, and ADR to understand what drives success in this market.
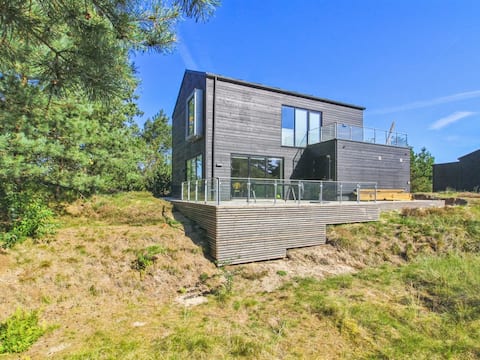
"Razmo" - 2.5km from the sea by Interhome
Entire Place • 3 bedrooms
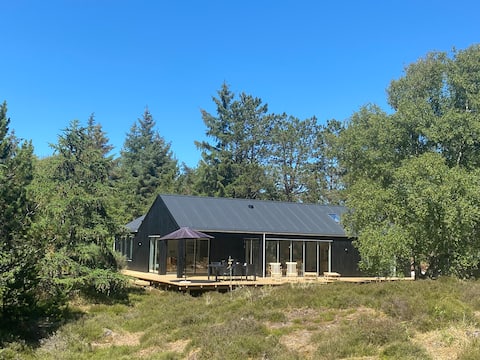
RÖMÖ DREAM HOUSE, 133 sqm, 5000 sqm private property
Entire Place • 3 bedrooms
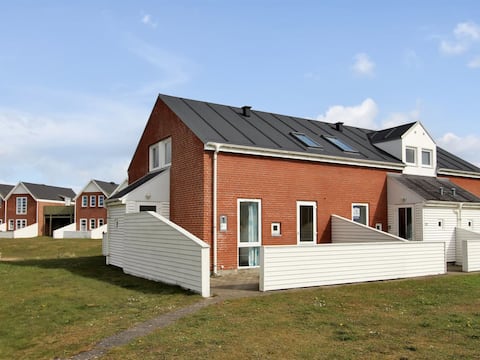
"Mildred" - 2.3km from the sea by Interhome
Entire Place • 3 bedrooms
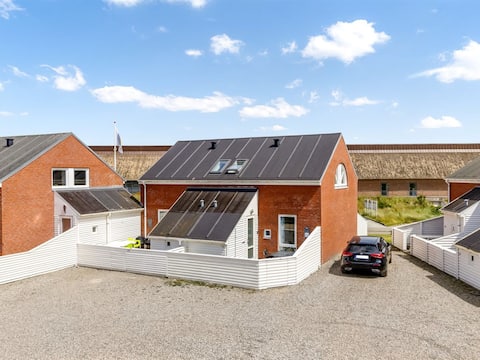
"Nils" - 2.3km from the sea by Interhome
Entire Place • 3 bedrooms

Lovely holiday home in Rømø with access to pool
Entire Place • 3 bedrooms
Unique cottage, surrounded by nature
Entire Place • 3 bedrooms
Note: Performance varies based on location, size, amenities, seasonality, and management quality. Data reflects the past 12 months.
Top Performing Airbnb Hosts in Havneby (2026)
Learn from the best! This table showcases top-performing Airbnb hosts in Havneby based on the number of properties managed and estimated total revenue over the past year. Analyze their scale and performance metrics.
| Host Name | Properties | Grossing Revenue | Stay Reviews | Avg Rating |
|---|---|---|---|---|
| Martina - Interhome | 11 | $206,933 | 11 | Not Rated |
| Martina - Interhome | 3 | $130,437 | 5 | 4.67/5.0 |
| Johanne - DANCENTER | 22 | $86,306 | 244 | 4.15/5.0 |
| Mikkel Windfeld | 2 | $48,732 | 137 | 4.89/5.0 |
| Investering Og Feriebolig | 2 | $47,322 | 58 | 4.42/5.0 |
| Margit | 1 | $44,197 | 94 | 4.89/5.0 |
| Steffi - Interhome | 2 | $38,395 | 2 | Not Rated |
| Bodil | 2 | $29,688 | 52 | 4.49/5.0 |
| Michael | 1 | $28,054 | 8 | 5.00/5.0 |
| Campaya | 1 | $28,044 | 3 | 3.67/5.0 |
Analyzing the strategies of top hosts, such as their property selection, pricing, and guest communication, can offer valuable lessons for optimizing your own Airbnb operations in Havneby.
Dive Deeper: Advanced Havneby STR Market Data (2026)
Ready to unlock more insights? AirROI provides access to advanced metrics and comprehensive Airbnb data for Havneby. Explore detailed analytics beyond this report to refine your investment strategy, optimize pricing, and maximize your vacation rental profits.
Explore Advanced MetricsHavneby Short-Term Rental Market Composition (2026): Property & Room Types
Room Type Distribution
Property Type Distribution
Market Composition Insights for Havneby
- The Havneby Airbnb market composition is heavily skewed towards Entire Home/Apt listings, which make up 96.4% of the 56 active rentals. This indicates strong guest preference for privacy and space.
- Looking at the property type distribution in Havneby, House properties are the most common (62.5%), reflecting the local real estate landscape.
- Houses represent a significant 62.5% portion, catering likely to families or larger groups.
- Smaller segments like outdoor/unique (combined 3.6%) offer potential for unique stay experiences.
Havneby Airbnb Room Capacity Analysis (2026): Bedroom Distribution
Distribution of Listings by Number of Bedrooms
Room Capacity Insights for Havneby
- The dominant room capacity in Havneby is 3 bedrooms listings, making up 44.6% of the market. This suggests a strong demand for properties suitable for families or small groups.
- Together, 3 bedrooms and 2 bedrooms properties represent 67.8% of the active Airbnb listings in Havneby, indicating a high concentration in these sizes.
- A significant 58.9% of listings offer 3+ bedrooms, catering to larger groups and families seeking more space in Havneby.
Havneby Vacation Rental Guest Capacity Trends (2026)
Distribution of Listings by Guest Capacity
Guest Capacity Insights for Havneby
- The most common guest capacity trend in Havneby vacation rentals is listings accommodating 6 guests (33.9%). This suggests the primary traveler segment is likely larger groups.
- Properties designed for 6 guests and 4 guests dominate the Havneby STR market, accounting for 66.0% of listings.
- 55.3% of properties accommodate 6+ guests, serving the market segment for larger families or group travel in Havneby.
- On average, properties in Havneby are equipped to host 5.5 guests.
Havneby Airbnb Booking Patterns (2026): Available vs. Booked Days
Available Days Distribution
Booked Days Distribution
Booking Pattern Insights for Havneby
- The most common availability pattern in Havneby falls within the 271-366 days range, representing 75% of listings. This suggests many properties have significant open periods on their calendars.
- Approximately 89.3% of listings show high availability (181+ days open annually), indicating potential for increased bookings or specific owner usage patterns.
- For booked days, the 1-30 days range is most frequent in Havneby (41.1%), reflecting common guest stay durations or potential owner blocking patterns.
- A notable 10.7% of properties secure long booking periods (181+ days booked per year), highlighting successful long-term rental strategies or significant owner usage.
Havneby Airbnb Minimum Stay Requirements Analysis
Distribution of Listings by Minimum Night Requirement
1 Night
19 listings
34.5% of total
4-6 Nights
5 listings
9.1% of total
7-29 Nights
1 listings
1.8% of total
30+ Nights
30 listings
54.5% of total
Key Insights
- The most prevalent minimum stay requirement in Havneby is 30+ Nights, adopted by 54.5% of listings. This highlights the market's preference for longer commitments.
- A significant segment (54.5%) caters to monthly stays (30+ nights) in Havneby, pointing to opportunities in the extended-stay market.
Recommendations
- Align with the market by considering a 30+ Nights minimum stay, as 54.5% of Havneby hosts use this setting.
- Explore offering discounts for stays of 30+ nights to attract the 54.5% of the market seeking extended stays.
- Adjust minimum nights based on seasonality – potentially shorter during low season and longer during peak demand periods in Havneby.
Havneby Airbnb Cancellation Policy Trends Analysis (2026)
Super Strict 30 Days
2 listings
3.6% of total
Flexible
3 listings
5.5% of total
Moderate
2 listings
3.6% of total
Firm
43 listings
78.2% of total
Strict
5 listings
9.1% of total
Cancellation Policy Insights for Havneby
- The prevailing Airbnb cancellation policy trend in Havneby is Firm, used by 78.2% of listings.
- A majority (87.3%) of hosts in Havneby utilize Firm or Strict policies, indicating a market where hosts prioritize booking security.
- Strict cancellation policies are quite rare (9.1%), potentially making listings with this policy less competitive unless justified by high demand or property type.
Recommendations for Hosts
- Consider adopting a Firm policy to align with the 78.2% market standard in Havneby.
- Using a Strict policy might deter some guests, as only 9.1% of listings use it. Evaluate if potential revenue protection outweighs possible lower booking rates.
- Regularly review your cancellation policy against competitors and market demand shifts in Havneby.
Havneby STR Booking Lead Time Analysis (2026)
Average Booking Lead Time by Month
Booking Lead Time Insights for Havneby
- The overall average booking lead time for vacation rentals in Havneby is 91 days.
- Guests book furthest in advance for stays during August (average 113 days), likely coinciding with peak travel demand or local events.
- The shortest booking windows occur for stays in November (average 25 days), indicating more last-minute travel plans during this time.
- Seasonally, Summer (100 days avg.) sees the longest lead times, while Fall (57 days avg.) has the shortest, reflecting typical travel planning cycles.
Recommendations for Hosts
- Use the overall average lead time (91 days) as a baseline for your pricing and availability strategy in Havneby.
- For August stays, consider implementing length-of-stay discounts or slightly higher rates for bookings made less than 113 days out to capitalize on advance planning.
- Target marketing efforts for the Summer season well in advance (at least 100 days) to capture early planners.
- Monitor your own booking lead times against these Havneby averages to identify opportunities for dynamic pricing adjustments.
Popular & Essential Airbnb Amenities in Havneby (2026)
Amenity Prevalence
Amenity Insights for Havneby
- Essential amenities in Havneby that guests expect include: Kitchen, Heating. Lacking these (any) could significantly impact bookings.
- Popular amenities like Wifi, TV, Hangers are common but not universal. Offering these can provide a competitive edge.
- Warning: Wifi is not universally provided but is considered essential globally. Ensure reliable Wifi is offered.
Recommendations for Hosts
- Ensure your listing includes all essential amenities for Havneby: Kitchen, Heating.
- Prioritize adding missing essentials: Heating.
- Consider adding popular differentiators like Wifi or TV to increase appeal.
- Highlight unique or less common amenities you offer (e.g., hot tub, dedicated workspace, EV charger) in your listing description and photos.
- Regularly check competitor amenities in Havneby to stay competitive.
Havneby Airbnb Guest Demographics & Profile Analysis (2026)
Guest Profile Summary for Havneby
- The typical guest profile for Airbnb in Havneby consists of predominantly international visitors (87%), with top international origins including Denmark, typically belonging to the Post-2000s (Gen Z/Alpha) group (50%), primarily speaking English or German.
- Domestic travelers account for 13.0% of guests.
- Key international markets include Germany (71%) and Denmark (13%).
- Top languages spoken are English (38.3%) followed by German (36.6%).
- A significant demographic segment is the Post-2000s (Gen Z/Alpha) group, representing 50% of guests.
Recommendations for Hosts
- Focus marketing internationally, particularly towards travelers from Denmark.
- Tailor amenities and listing descriptions to appeal to the dominant Post-2000s (Gen Z/Alpha) demographic (e.g., highlight fast WiFi, smart home features, local guides).
- Highlight unique local experiences or amenities relevant to the primary guest profile.
- Consider seasonal promotions aligned with peak travel times for key origin markets.
Nearby Short-Term Rental Market Comparison
How does the Havneby Airbnb market stack up against its neighbors? Compare key performance metrics like average monthly revenue, ADR, and occupancy rates in surrounding areas to understand the broader regional STR landscape.
| Market | Active Properties | Monthly Revenue | Daily Rate | Avg. Occupancy |
|---|---|---|---|---|
| Husum-Ballum | 13 | $4,837 | $499.93 | 44% |
| Blåvand | 16 | $2,374 | $318.93 | 40% |
| Helgoland | 11 | $2,199 | $167.07 | 58% |
| Billund | 105 | $2,027 | $194.14 | 46% |
| Søndervig | 45 | $2,002 | $328.05 | 31% |
| Tetenbüll | 29 | $1,849 | $238.36 | 34% |
| Sunds | 18 | $1,845 | $229.08 | 43% |
| Fjaltring | 11 | $1,827 | $150.64 | 48% |
| Kampen (Sylt) | 25 | $1,824 | $508.88 | 23% |
| Ringkøbing-Skjern Municipality | 204 | $1,754 | $244.41 | 41% |