Skagen Airbnb Market Analysis 2026: Short Term Rental Data & Vacation Rental Statistics in North Denmark Region, Denmark
Is Airbnb profitable in Skagen in 2026? Explore comprehensive Airbnb analytics for Skagen, North Denmark Region, Denmark to uncover income potential. This 2026 STR market report for Skagen, based on AirROI data from February 2025 to January 2026, reveals key trends in the market of 343 active listings.
Whether you're considering an Airbnb investment in Skagen, optimizing your existing vacation rental, or exploring rental arbitrage opportunities, understanding the Skagen Airbnb data is crucial. Leveraging the low regulation environment is key to maximizing your short term rental income potential. Let's dive into the specifics.
Key Skagen Airbnb Performance Metrics Overview
Monthly Airbnb Revenue Variations & Income Potential in Skagen (2026)
Understanding the monthly revenue variations for Airbnb listings in Skagen is key to maximizing your short term rental income potential. Seasonality significantly impacts earnings. Our analysis, based on data from the past 12 months, shows that the peak revenue month for STRs in Skagen is typically July, while January often presents the lowest earnings, highlighting opportunities for strategic pricing adjustments during shoulder and low seasons. Explore the typical Airbnb income in Skagen across different performance tiers:
- Best-in-class properties (Top 10%) achieve $4,657+ monthly, often utilizing dynamic pricing and superior guest experiences.
- Strong performing properties (Top 25%) earn $2,946 or more, indicating effective management and desirable locations/amenities.
- Typical properties (Median) generate around $1,671 per month, representing the average market performance.
- Entry-level properties (Bottom 25%) see earnings around $921, often with potential for optimization.
Average Monthly Airbnb Earnings Trend in Skagen
Skagen Airbnb Occupancy Rate Trends (2026)
Maximize your bookings by understanding the Skagen STR occupancy trends. Seasonal demand shifts significantly influence how often properties are booked. Typically, Julysees the highest demand (peak season occupancy), while January experiences the lowest (low season). Effective strategies, like adjusting minimum stays or offering promotions, can boost occupancy during slower periods. Here's how different property tiers perform in Skagen:
- Best-in-class properties (Top 10%) achieve 64%+ occupancy, indicating high desirability and potentially optimized availability.
- Strong performing properties (Top 25%) maintain 46% or higher occupancy, suggesting good market fit and guest satisfaction.
- Typical properties (Median) have an occupancy rate around 28%.
- Entry-level properties (Bottom 25%) average 15% occupancy, potentially facing higher vacancy.
Average Monthly Occupancy Rate Trend in Skagen
Average Daily Rate (ADR) Airbnb Trends in Skagen (2026)
Effective short term rental pricing strategy in Skagen involves understanding monthly ADR fluctuations. The Average Daily Rate (ADR) for Airbnb in Skagen typically peaks in June and dips lowest during March. Leveraging Airbnb dynamic pricing tools or strategies based on this seasonality can significantly boost revenue. Here's a look at the typical nightly rates achieved:
- Best-in-class properties (Top 10%) command rates of $467+ per night, often due to premium features or locations.
- Strong performing properties (Top 25%) achieve nightly rates of $324 or more.
- Typical properties (Median) charge around $194 per night.
- Entry-level properties (Bottom 25%) earn around $119 per night.
Average Daily Rate (ADR) Trend by Month in Skagen
Get Live Skagen Market Intelligence 👇

Explore Real-time Analytics
Airbnb Seasonality Analysis & Trends in Skagen (2026)
Peak Season (July, August, June)
- Revenue averages $3,703 per month
- Occupancy rates average 51.4%
- Daily rates average $280
Shoulder Season
- Revenue averages $2,089 per month
- Occupancy maintains around 29.6%
- Daily rates hold near $243
Low Season (January, February, November)
- Revenue drops to average $1,147 per month
- Occupancy decreases to average 18.7%
- Daily rates adjust to average $235
Seasonality Insights for Skagen
- The Airbnb seasonality in Skagen shows highly seasonal trends requiring careful strategy. While the sections above show seasonal averages, it's also insightful to look at the extremes:
- During the high season, the absolute peak month showcases Skagen's highest earning potential, with monthly revenues capable of climbing to $4,823, occupancy reaching a high of 65.8%, and ADRs peaking at $283.
- Conversely, the slowest single month of the year, typically falling within the low season, marks the market's lowest point. In this month, revenue might dip to $964, occupancy could drop to 12.5%, and ADRs may adjust down to $222.
- Understanding both the seasonal averages and these monthly peaks and troughs in revenue, occupancy, and ADR is crucial for maximizing your Airbnb profit potential in Skagen.
Seasonal Strategies for Maximizing Profit
- Peak Season: Maximize revenue through premium pricing and potentially longer minimum stays. Ensure high availability.
- Low Season: Offer competitive pricing, special promotions (e.g., extended stay discounts), and flexible cancellation policies. Target off-season travelers like remote workers or budget-conscious guests.
- Shoulder Seasons: Implement dynamic pricing that balances peak and low rates. Target weekend travelers or specific events. Offer slightly more flexible terms than peak season.
- Regularly analyze your own performance against these Skagen seasonality benchmarks and adjust your pricing and availability strategy accordingly.
Best Areas for Airbnb Investment in Skagen (2026)
Exploring the top neighborhoods for short-term rentals in Skagen? This section highlights key areas, outlining why they are attractive for hosts and guests, along with notable local attractions. Consider these locations based on your target guest profile and investment strategy.
| Neighborhood / Area | Why Host Here? (Target Guests & Appeal) | Key Attractions & Landmarks |
|---|---|---|
| The Old Town | Charming and historic area featuring beautiful old buildings and a relaxed atmosphere. It's popular among tourists seeking to experience traditional Danish culture and architecture. | Skagen Museum, Anchers Hus, Peter Carl Fabergé Museum, Skagen Odde Nature Centre, Skagen's picturesque harbor |
| Grenen | The northernmost point of Denmark where the North Sea and the Baltic Sea meet. It's a natural wonder and a popular destination for tourists who love nature and photography. | Grenen Beach, Sandormen (the Sand Worm), Skagen's unique landscapes, The Lighthouse (Skagen Fyr) |
| Skagen Harbor | A vibrant harbor area with restaurants, shops, and access to boat tours. It's a great spot for enjoying seafood and the maritime atmosphere. | Local fish restaurants, Boat tours to nearby islands, Skagen's maritime history, Art galleries along the harbor |
| Ruths Hotel | A historic hotel area known for its luxurious accommodations and beautiful surroundings. It attracts visitors looking for upscale stays and fine dining. | Ruths Hotel Restaurant, Natural beauty of the area, Luxury spa services |
| Skagen Festival Grounds | A lively area where the annual Skagen Festival takes place, attracting culture lovers and music enthusiasts. | Live music events, Local food stalls, Art installations |
| North Beach | A beautiful stretch of sandy beach known for its scenic views and calm waters. It's perfect for families and beachgoers. | Beach activities, Walking trails, Local beach bars |
| The Sand Dunes | A unique natural area with vast moving sand dunes, perfect for adventurous tourists and nature lovers. | Dune hiking, Bird watching, Photography opportunities |
| Kysten Restaurant Area | Known for its seafood and coastal cuisine, this area attracts foodies and visitors looking to enjoy local culinary specialties. | Fresh seafood restaurants, Famous local dishes, Sea views dining experiences |
Understanding Airbnb License Requirements & STR Laws in Skagen (2026)
While Skagen, North Denmark Region, Denmark currently shows low STR regulations, specific Airbnb license requirements might still exist or change. Always verify the latest short term rental regulations and Airbnb license requirements directly with local government authorities for Skagen to ensure full compliance before hosting.
(Source: AirROI data, 2026, finding no licensed listings among those analyzed)
Top Performing Airbnb Properties in Skagen (2026)
Benchmark your potential! Explore examples of top-performing Airbnb properties in Skagenbased on Trailing Twelve Month (TTM) revenue. Analyze their characteristics, revenue, occupancy rate, and ADR to understand what drives success in this market.
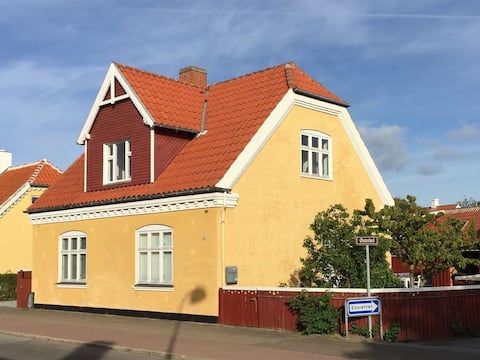
"Reko" - 500m from the sea by Interhome
Entire Place • 4 bedrooms
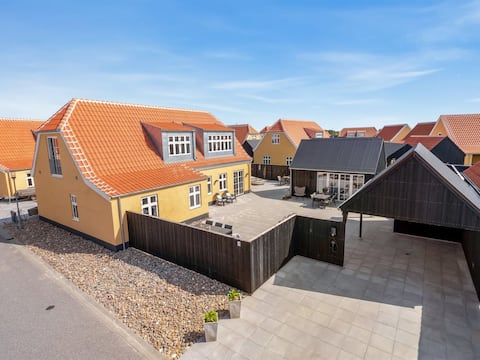
"Josina" - 1.8km from the sea by Interhome
Entire Place • 4 bedrooms
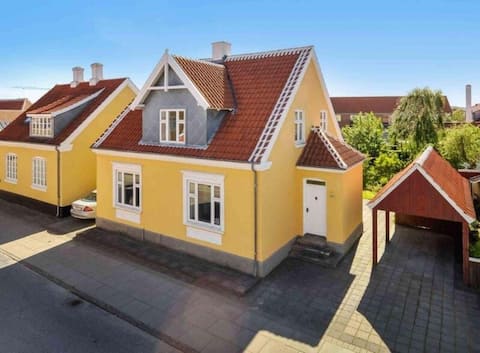
Nice large Skagen house with central location
Entire Place • 6 bedrooms
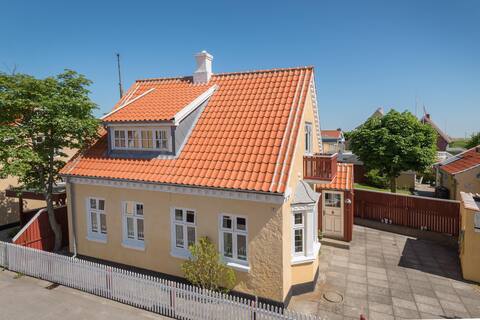
Very well maintained older Skagen home 020152
Entire Place • 3 bedrooms

Lovely holiday home in central Skagen
Entire Place • 3 bedrooms
"Elisebeth" - 500m from the sea by Interhome
Entire Place • 4 bedrooms
Note: Performance varies based on location, size, amenities, seasonality, and management quality. Data reflects the past 12 months.
Top Performing Airbnb Hosts in Skagen (2026)
Learn from the best! This table showcases top-performing Airbnb hosts in Skagen based on the number of properties managed and estimated total revenue over the past year. Analyze their scale and performance metrics.
| Host Name | Properties | Grossing Revenue | Stay Reviews | Avg Rating |
|---|---|---|---|---|
| Toppen Af Danmark | 111 | $2,440,141 | 322 | 4.56/5.0 |
| Maike - Interhome | 5 | $237,285 | 6 | Not Rated |
| Maike - Interhome | 1 | $110,113 | 1 | Not Rated |
| Campaya | 2 | $108,570 | 12 | 4.60/5.0 |
| Kenneth | 5 | $93,811 | 109 | 4.69/5.0 |
| Ajs | 8 | $90,920 | 742 | 4.65/5.0 |
| Nana Starbæk | 5 | $82,142 | 160 | 4.78/5.0 |
| Christine | 3 | $80,350 | 509 | 4.83/5.0 |
| Eric Døssing | 1 | $71,768 | 17 | 4.82/5.0 |
| Babak | 3 | $69,931 | 51 | 4.77/5.0 |
Analyzing the strategies of top hosts, such as their property selection, pricing, and guest communication, can offer valuable lessons for optimizing your own Airbnb operations in Skagen.
Dive Deeper: Advanced Skagen STR Market Data (2026)
Ready to unlock more insights? AirROI provides access to advanced metrics and comprehensive Airbnb data for Skagen. Explore detailed analytics beyond this report to refine your investment strategy, optimize pricing, and maximize your vacation rental profits.
Explore Advanced MetricsSkagen Short-Term Rental Market Composition (2026): Property & Room Types
Room Type Distribution
Property Type Distribution
Market Composition Insights for Skagen
- The Skagen Airbnb market composition is heavily skewed towards Entire Home/Apt listings, which make up 87.5% of the 343 active rentals. This indicates strong guest preference for privacy and space.
- Looking at the property type distribution in Skagen, House properties are the most common (70%), reflecting the local real estate landscape.
- Houses represent a significant 70% portion, catering likely to families or larger groups.
- The presence of 8.5% Hotel/Boutique listings indicates integration with traditional hospitality.
- Smaller segments like others, outdoor/unique (combined 2.7%) offer potential for unique stay experiences.
Skagen Airbnb Room Capacity Analysis (2026): Bedroom Distribution
Distribution of Listings by Number of Bedrooms
Room Capacity Insights for Skagen
- The dominant room capacity in Skagen is 3 bedrooms listings, making up 25.1% of the market. This suggests a strong demand for properties suitable for families or small groups.
- Together, 3 bedrooms and 1 bedroom properties represent 47.5% of the active Airbnb listings in Skagen, indicating a high concentration in these sizes.
- A significant 48.7% of listings offer 3+ bedrooms, catering to larger groups and families seeking more space in Skagen.
Skagen Vacation Rental Guest Capacity Trends (2026)
Distribution of Listings by Guest Capacity
Guest Capacity Insights for Skagen
- The most common guest capacity trend in Skagen vacation rentals is listings accommodating 8+ guests (27.7%). This suggests the primary traveler segment is likely larger groups.
- Properties designed for 8+ guests and 6 guests dominate the Skagen STR market, accounting for 49.9% of listings.
- 51.9% of properties accommodate 6+ guests, serving the market segment for larger families or group travel in Skagen.
- On average, properties in Skagen are equipped to host 5.1 guests.
Skagen Airbnb Booking Patterns (2026): Available vs. Booked Days
Available Days Distribution
Booked Days Distribution
Booking Pattern Insights for Skagen
- The most common availability pattern in Skagen falls within the 271-366 days range, representing 67.1% of listings. This suggests many properties have significant open periods on their calendars.
- Approximately 93.0% of listings show high availability (181+ days open annually), indicating potential for increased bookings or specific owner usage patterns.
- For booked days, the 31-90 days range is most frequent in Skagen (49.6%), reflecting common guest stay durations or potential owner blocking patterns.
- A notable 7.9% of properties secure long booking periods (181+ days booked per year), highlighting successful long-term rental strategies or significant owner usage.
Skagen Airbnb Minimum Stay Requirements Analysis
Distribution of Listings by Minimum Night Requirement
1 Night
47 listings
13.7% of total
2 Nights
164 listings
47.8% of total
3 Nights
19 listings
5.5% of total
4-6 Nights
13 listings
3.8% of total
7-29 Nights
2 listings
0.6% of total
30+ Nights
98 listings
28.6% of total
Key Insights
- The most prevalent minimum stay requirement in Skagen is 2 Nights, adopted by 47.8% of listings. This highlights the market's preference for shorter, flexible bookings.
- A strong majority (61.5%) of the Skagen Airbnb data shows acceptance of very short stays (1-2 nights), indicating a dynamic, high-turnover market.
- A significant segment (28.6%) caters to monthly stays (30+ nights) in Skagen, pointing to opportunities in the extended-stay market.
Recommendations
- Align with the market by considering a 2 Nights minimum stay, as 47.8% of Skagen hosts use this setting.
- If feasible, allowing 1-night stays, especially midweek or during low season, could capture last-minute bookings, as only 13.7% currently do.
- A 2-night minimum appears standard (47.8%). Consider this for weekends or peak periods.
- Explore offering discounts for stays of 30+ nights to attract the 28.6% of the market seeking extended stays.
- Adjust minimum nights based on seasonality – potentially shorter during low season and longer during peak demand periods in Skagen.
Skagen Airbnb Cancellation Policy Trends Analysis (2026)
Super Strict 60 Days
1 listings
0.3% of total
Flexible
41 listings
12% of total
Moderate
45 listings
13.1% of total
Firm
216 listings
63% of total
Strict
40 listings
11.7% of total
Cancellation Policy Insights for Skagen
- The prevailing Airbnb cancellation policy trend in Skagen is Firm, used by 63% of listings.
- A majority (74.7%) of hosts in Skagen utilize Firm or Strict policies, indicating a market where hosts prioritize booking security.
Recommendations for Hosts
- Consider adopting a Firm policy to align with the 63% market standard in Skagen.
- Using a Strict policy might deter some guests, as only 11.7% of listings use it. Evaluate if potential revenue protection outweighs possible lower booking rates.
- Regularly review your cancellation policy against competitors and market demand shifts in Skagen.
Skagen STR Booking Lead Time Analysis (2026)
Average Booking Lead Time by Month
Booking Lead Time Insights for Skagen
- The overall average booking lead time for vacation rentals in Skagen is 77 days.
- Guests book furthest in advance for stays during July (average 116 days), likely coinciding with peak travel demand or local events.
- The shortest booking windows occur for stays in February (average 31 days), indicating more last-minute travel plans during this time.
- Seasonally, Summer (97 days avg.) sees the longest lead times, while Winter (52 days avg.) has the shortest, reflecting typical travel planning cycles.
Recommendations for Hosts
- Use the overall average lead time (77 days) as a baseline for your pricing and availability strategy in Skagen.
- For July stays, consider implementing length-of-stay discounts or slightly higher rates for bookings made less than 116 days out to capitalize on advance planning.
- Target marketing efforts for the Summer season well in advance (at least 97 days) to capture early planners.
- Monitor your own booking lead times against these Skagen averages to identify opportunities for dynamic pricing adjustments.
Popular & Essential Airbnb Amenities in Skagen (2026)
Amenity Prevalence
Amenity Insights for Skagen
- Essential amenities in Skagen that guests expect include: Wifi. Lacking these (this) could significantly impact bookings.
- Popular amenities like Kitchen, Heating, TV are common but not universal. Offering these can provide a competitive edge.
Recommendations for Hosts
- Ensure your listing includes all essential amenities for Skagen: Wifi.
- Prioritize adding missing essentials: Wifi.
- Consider adding popular differentiators like Kitchen or Heating to increase appeal.
- Highlight unique or less common amenities you offer (e.g., hot tub, dedicated workspace, EV charger) in your listing description and photos.
- Regularly check competitor amenities in Skagen to stay competitive.
Skagen Airbnb Guest Demographics & Profile Analysis (2026)
Guest Profile Summary for Skagen
- The typical guest profile for Airbnb in Skagen consists of a mix of domestic (45%) and international guests, with top international origins including Norway, typically belonging to the Post-2000s (Gen Z/Alpha) group (50%), primarily speaking English or Danish.
- Domestic travelers account for 45.1% of guests.
- Key international markets include Denmark (45.1%) and Norway (12.6%).
- Top languages spoken are English (37.4%) followed by Danish (18.2%).
- A significant demographic segment is the Post-2000s (Gen Z/Alpha) group, representing 50% of guests.
Recommendations for Hosts
- Balance marketing efforts between domestic and international channels based on the guest mix.
- Tailor amenities and listing descriptions to appeal to the dominant Post-2000s (Gen Z/Alpha) demographic (e.g., highlight fast WiFi, smart home features, local guides).
- Highlight unique local experiences or amenities relevant to the primary guest profile.
- Consider seasonal promotions aligned with peak travel times for key origin markets.
Nearby Short-Term Rental Market Comparison
How does the Skagen Airbnb market stack up against its neighbors? Compare key performance metrics like average monthly revenue, ADR, and occupancy rates in surrounding areas to understand the broader regional STR landscape.
| Market | Active Properties | Monthly Revenue | Daily Rate | Avg. Occupancy |
|---|---|---|---|---|
| Øster Knasborg | 17 | $2,243 | $385.06 | 39% |
| Starrkärr och Näs | 13 | $2,078 | $248.34 | 22% |
| Sunds | 18 | $1,845 | $229.08 | 43% |
| Kandestederne | 21 | $1,811 | $219.39 | 42% |
| Blokhus | 50 | $1,688 | $235.35 | 35% |
| Stenungsunds kommun | 29 | $1,665 | $188.52 | 40% |
| Särö | 15 | $1,631 | $301.89 | 36% |
| Løkken | 132 | $1,589 | $236.52 | 37% |
| Myggenäs | 13 | $1,557 | $197.12 | 48% |
| Syddjurs Municipality | 412 | $1,555 | $249.33 | 36% |