Nørre Vorupør Airbnb Market Analysis 2026: Short Term Rental Data & Vacation Rental Statistics in North Denmark Region, Denmark
Is Airbnb profitable in Nørre Vorupør in 2026? Explore comprehensive Airbnb analytics for Nørre Vorupør, North Denmark Region, Denmark to uncover income potential. This 2026 STR market report for Nørre Vorupør, based on AirROI data from February 2025 to January 2026, reveals key trends in the niche market of 55 active listings.
Whether you're considering an Airbnb investment in Nørre Vorupør, optimizing your existing vacation rental, or exploring rental arbitrage opportunities, understanding the Nørre Vorupør Airbnb data is crucial. Leveraging the low regulation environment is key to maximizing your short term rental income potential. Let's dive into the specifics.
Key Nørre Vorupør Airbnb Performance Metrics Overview
Monthly Airbnb Revenue Variations & Income Potential in Nørre Vorupør (2026)
Understanding the monthly revenue variations for Airbnb listings in Nørre Vorupør is key to maximizing your short term rental income potential. Seasonality significantly impacts earnings. Our analysis, based on data from the past 12 months, shows that the peak revenue month for STRs in Nørre Vorupør is typically July, while January often presents the lowest earnings, highlighting opportunities for strategic pricing adjustments during shoulder and low seasons. Explore the typical Airbnb income in Nørre Vorupør across different performance tiers:
- Best-in-class properties (Top 10%) achieve $3,365+ monthly, often utilizing dynamic pricing and superior guest experiences.
- Strong performing properties (Top 25%) earn $2,303 or more, indicating effective management and desirable locations/amenities.
- Typical properties (Median) generate around $1,322 per month, representing the average market performance.
- Entry-level properties (Bottom 25%) see earnings around $559, often with potential for optimization.
Average Monthly Airbnb Earnings Trend in Nørre Vorupør
Nørre Vorupør Airbnb Occupancy Rate Trends (2026)
Maximize your bookings by understanding the Nørre Vorupør STR occupancy trends. Seasonal demand shifts significantly influence how often properties are booked. Typically, Julysees the highest demand (peak season occupancy), while January experiences the lowest (low season). Effective strategies, like adjusting minimum stays or offering promotions, can boost occupancy during slower periods. Here's how different property tiers perform in Nørre Vorupør:
- Best-in-class properties (Top 10%) achieve 75%+ occupancy, indicating high desirability and potentially optimized availability.
- Strong performing properties (Top 25%) maintain 58% or higher occupancy, suggesting good market fit and guest satisfaction.
- Typical properties (Median) have an occupancy rate around 35%.
- Entry-level properties (Bottom 25%) average 16% occupancy, potentially facing higher vacancy.
Average Monthly Occupancy Rate Trend in Nørre Vorupør
Average Daily Rate (ADR) Airbnb Trends in Nørre Vorupør (2026)
Effective short term rental pricing strategy in Nørre Vorupør involves understanding monthly ADR fluctuations. The Average Daily Rate (ADR) for Airbnb in Nørre Vorupør typically peaks in June and dips lowest during November. Leveraging Airbnb dynamic pricing tools or strategies based on this seasonality can significantly boost revenue. Here's a look at the typical nightly rates achieved:
- Best-in-class properties (Top 10%) command rates of $288+ per night, often due to premium features or locations.
- Strong performing properties (Top 25%) achieve nightly rates of $182 or more.
- Typical properties (Median) charge around $128 per night.
- Entry-level properties (Bottom 25%) earn around $101 per night.
Average Daily Rate (ADR) Trend by Month in Nørre Vorupør
Get Live Nørre Vorupør Market Intelligence 👇

Explore Real-time Analytics
Airbnb Seasonality Analysis & Trends in Nørre Vorupør (2026)
Peak Season (July, August, October)
- Revenue averages $2,346 per month
- Occupancy rates average 53.7%
- Daily rates average $161
Shoulder Season
- Revenue averages $1,483 per month
- Occupancy maintains around 37.0%
- Daily rates hold near $161
Low Season (January, February, November)
- Revenue drops to average $1,094 per month
- Occupancy decreases to average 27.4%
- Daily rates adjust to average $152
Seasonality Insights for Nørre Vorupør
- The Airbnb seasonality in Nørre Vorupør shows highly seasonal trends requiring careful strategy. While the sections above show seasonal averages, it's also insightful to look at the extremes:
- During the high season, the absolute peak month showcases Nørre Vorupør's highest earning potential, with monthly revenues capable of climbing to $2,680, occupancy reaching a high of 59.5%, and ADRs peaking at $167.
- Conversely, the slowest single month of the year, typically falling within the low season, marks the market's lowest point. In this month, revenue might dip to $1,055, occupancy could drop to 22.2%, and ADRs may adjust down to $150.
- Understanding both the seasonal averages and these monthly peaks and troughs in revenue, occupancy, and ADR is crucial for maximizing your Airbnb profit potential in Nørre Vorupør.
Seasonal Strategies for Maximizing Profit
- Peak Season: Maximize revenue through premium pricing and potentially longer minimum stays. Ensure high availability.
- Low Season: Offer competitive pricing, special promotions (e.g., extended stay discounts), and flexible cancellation policies. Target off-season travelers like remote workers or budget-conscious guests.
- Shoulder Seasons: Implement dynamic pricing that balances peak and low rates. Target weekend travelers or specific events. Offer slightly more flexible terms than peak season.
- Regularly analyze your own performance against these Nørre Vorupør seasonality benchmarks and adjust your pricing and availability strategy accordingly.
Best Areas for Airbnb Investment in Nørre Vorupør (2026)
Exploring the top neighborhoods for short-term rentals in Nørre Vorupør? This section highlights key areas, outlining why they are attractive for hosts and guests, along with notable local attractions. Consider these locations based on your target guest profile and investment strategy.
| Neighborhood / Area | Why Host Here? (Target Guests & Appeal) | Key Attractions & Landmarks |
|---|---|---|
| Nørre Vorupør Beach | A beautiful coastal area known for its stunning sandy beaches and natural beauty. Ideal for families and nature lovers seeking a relaxing holiday by the sea. | Nørre Vorupør Lighthouse, Thy National Park, Local seafood restaurants, Sundowner Beach Bar, Surfing and water sports |
| Local Village Center | The heart of Nørre Vorupør, providing access to charming shops and eateries. A great location for guests wanting to experience local culture and community. | Local boutiques, Thy Art Gallery, Fjord & Beach Café, Nørre Vorupør Museum, Village festivals |
| Thy National Park | A large national park close to Nørre Vorupør, offering diverse landscapes and wildlife. Perfect for outdoor enthusiasts and nature explorers. | Hiking trails, Birdwatching spots, Danish heathland, Dunes and forests, Rare plant species |
| Surfing Area | A popular spot for surfers due to its excellent waves and surf culture. Attracts sports enthusiasts and tourists wanting to learn to surf. | Surf schools, Rental shops, Surf competitions, Beach parties |
| Nature Reserves | Surrounding Nørre Vorupør are natural reserves that offer tranquility and scenic views, suitable for those seeking relaxation and nature walks. | Mols Bjerge, Bird observatories, Walking paths, Photography spots |
| Fishing Ports | Known for its rich fishing heritage, the ports in Nørre Vorupør are engaging for visitors interested in local history and seafood tasting. | Fishing tours, Local fish markets, Boat rentals, Historical fishing exhibits |
| Cultural Events | Nørre Vorupør hosts various festivals and events throughout the year, making it a great cultural hub for visitors. | Annual beach festival, Local art exhibitions, Concerts in the park, Culinary events |
| Wellness Retreats | Several wellness centers offer relaxation and spa services, attracting visitors looking for a rejuvenating getaway. | Spa facilities, Yoga classes, Massage therapy, Healthy cafes |
Understanding Airbnb License Requirements & STR Laws in Nørre Vorupør (2026)
While Nørre Vorupør, North Denmark Region, Denmark currently shows low STR regulations, specific Airbnb license requirements might still exist or change. Always verify the latest short term rental regulations and Airbnb license requirements directly with local government authorities for Nørre Vorupør to ensure full compliance before hosting.
(Source: AirROI data, 2026, finding no licensed listings among those analyzed)
Top Performing Airbnb Properties in Nørre Vorupør (2026)
Benchmark your potential! Explore examples of top-performing Airbnb properties in Nørre Vorupørbased on Trailing Twelve Month (TTM) revenue. Analyze their characteristics, revenue, occupancy rate, and ADR to understand what drives success in this market.
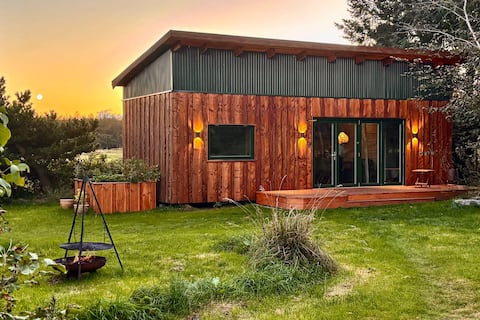
Tiny Oak House | Hygligt Getaway | 5 km til havet
Entire Place • 1 bedroom
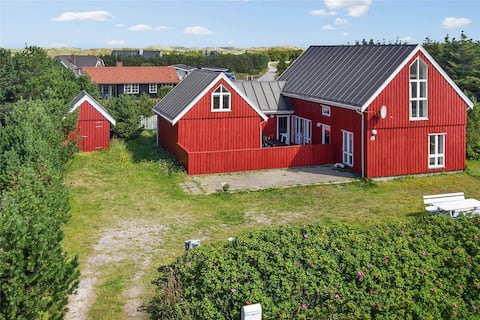
Large holiday cottage on 185m2
Entire Place • 4 bedrooms

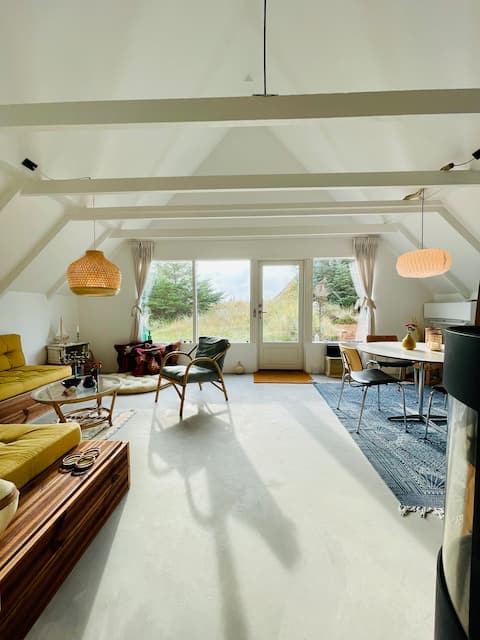
renovated retreat with pool -by traum
Entire Place • 4 bedrooms

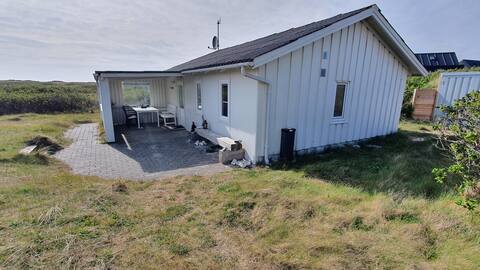
Townhouse in Vorupør, close to the beach
Entire Place • 3 bedrooms
Cozy winter with sauna, wood stove & heat pump
Entire Place • 2 bedrooms
Beautiful authentic little cottage, top location.
Entire Place • 2 bedrooms
Note: Performance varies based on location, size, amenities, seasonality, and management quality. Data reflects the past 12 months.
Top Performing Airbnb Hosts in Nørre Vorupør (2026)
Learn from the best! This table showcases top-performing Airbnb hosts in Nørre Vorupør based on the number of properties managed and estimated total revenue over the past year. Analyze their scale and performance metrics.
| Host Name | Properties | Grossing Revenue | Stay Reviews | Avg Rating |
|---|---|---|---|---|
| Ida - DANCENTER | 9 | $46,826 | 83 | 4.43/5.0 |
| Brian | 1 | $40,650 | 79 | 4.95/5.0 |
| Karen | 1 | $37,778 | 97 | 4.88/5.0 |
| Dorthe Skaarup | 2 | $33,114 | 64 | 4.99/5.0 |
| Jonas | 2 | $29,818 | 97 | 4.90/5.0 |
| Metta | 1 | $28,011 | 10 | 4.90/5.0 |
| Annie | 1 | $25,348 | 36 | 4.97/5.0 |
| Mads Fuglsang | 1 | $25,329 | 106 | 4.70/5.0 |
| Olof Maximilian | 1 | $24,505 | 32 | 5.00/5.0 |
| Henrik | 1 | $23,858 | 86 | 4.74/5.0 |
Analyzing the strategies of top hosts, such as their property selection, pricing, and guest communication, can offer valuable lessons for optimizing your own Airbnb operations in Nørre Vorupør.
Dive Deeper: Advanced Nørre Vorupør STR Market Data (2026)
Ready to unlock more insights? AirROI provides access to advanced metrics and comprehensive Airbnb data for Nørre Vorupør. Explore detailed analytics beyond this report to refine your investment strategy, optimize pricing, and maximize your vacation rental profits.
Explore Advanced MetricsNørre Vorupør Short-Term Rental Market Composition (2026): Property & Room Types
Room Type Distribution
Property Type Distribution
Market Composition Insights for Nørre Vorupør
- The Nørre Vorupør Airbnb market composition is heavily skewed towards Entire Home/Apt listings, which make up 90.9% of the 55 active rentals. This indicates strong guest preference for privacy and space.
- Looking at the property type distribution in Nørre Vorupør, House properties are the most common (72.7%), reflecting the local real estate landscape.
- Houses represent a significant 72.7% portion, catering likely to families or larger groups.
- Smaller segments like others (combined 1.8%) offer potential for unique stay experiences.
Nørre Vorupør Airbnb Room Capacity Analysis (2026): Bedroom Distribution
Distribution of Listings by Number of Bedrooms
Room Capacity Insights for Nørre Vorupør
- The dominant room capacity in Nørre Vorupør is 3 bedrooms listings, making up 29.1% of the market. This suggests a strong demand for properties suitable for families or small groups.
- Together, 3 bedrooms and 2 bedrooms properties represent 58.2% of the active Airbnb listings in Nørre Vorupør, indicating a high concentration in these sizes.
- A significant 45.5% of listings offer 3+ bedrooms, catering to larger groups and families seeking more space in Nørre Vorupør.
Nørre Vorupør Vacation Rental Guest Capacity Trends (2026)
Distribution of Listings by Guest Capacity
Guest Capacity Insights for Nørre Vorupør
- The most common guest capacity trend in Nørre Vorupør vacation rentals is listings accommodating 6 guests (38.2%). This suggests the primary traveler segment is likely larger groups.
- Properties designed for 6 guests and 4 guests dominate the Nørre Vorupør STR market, accounting for 65.5% of listings.
- 50.9% of properties accommodate 6+ guests, serving the market segment for larger families or group travel in Nørre Vorupør.
- On average, properties in Nørre Vorupør are equipped to host 4.9 guests.
Nørre Vorupør Airbnb Booking Patterns (2026): Available vs. Booked Days
Available Days Distribution
Booked Days Distribution
Booking Pattern Insights for Nørre Vorupør
- The most common availability pattern in Nørre Vorupør falls within the 271-366 days range, representing 60% of listings. This suggests many properties have significant open periods on their calendars.
- Approximately 87.3% of listings show high availability (181+ days open annually), indicating potential for increased bookings or specific owner usage patterns.
- For booked days, the 31-90 days range is most frequent in Nørre Vorupør (29.1%), reflecting common guest stay durations or potential owner blocking patterns.
- A notable 16.3% of properties secure long booking periods (181+ days booked per year), highlighting successful long-term rental strategies or significant owner usage.
Nørre Vorupør Airbnb Minimum Stay Requirements Analysis
Distribution of Listings by Minimum Night Requirement
1 Night
8 listings
14.5% of total
2 Nights
12 listings
21.8% of total
3 Nights
8 listings
14.5% of total
4-6 Nights
4 listings
7.3% of total
7-29 Nights
2 listings
3.6% of total
30+ Nights
21 listings
38.2% of total
Key Insights
- The most prevalent minimum stay requirement in Nørre Vorupør is 30+ Nights, adopted by 38.2% of listings. This highlights the market's preference for longer commitments.
- A significant segment (38.2%) caters to monthly stays (30+ nights) in Nørre Vorupør, pointing to opportunities in the extended-stay market.
Recommendations
- Align with the market by considering a 30+ Nights minimum stay, as 38.2% of Nørre Vorupør hosts use this setting.
- If feasible, allowing 1-night stays, especially midweek or during low season, could capture last-minute bookings, as only 14.5% currently do.
- Explore offering discounts for stays of 30+ nights to attract the 38.2% of the market seeking extended stays.
- Adjust minimum nights based on seasonality – potentially shorter during low season and longer during peak demand periods in Nørre Vorupør.
Nørre Vorupør Airbnb Cancellation Policy Trends Analysis (2026)
Flexible
11 listings
20% of total
Moderate
7 listings
12.7% of total
Firm
32 listings
58.2% of total
Strict
5 listings
9.1% of total
Cancellation Policy Insights for Nørre Vorupør
- The prevailing Airbnb cancellation policy trend in Nørre Vorupør is Firm, used by 58.2% of listings.
- A majority (67.3%) of hosts in Nørre Vorupør utilize Firm or Strict policies, indicating a market where hosts prioritize booking security.
- Strict cancellation policies are quite rare (9.1%), potentially making listings with this policy less competitive unless justified by high demand or property type.
Recommendations for Hosts
- Consider adopting a Firm policy to align with the 58.2% market standard in Nørre Vorupør.
- Using a Strict policy might deter some guests, as only 9.1% of listings use it. Evaluate if potential revenue protection outweighs possible lower booking rates.
- Regularly review your cancellation policy against competitors and market demand shifts in Nørre Vorupør.
Nørre Vorupør STR Booking Lead Time Analysis (2026)
Average Booking Lead Time by Month
Booking Lead Time Insights for Nørre Vorupør
- The overall average booking lead time for vacation rentals in Nørre Vorupør is 67 days.
- Guests book furthest in advance for stays during July (average 99 days), likely coinciding with peak travel demand or local events.
- The shortest booking windows occur for stays in February (average 31 days), indicating more last-minute travel plans during this time.
- Seasonally, Summer (83 days avg.) sees the longest lead times, while Fall (51 days avg.) has the shortest, reflecting typical travel planning cycles.
Recommendations for Hosts
- Use the overall average lead time (67 days) as a baseline for your pricing and availability strategy in Nørre Vorupør.
- For July stays, consider implementing length-of-stay discounts or slightly higher rates for bookings made less than 99 days out to capitalize on advance planning.
- Target marketing efforts for the Summer season well in advance (at least 83 days) to capture early planners.
- Monitor your own booking lead times against these Nørre Vorupør averages to identify opportunities for dynamic pricing adjustments.
Popular & Essential Airbnb Amenities in Nørre Vorupør (2026)
Amenity Prevalence
Amenity Insights for Nørre Vorupør
- Essential amenities in Nørre Vorupør that guests expect include: Kitchen, Heating. Lacking these (any) could significantly impact bookings.
- Popular amenities like TV, Wifi, Refrigerator are common but not universal. Offering these can provide a competitive edge.
- Warning: Wifi is not universally provided but is considered essential globally. Ensure reliable Wifi is offered.
Recommendations for Hosts
- Ensure your listing includes all essential amenities for Nørre Vorupør: Kitchen, Heating.
- Prioritize adding missing essentials: Kitchen, Heating.
- Consider adding popular differentiators like TV or Wifi to increase appeal.
- Highlight unique or less common amenities you offer (e.g., hot tub, dedicated workspace, EV charger) in your listing description and photos.
- Regularly check competitor amenities in Nørre Vorupør to stay competitive.
Nørre Vorupør Airbnb Guest Demographics & Profile Analysis (2026)
Guest Profile Summary for Nørre Vorupør
- The typical guest profile for Airbnb in Nørre Vorupør consists of a mix of domestic (35%) and international guests, with top international origins including Denmark, typically belonging to the Post-2000s (Gen Z/Alpha) group (50%), primarily speaking English or German.
- Domestic travelers account for 35.3% of guests.
- Key international markets include Germany (39.4%) and Denmark (35.3%).
- Top languages spoken are English (39.1%) followed by German (23.4%).
- A significant demographic segment is the Post-2000s (Gen Z/Alpha) group, representing 50% of guests.
Recommendations for Hosts
- Focus marketing internationally, particularly towards travelers from Denmark.
- Tailor amenities and listing descriptions to appeal to the dominant Post-2000s (Gen Z/Alpha) demographic (e.g., highlight fast WiFi, smart home features, local guides).
- Highlight unique local experiences or amenities relevant to the primary guest profile.
- Consider seasonal promotions aligned with peak travel times for key origin markets.
Nearby Short-Term Rental Market Comparison
How does the Nørre Vorupør Airbnb market stack up against its neighbors? Compare key performance metrics like average monthly revenue, ADR, and occupancy rates in surrounding areas to understand the broader regional STR landscape.
| Market | Active Properties | Monthly Revenue | Daily Rate | Avg. Occupancy |
|---|---|---|---|---|
| Husum-Ballum | 13 | $4,837 | $499.93 | 44% |
| Blåvand | 16 | $2,374 | $318.93 | 40% |
| Billund | 105 | $2,027 | $194.14 | 46% |
| Søndervig | 45 | $2,002 | $328.05 | 31% |
| Sunds | 18 | $1,845 | $229.08 | 43% |
| Fjaltring | 11 | $1,827 | $150.64 | 48% |
| Ringkøbing-Skjern Municipality | 204 | $1,754 | $244.41 | 41% |
| Tønder Municipality | 218 | $1,711 | $252.10 | 37% |
| Blokhus | 50 | $1,688 | $235.35 | 35% |
| Vejle Municipality | 43 | $1,677 | $227.97 | 37% |