Blokhus Airbnb Market Analysis 2026: Short Term Rental Data & Vacation Rental Statistics in North Denmark Region, Denmark
Is Airbnb profitable in Blokhus in 2026? Explore comprehensive Airbnb analytics for Blokhus, North Denmark Region, Denmark to uncover income potential. This 2026 STR market report for Blokhus, based on AirROI data from February 2025 to January 2026, reveals key trends in the niche market of 50 active listings.
Whether you're considering an Airbnb investment in Blokhus, optimizing your existing vacation rental, or exploring rental arbitrage opportunities, understanding the Blokhus Airbnb data is crucial. Leveraging the low regulation environment is key to maximizing your short term rental income potential. Let's dive into the specifics.
Key Blokhus Airbnb Performance Metrics Overview
Monthly Airbnb Revenue Variations & Income Potential in Blokhus (2026)
Understanding the monthly revenue variations for Airbnb listings in Blokhus is key to maximizing your short term rental income potential. Seasonality significantly impacts earnings. Our analysis, based on data from the past 12 months, shows that the peak revenue month for STRs in Blokhus is typically October, while January often presents the lowest earnings, highlighting opportunities for strategic pricing adjustments during shoulder and low seasons. Explore the typical Airbnb income in Blokhus across different performance tiers:
- Best-in-class properties (Top 10%) achieve $6,552+ monthly, often utilizing dynamic pricing and superior guest experiences.
- Strong performing properties (Top 25%) earn $3,209 or more, indicating effective management and desirable locations/amenities.
- Typical properties (Median) generate around $1,920 per month, representing the average market performance.
- Entry-level properties (Bottom 25%) see earnings around $993, often with potential for optimization.
Average Monthly Airbnb Earnings Trend in Blokhus
Blokhus Airbnb Occupancy Rate Trends (2026)
Maximize your bookings by understanding the Blokhus STR occupancy trends. Seasonal demand shifts significantly influence how often properties are booked. Typically, Julysees the highest demand (peak season occupancy), while January experiences the lowest (low season). Effective strategies, like adjusting minimum stays or offering promotions, can boost occupancy during slower periods. Here's how different property tiers perform in Blokhus:
- Best-in-class properties (Top 10%) achieve 71%+ occupancy, indicating high desirability and potentially optimized availability.
- Strong performing properties (Top 25%) maintain 51% or higher occupancy, suggesting good market fit and guest satisfaction.
- Typical properties (Median) have an occupancy rate around 30%.
- Entry-level properties (Bottom 25%) average 16% occupancy, potentially facing higher vacancy.
Average Monthly Occupancy Rate Trend in Blokhus
Average Daily Rate (ADR) Airbnb Trends in Blokhus (2026)
Effective short term rental pricing strategy in Blokhus involves understanding monthly ADR fluctuations. The Average Daily Rate (ADR) for Airbnb in Blokhus typically peaks in July and dips lowest during March. Leveraging Airbnb dynamic pricing tools or strategies based on this seasonality can significantly boost revenue. Here's a look at the typical nightly rates achieved:
- Best-in-class properties (Top 10%) command rates of $457+ per night, often due to premium features or locations.
- Strong performing properties (Top 25%) achieve nightly rates of $250 or more.
- Typical properties (Median) charge around $178 per night.
- Entry-level properties (Bottom 25%) earn around $128 per night.
Average Daily Rate (ADR) Trend by Month in Blokhus
Get Live Blokhus Market Intelligence 👇

Explore Real-time Analytics
Airbnb Seasonality Analysis & Trends in Blokhus (2026)
Peak Season (October, July, August)
- Revenue averages $4,707 per month
- Occupancy rates average 53.6%
- Daily rates average $235
Shoulder Season
- Revenue averages $2,759 per month
- Occupancy maintains around 33.9%
- Daily rates hold near $230
Low Season (January, February, May)
- Revenue drops to average $1,860 per month
- Occupancy decreases to average 21.9%
- Daily rates adjust to average $228
Seasonality Insights for Blokhus
- The Airbnb seasonality in Blokhus shows highly seasonal trends requiring careful strategy. While the sections above show seasonal averages, it's also insightful to look at the extremes:
- During the high season, the absolute peak month showcases Blokhus's highest earning potential, with monthly revenues capable of climbing to $5,249, occupancy reaching a high of 60.7%, and ADRs peaking at $239.
- Conversely, the slowest single month of the year, typically falling within the low season, marks the market's lowest point. In this month, revenue might dip to $1,755, occupancy could drop to 18.1%, and ADRs may adjust down to $220.
- Understanding both the seasonal averages and these monthly peaks and troughs in revenue, occupancy, and ADR is crucial for maximizing your Airbnb profit potential in Blokhus.
Seasonal Strategies for Maximizing Profit
- Peak Season: Maximize revenue through premium pricing and potentially longer minimum stays. Ensure high availability.
- Low Season: Offer competitive pricing, special promotions (e.g., extended stay discounts), and flexible cancellation policies. Target off-season travelers like remote workers or budget-conscious guests.
- Shoulder Seasons: Implement dynamic pricing that balances peak and low rates. Target weekend travelers or specific events. Offer slightly more flexible terms than peak season.
- Regularly analyze your own performance against these Blokhus seasonality benchmarks and adjust your pricing and availability strategy accordingly.
Best Areas for Airbnb Investment in Blokhus (2026)
Exploring the top neighborhoods for short-term rentals in Blokhus? This section highlights key areas, outlining why they are attractive for hosts and guests, along with notable local attractions. Consider these locations based on your target guest profile and investment strategy.
| Neighborhood / Area | Why Host Here? (Target Guests & Appeal) | Key Attractions & Landmarks |
|---|---|---|
| Blokhus Beach | Popular coastal destination known for its long sandy beaches, family-friendly atmosphere, and vibrant summer events. Ideal for travelers seeking relaxation and outdoor activities near the sea. | Blokhus Beach, Blokhus Aquapark, Skulpturparken Blokhus, Faarup Sommerland, Løkken Beach, Hune Kirke |
| Skagen | Famous for its unique light and beautiful landscapes, Skagen attracts artists and nature lovers. A perfect destination for guests interested in art, culture, and the beautiful coastline. | Grenen, Skagen Museum, Danish Rådhus, Skagen's sandy beaches, Anchers Hus, The Buried Church |
| Løkken | Charming seaside town known for its picturesque beach and family-friendly atmosphere. Great choice for families and beachgoers looking for a relaxed vacation spot. | Løkken Beach, Rubjerg Knude Lighthouse, Fårup Sommerland, Løkken Museum, North Sea Oceanarium, Løkken Strand |
| Hirtshals | Known for its ferry connections and the beautiful northern coastline, Hirtshals is a strategic location for travelers exploring Northern Jutland. Attractions include beaches and wildlife experiences. | Hirtshals Lighthouse, Sea War Museum, Hirtshals Beach, Nordsømuseet, Bunkermuseum, Skagen Odde Nature Center |
| Jammerbugt | A beautiful coastal district known for its stunning nature and rich cultural history, making it attractive for tourists who love nature and local culture. | Jammerbugt Beach, Vestkystens Golf Club, Fjerritslev Museum, Klim Strand, Slettestrand, Cafes and local eateries |
| Aalborg | A vibrant city with a rich history, exciting nightlife, and cultural attractions. Perfect for urban explorers and those looking for city amenities during their stay. | Aalborg Zoo, Aalborg Tower, The Utzon Center, Jomfru Ane Gade, Karolinelund, Aalborg Historical Museum |
| Mariager Fjord | Scenic area known for its beautiful fjord and charming towns. Ideal for nature lovers and those seeking tranquility. | Mariager Fjord, Hadsund, Gatten Town, Sparresholm, Mariager Saltcenter, Nature trails |
| Nibe | A charming village that attracts visitors with its cozy atmosphere and cultural events. A great spot for those looking for a peaceful getaway near the water. | Nibe Marina, Nibe Festival, Helleristninger ved Lund, Café Mollehuset, Nibe Church, Local art galleries |
Understanding Airbnb License Requirements & STR Laws in Blokhus (2026)
While Blokhus, North Denmark Region, Denmark currently shows low STR regulations, specific Airbnb license requirements might still exist or change. Always verify the latest short term rental regulations and Airbnb license requirements directly with local government authorities for Blokhus to ensure full compliance before hosting.
(Source: AirROI data, 2026, finding no licensed listings among those analyzed)
Top Performing Airbnb Properties in Blokhus (2026)
Benchmark your potential! Explore examples of top-performing Airbnb properties in Blokhusbased on Trailing Twelve Month (TTM) revenue. Analyze their characteristics, revenue, occupancy rate, and ADR to understand what drives success in this market.
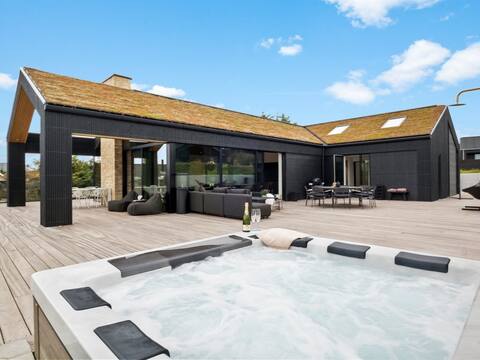
"Ilja" - 800m from the sea by Interhome
Entire Place • 3 bedrooms
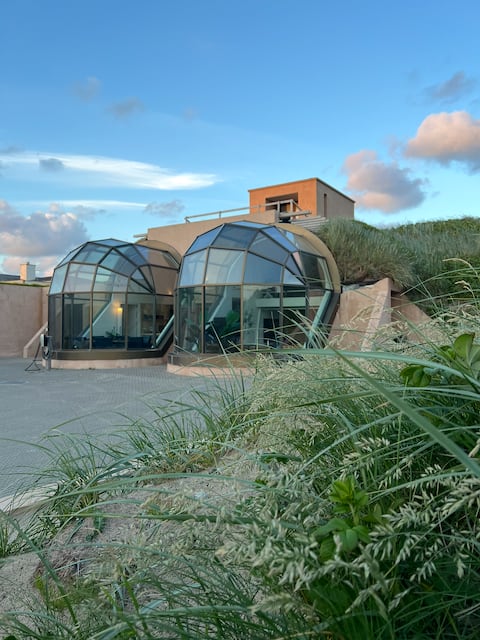
Unique famous architectural seaside villa
Entire Place • 4 bedrooms
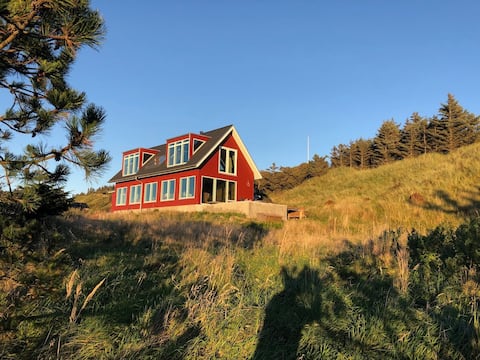
The Red House with ocean views, vinyls & surf
Entire Place • 5 bedrooms

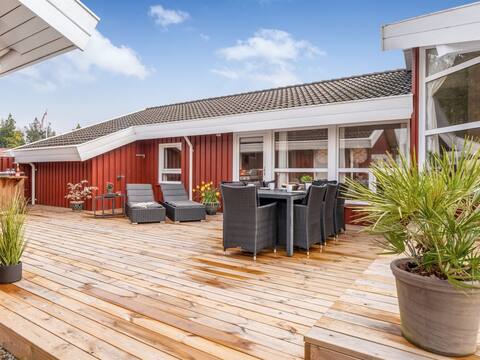
"Myrte" - 300m from the sea by Interhome
Entire Place • 3 bedrooms
"Gunborg" - 2.5km from the sea by Interhome
Entire Place • 4 bedrooms

Dreamhouse_blokhus Luksus i Blokhus
Entire Place • 4 bedrooms
Note: Performance varies based on location, size, amenities, seasonality, and management quality. Data reflects the past 12 months.
Top Performing Airbnb Hosts in Blokhus (2026)
Learn from the best! This table showcases top-performing Airbnb hosts in Blokhus based on the number of properties managed and estimated total revenue over the past year. Analyze their scale and performance metrics.
| Host Name | Properties | Grossing Revenue | Stay Reviews | Avg Rating |
|---|---|---|---|---|
| Daniela - Interhome | 1 | $185,603 | 2 | Not Rated |
| Morten | 1 | $61,476 | 35 | 4.71/5.0 |
| Majken | 1 | $55,285 | 2 | Not Rated |
| Maike - Interhome | 1 | $49,645 | 1 | Not Rated |
| Mikaella Helle | 2 | $45,319 | 31 | 4.97/5.0 |
| Annika - Interhome | 3 | $44,725 | 4 | Not Rated |
| Alice - Interhome | 1 | $39,565 | 1 | Not Rated |
| Janne | 1 | $39,550 | 10 | 4.90/5.0 |
| Anders | 1 | $34,051 | 118 | 4.97/5.0 |
| Rikke | 1 | $33,788 | 19 | 4.89/5.0 |
Analyzing the strategies of top hosts, such as their property selection, pricing, and guest communication, can offer valuable lessons for optimizing your own Airbnb operations in Blokhus.
Dive Deeper: Advanced Blokhus STR Market Data (2026)
Ready to unlock more insights? AirROI provides access to advanced metrics and comprehensive Airbnb data for Blokhus. Explore detailed analytics beyond this report to refine your investment strategy, optimize pricing, and maximize your vacation rental profits.
Explore Advanced MetricsBlokhus Short-Term Rental Market Composition (2026): Property & Room Types
Room Type Distribution
Property Type Distribution
Market Composition Insights for Blokhus
- The Blokhus Airbnb market composition is heavily skewed towards Entire Home/Apt listings, which make up 96% of the 50 active rentals. This indicates strong guest preference for privacy and space.
- Looking at the property type distribution in Blokhus, House properties are the most common (60%), reflecting the local real estate landscape.
- Houses represent a significant 60% portion, catering likely to families or larger groups.
- Smaller segments like unique stays, hotel/boutique (combined 4.0%) offer potential for unique stay experiences.
Blokhus Airbnb Room Capacity Analysis (2026): Bedroom Distribution
Distribution of Listings by Number of Bedrooms
Room Capacity Insights for Blokhus
- The dominant room capacity in Blokhus is 3 bedrooms listings, making up 42% of the market. This suggests a strong demand for properties suitable for families or small groups.
- Together, 3 bedrooms and 2 bedrooms properties represent 64.0% of the active Airbnb listings in Blokhus, indicating a high concentration in these sizes.
- A significant 60.0% of listings offer 3+ bedrooms, catering to larger groups and families seeking more space in Blokhus.
Blokhus Vacation Rental Guest Capacity Trends (2026)
Distribution of Listings by Guest Capacity
Guest Capacity Insights for Blokhus
- The most common guest capacity trend in Blokhus vacation rentals is listings accommodating 6 guests (26%). This suggests the primary traveler segment is likely larger groups.
- Properties designed for 6 guests and 4 guests dominate the Blokhus STR market, accounting for 52.0% of listings.
- 50.0% of properties accommodate 6+ guests, serving the market segment for larger families or group travel in Blokhus.
- On average, properties in Blokhus are equipped to host 5.4 guests.
Blokhus Airbnb Booking Patterns (2026): Available vs. Booked Days
Available Days Distribution
Booked Days Distribution
Booking Pattern Insights for Blokhus
- The most common availability pattern in Blokhus falls within the 271-366 days range, representing 62% of listings. This suggests many properties have significant open periods on their calendars.
- Approximately 90.0% of listings show high availability (181+ days open annually), indicating potential for increased bookings or specific owner usage patterns.
- For booked days, the 31-90 days range is most frequent in Blokhus (34%), reflecting common guest stay durations or potential owner blocking patterns.
- A notable 10.0% of properties secure long booking periods (181+ days booked per year), highlighting successful long-term rental strategies or significant owner usage.
Blokhus Airbnb Minimum Stay Requirements Analysis
Distribution of Listings by Minimum Night Requirement
1 Night
5 listings
10% of total
2 Nights
4 listings
8% of total
3 Nights
5 listings
10% of total
4-6 Nights
10 listings
20% of total
7-29 Nights
2 listings
4% of total
30+ Nights
24 listings
48% of total
Key Insights
- The most prevalent minimum stay requirement in Blokhus is 30+ Nights, adopted by 48% of listings. This highlights the market's preference for longer commitments.
- Very short stays (1-2 nights) are less common (18.0%), suggesting hosts prefer slightly longer bookings to optimize turnover.
- A significant segment (48%) caters to monthly stays (30+ nights) in Blokhus, pointing to opportunities in the extended-stay market.
Recommendations
- Align with the market by considering a 30+ Nights minimum stay, as 48% of Blokhus hosts use this setting.
- If feasible, allowing 1-night stays, especially midweek or during low season, could capture last-minute bookings, as only 10% currently do.
- Explore offering discounts for stays of 30+ nights to attract the 48% of the market seeking extended stays.
- Adjust minimum nights based on seasonality – potentially shorter during low season and longer during peak demand periods in Blokhus.
Blokhus Airbnb Cancellation Policy Trends Analysis (2026)
Flexible
7 listings
14% of total
Moderate
11 listings
22% of total
Firm
24 listings
48% of total
Strict
8 listings
16% of total
Cancellation Policy Insights for Blokhus
- The prevailing Airbnb cancellation policy trend in Blokhus is Firm, used by 48% of listings.
- A majority (64.0%) of hosts in Blokhus utilize Firm or Strict policies, indicating a market where hosts prioritize booking security.
Recommendations for Hosts
- Consider adopting a Firm policy to align with the 48% market standard in Blokhus.
- Regularly review your cancellation policy against competitors and market demand shifts in Blokhus.
Blokhus STR Booking Lead Time Analysis (2026)
Average Booking Lead Time by Month
Booking Lead Time Insights for Blokhus
- The overall average booking lead time for vacation rentals in Blokhus is 62 days.
- Guests book furthest in advance for stays during July (average 99 days), likely coinciding with peak travel demand or local events.
- The shortest booking windows occur for stays in March (average 7 days), indicating more last-minute travel plans during this time.
- Seasonally, Summer (79 days avg.) sees the longest lead times, while Winter (44 days avg.) has the shortest, reflecting typical travel planning cycles.
Recommendations for Hosts
- Use the overall average lead time (62 days) as a baseline for your pricing and availability strategy in Blokhus.
- For July stays, consider implementing length-of-stay discounts or slightly higher rates for bookings made less than 99 days out to capitalize on advance planning.
- During March, focus on last-minute booking availability and promotions, as guests book with very short notice (7 days avg.).
- Target marketing efforts for the Summer season well in advance (at least 79 days) to capture early planners.
- Monitor your own booking lead times against these Blokhus averages to identify opportunities for dynamic pricing adjustments.
Popular & Essential Airbnb Amenities in Blokhus (2026)
Amenity Prevalence
Amenity Insights for Blokhus
- Essential amenities in Blokhus that guests expect include: Kitchen. Lacking these (this) could significantly impact bookings.
- Popular amenities like TV, Wifi, Heating are common but not universal. Offering these can provide a competitive edge.
- Warning: Wifi is not universally provided but is considered essential globally. Ensure reliable Wifi is offered.
Recommendations for Hosts
- Ensure your listing includes all essential amenities for Blokhus: Kitchen.
- Prioritize adding missing essentials: Kitchen.
- Consider adding popular differentiators like TV or Wifi to increase appeal.
- Highlight unique or less common amenities you offer (e.g., hot tub, dedicated workspace, EV charger) in your listing description and photos.
- Regularly check competitor amenities in Blokhus to stay competitive.
Blokhus Airbnb Guest Demographics & Profile Analysis (2026)
Guest Profile Summary for Blokhus
- The typical guest profile for Airbnb in Blokhus consists of a mix of domestic (43%) and international guests, with top international origins including Germany, typically belonging to the Post-2000s (Gen Z/Alpha) group (50%), primarily speaking English or German.
- Domestic travelers account for 42.6% of guests.
- Key international markets include Denmark (42.6%) and Germany (31%).
- Top languages spoken are English (42.9%) followed by German (22.1%).
- A significant demographic segment is the Post-2000s (Gen Z/Alpha) group, representing 50% of guests.
Recommendations for Hosts
- Balance marketing efforts between domestic and international channels based on the guest mix.
- Tailor amenities and listing descriptions to appeal to the dominant Post-2000s (Gen Z/Alpha) demographic (e.g., highlight fast WiFi, smart home features, local guides).
- Highlight unique local experiences or amenities relevant to the primary guest profile.
- Consider seasonal promotions aligned with peak travel times for key origin markets.
Nearby Short-Term Rental Market Comparison
How does the Blokhus Airbnb market stack up against its neighbors? Compare key performance metrics like average monthly revenue, ADR, and occupancy rates in surrounding areas to understand the broader regional STR landscape.
| Market | Active Properties | Monthly Revenue | Daily Rate | Avg. Occupancy |
|---|---|---|---|---|
| Øster Knasborg | 17 | $2,243 | $385.06 | 39% |
| Søndervig | 45 | $2,002 | $328.05 | 31% |
| Sunds | 18 | $1,845 | $229.08 | 43% |
| Fjaltring | 11 | $1,827 | $150.64 | 48% |
| Kandestederne | 21 | $1,811 | $219.39 | 42% |
| Flekkerøy | 41 | $1,603 | $218.05 | 40% |
| Løkken | 132 | $1,589 | $236.52 | 37% |
| Syddjurs Municipality | 412 | $1,555 | $249.33 | 36% |
| Skagen | 343 | $1,547 | $263.28 | 34% |
| Jerup | 10 | $1,536 | $199.59 | 46% |