Aalborg Airbnb Market Analysis 2026: Short Term Rental Data & Vacation Rental Statistics in North Denmark Region, Denmark
Is Airbnb profitable in Aalborg in 2026? Explore comprehensive Airbnb analytics for Aalborg, North Denmark Region, Denmark to uncover income potential. This 2026 STR market report for Aalborg, based on AirROI data from February 2025 to January 2026, reveals key trends in the market of 455 active listings.
Whether you're considering an Airbnb investment in Aalborg, optimizing your existing vacation rental, or exploring rental arbitrage opportunities, understanding the Aalborg Airbnb data is crucial. Leveraging the low regulation environment is key to maximizing your short term rental income potential. Let's dive into the specifics.
Key Aalborg Airbnb Performance Metrics Overview
Monthly Airbnb Revenue Variations & Income Potential in Aalborg (2026)
Understanding the monthly revenue variations for Airbnb listings in Aalborg is key to maximizing your short term rental income potential. Seasonality significantly impacts earnings. Our analysis, based on data from the past 12 months, shows that the peak revenue month for STRs in Aalborg is typically July, while January often presents the lowest earnings, highlighting opportunities for strategic pricing adjustments during shoulder and low seasons. Explore the typical Airbnb income in Aalborg across different performance tiers:
- Best-in-class properties (Top 10%) achieve $2,904+ monthly, often utilizing dynamic pricing and superior guest experiences.
- Strong performing properties (Top 25%) earn $1,858 or more, indicating effective management and desirable locations/amenities.
- Typical properties (Median) generate around $1,044 per month, representing the average market performance.
- Entry-level properties (Bottom 25%) see earnings around $501, often with potential for optimization.
Average Monthly Airbnb Earnings Trend in Aalborg
Aalborg Airbnb Occupancy Rate Trends (2026)
Maximize your bookings by understanding the Aalborg STR occupancy trends. Seasonal demand shifts significantly influence how often properties are booked. Typically, Julysees the highest demand (peak season occupancy), while January experiences the lowest (low season). Effective strategies, like adjusting minimum stays or offering promotions, can boost occupancy during slower periods. Here's how different property tiers perform in Aalborg:
- Best-in-class properties (Top 10%) achieve 78%+ occupancy, indicating high desirability and potentially optimized availability.
- Strong performing properties (Top 25%) maintain 59% or higher occupancy, suggesting good market fit and guest satisfaction.
- Typical properties (Median) have an occupancy rate around 34%.
- Entry-level properties (Bottom 25%) average 16% occupancy, potentially facing higher vacancy.
Average Monthly Occupancy Rate Trend in Aalborg
Average Daily Rate (ADR) Airbnb Trends in Aalborg (2026)
Effective short term rental pricing strategy in Aalborg involves understanding monthly ADR fluctuations. The Average Daily Rate (ADR) for Airbnb in Aalborg typically peaks in July and dips lowest during March. Leveraging Airbnb dynamic pricing tools or strategies based on this seasonality can significantly boost revenue. Here's a look at the typical nightly rates achieved:
- Best-in-class properties (Top 10%) command rates of $245+ per night, often due to premium features or locations.
- Strong performing properties (Top 25%) achieve nightly rates of $158 or more.
- Typical properties (Median) charge around $104 per night.
- Entry-level properties (Bottom 25%) earn around $73 per night.
Average Daily Rate (ADR) Trend by Month in Aalborg
Get Live Aalborg Market Intelligence 👇

Explore Real-time Analytics
Airbnb Seasonality Analysis & Trends in Aalborg (2026)
Peak Season (July, August, June)
- Revenue averages $1,930 per month
- Occupancy rates average 46.3%
- Daily rates average $136
Shoulder Season
- Revenue averages $1,303 per month
- Occupancy maintains around 37.1%
- Daily rates hold near $133
Low Season (January, February, March)
- Revenue drops to average $965 per month
- Occupancy decreases to average 31.7%
- Daily rates adjust to average $125
Seasonality Insights for Aalborg
- The Airbnb seasonality in Aalborg shows highly seasonal trends requiring careful strategy. While the sections above show seasonal averages, it's also insightful to look at the extremes:
- During the high season, the absolute peak month showcases Aalborg's highest earning potential, with monthly revenues capable of climbing to $2,120, occupancy reaching a high of 49.6%, and ADRs peaking at $140.
- Conversely, the slowest single month of the year, typically falling within the low season, marks the market's lowest point. In this month, revenue might dip to $812, occupancy could drop to 23.6%, and ADRs may adjust down to $122.
- Understanding both the seasonal averages and these monthly peaks and troughs in revenue, occupancy, and ADR is crucial for maximizing your Airbnb profit potential in Aalborg.
Seasonal Strategies for Maximizing Profit
- Peak Season: Maximize revenue through premium pricing and potentially longer minimum stays. Ensure high availability.
- Low Season: Offer competitive pricing, special promotions (e.g., extended stay discounts), and flexible cancellation policies. Target off-season travelers like remote workers or budget-conscious guests.
- Shoulder Seasons: Implement dynamic pricing that balances peak and low rates. Target weekend travelers or specific events. Offer slightly more flexible terms than peak season.
- Regularly analyze your own performance against these Aalborg seasonality benchmarks and adjust your pricing and availability strategy accordingly.
Best Areas for Airbnb Investment in Aalborg (2026)
Exploring the top neighborhoods for short-term rentals in Aalborg? This section highlights key areas, outlining why they are attractive for hosts and guests, along with notable local attractions. Consider these locations based on your target guest profile and investment strategy.
| Neighborhood / Area | Why Host Here? (Target Guests & Appeal) | Key Attractions & Landmarks |
|---|---|---|
| Jomfru Ane Gade | A vibrant street known for its nightlife, featuring bars and restaurants. It's popular among younger crowds and offers a lively experience for guests. | Aalborg Zoo, Aalborg Historical Museum, Kildeparken, North Jutland Art Museum, Aalborg Waterfront |
| Aalborg Waterfront | A scenic area along the Limfjord, perfect for guests who enjoy modern architecture and waterfront activities. The waterfront is great for leisurely walks and dining with a view. | Aalborg Tower, Kunsthal Nord, Aalborg Harbour Bath, The old city hall, Vesterålen Beach |
| Vesterbro | A classic neighborhood with a mix of historic and contemporary elements. It's close to the city center and provides a local feel for guests who want to explore everything Aalborg has to offer. | Budolfi Cathedral, Jens Bang's House, Nordkraft, Aalborg's city park, Hjelmerstald |
| Sundsvall | An emerging residential area with a family-friendly vibe, it appeals to tourists looking for longer stays and a homely environment close to nature. | Sundsvall's Nature Park, The beach at Koldingsvej, Local marketplaces, Park near Nordjyllands Hospital |
| Store Torv | The main square in Aalborg, surrounded by shops, eateries, and cultural sites. Excellent for visitors looking to immerse themselves in the local culture and history. | Aalborg Historical Museum, The Great Beer Tour, Outdoor cafes, Aalborg Chinatown, Shopping streets |
| Nørresundby | Just across the bridge from Aalborg, this area offers a quieter atmosphere while still being close to the city's main attractions and suited for families. | The Limfjord Bridge, Nørresundby Harbor, Nørresundby Sportspark, Art museums, The hiking trails |
| Café Nord | A trendy area known for its coffee shops and restaurants, perfect for a young crowd looking for a laid-back atmosphere and social scene. | Local music venues, Art galleries, Outdoor markets, Food events, Café Nord garden |
| Aalborg East | A great residential area known for its parks and green spaces, appealing to tourists seeking a peaceful environment while being a short distance from the city center. | Aalborg Park, Green Spaces, Local restaurants, Outdoor activities, Close to public transport |
Understanding Airbnb License Requirements & STR Laws in Aalborg (2026)
While Aalborg, North Denmark Region, Denmark currently shows low STR regulations, specific Airbnb license requirements might still exist or change. Always verify the latest short term rental regulations and Airbnb license requirements directly with local government authorities for Aalborg to ensure full compliance before hosting.
(Source: AirROI data, 2026, based on 1% licensed listings)
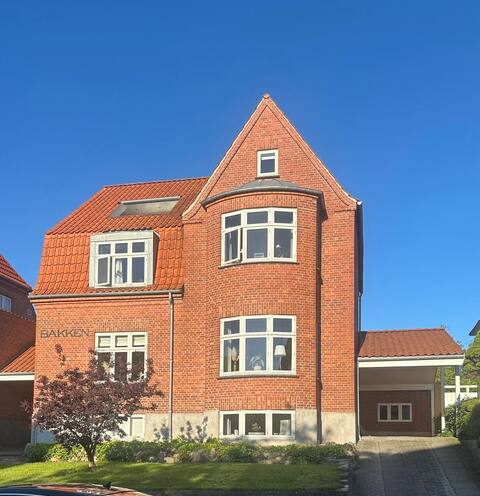
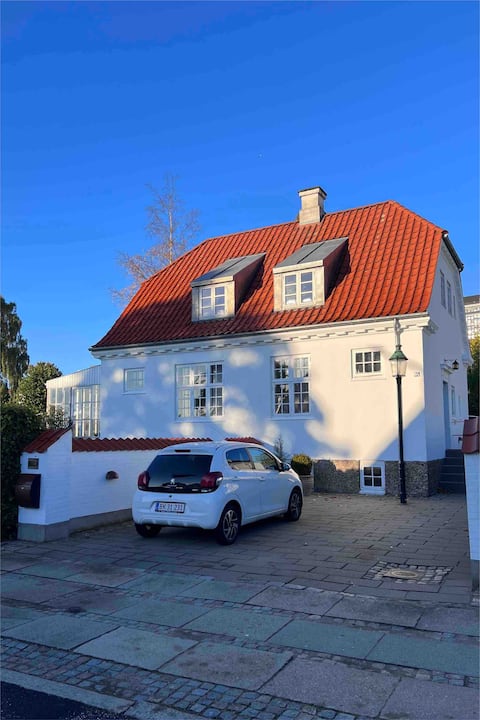
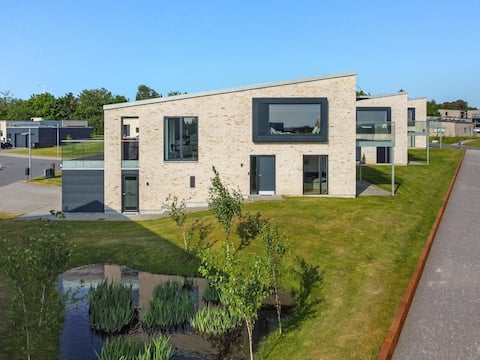
Top Performing Airbnb Properties in Aalborg (2026)
Benchmark your potential! Explore examples of top-performing Airbnb properties in Aalborgbased on Trailing Twelve Month (TTM) revenue. Analyze their characteristics, revenue, occupancy rate, and ADR to understand what drives success in this market.

Fantastic new spacious house with heated spa/pool
Entire Place • 4 bedrooms
Large and newly renovated house in the city center
Entire Place • 5 bedrooms
Family House in Aalborg City Center. Free parking
Entire Place • 4 bedrooms
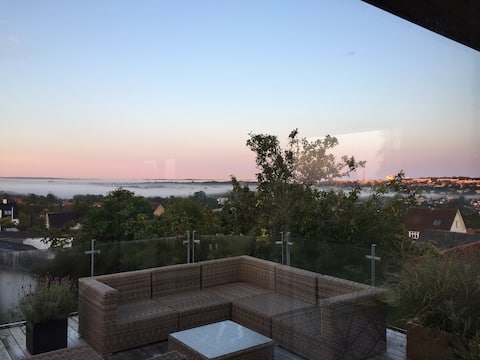
Big house with a great view
Entire Place • 5 bedrooms
Nice house with plenty of space.
Entire Place • 3 bedrooms
aday - 3 bedroom - Modern Living Apartment - Aalbo
Entire Place • 3 bedrooms
Note: Performance varies based on location, size, amenities, seasonality, and management quality. Data reflects the past 12 months.
Top Performing Airbnb Hosts in Aalborg (2026)
Learn from the best! This table showcases top-performing Airbnb hosts in Aalborg based on the number of properties managed and estimated total revenue over the past year. Analyze their scale and performance metrics.
| Host Name | Properties | Grossing Revenue | Stay Reviews | Avg Rating |
|---|---|---|---|---|
| Aday- | 39 | $437,125 | 961 | 4.17/5.0 |
| Stay | 13 | $111,298 | 183 | 3.93/5.0 |
| Andreea | 7 | $86,939 | 387 | 4.76/5.0 |
| Isolde | 1 | $82,662 | 6 | 5.00/5.0 |
| Jakob | 5 | $68,106 | 385 | 4.76/5.0 |
| Per | 3 | $66,376 | 142 | 4.80/5.0 |
| JM Rooms | 3 | $55,264 | 34 | 4.29/5.0 |
| Christina | 2 | $53,434 | 57 | 4.91/5.0 |
| Heidi Og Jens Peter | 1 | $46,890 | 28 | 5.00/5.0 |
| Jesper | 3 | $44,883 | 36 | 4.98/5.0 |
Analyzing the strategies of top hosts, such as their property selection, pricing, and guest communication, can offer valuable lessons for optimizing your own Airbnb operations in Aalborg.
Dive Deeper: Advanced Aalborg STR Market Data (2026)
Ready to unlock more insights? AirROI provides access to advanced metrics and comprehensive Airbnb data for Aalborg. Explore detailed analytics beyond this report to refine your investment strategy, optimize pricing, and maximize your vacation rental profits.
Explore Advanced MetricsAalborg Short-Term Rental Market Composition (2026): Property & Room Types
Room Type Distribution
Property Type Distribution
Market Composition Insights for Aalborg
- The Aalborg Airbnb market composition is heavily skewed towards Entire Home/Apt listings, which make up 86.8% of the 455 active rentals. This indicates strong guest preference for privacy and space.
- Looking at the property type distribution in Aalborg, Apartment/Condo properties are the most common (65.7%), reflecting the local real estate landscape.
- Houses represent a significant 29.2% portion, catering likely to families or larger groups.
- Smaller segments like hotel/boutique, outdoor/unique, others (combined 5.0%) offer potential for unique stay experiences.
Aalborg Airbnb Room Capacity Analysis (2026): Bedroom Distribution
Distribution of Listings by Number of Bedrooms
Room Capacity Insights for Aalborg
- The dominant room capacity in Aalborg is 1 bedroom listings, making up 39.6% of the market. This suggests a strong demand for properties suitable for couples or solo travelers.
- Together, 1 bedroom and 2 bedrooms properties represent 57.6% of the active Airbnb listings in Aalborg, indicating a high concentration in these sizes.
- A significant 26.6% of listings offer 3+ bedrooms, catering to larger groups and families seeking more space in Aalborg.
Aalborg Vacation Rental Guest Capacity Trends (2026)
Distribution of Listings by Guest Capacity
Guest Capacity Insights for Aalborg
- The most common guest capacity trend in Aalborg vacation rentals is listings accommodating 4 guests (21.1%). This suggests the primary traveler segment is likely small families or groups.
- Properties designed for 4 guests and 2 guests dominate the Aalborg STR market, accounting for 40.7% of listings.
- 27.5% of properties accommodate 6+ guests, serving the market segment for larger families or group travel in Aalborg.
- On average, properties in Aalborg are equipped to host 3.9 guests.
Aalborg Airbnb Booking Patterns (2026): Available vs. Booked Days
Available Days Distribution
Booked Days Distribution
Booking Pattern Insights for Aalborg
- The most common availability pattern in Aalborg falls within the 271-366 days range, representing 58.7% of listings. This suggests many properties have significant open periods on their calendars.
- Approximately 88.6% of listings show high availability (181+ days open annually), indicating potential for increased bookings or specific owner usage patterns.
- For booked days, the 31-90 days range is most frequent in Aalborg (33.8%), reflecting common guest stay durations or potential owner blocking patterns.
- A notable 12.7% of properties secure long booking periods (181+ days booked per year), highlighting successful long-term rental strategies or significant owner usage.
Aalborg Airbnb Minimum Stay Requirements Analysis
Distribution of Listings by Minimum Night Requirement
1 Night
202 listings
44.4% of total
2 Nights
84 listings
18.5% of total
3 Nights
27 listings
5.9% of total
4-6 Nights
38 listings
8.4% of total
7-29 Nights
15 listings
3.3% of total
30+ Nights
89 listings
19.6% of total
Key Insights
- The most prevalent minimum stay requirement in Aalborg is 1 Night, adopted by 44.4% of listings. This highlights the market's preference for shorter, flexible bookings.
- A strong majority (62.9%) of the Aalborg Airbnb data shows acceptance of very short stays (1-2 nights), indicating a dynamic, high-turnover market.
- A significant segment (19.6%) caters to monthly stays (30+ nights) in Aalborg, pointing to opportunities in the extended-stay market.
Recommendations
- Align with the market by considering a 1 Night minimum stay, as 44.4% of Aalborg hosts use this setting.
- Explore offering discounts for stays of 30+ nights to attract the 19.6% of the market seeking extended stays.
- Adjust minimum nights based on seasonality – potentially shorter during low season and longer during peak demand periods in Aalborg.
Aalborg Airbnb Cancellation Policy Trends Analysis (2026)
Super Strict 60 Days
2 listings
0.4% of total
Super Strict 30 Days
12 listings
2.6% of total
Limited
1 listings
0.2% of total
Flexible
157 listings
34.6% of total
Moderate
190 listings
41.9% of total
Firm
71 listings
15.6% of total
Strict
21 listings
4.6% of total
Cancellation Policy Insights for Aalborg
- The prevailing Airbnb cancellation policy trend in Aalborg is Moderate, used by 41.9% of listings.
- The market strongly favors guest-friendly terms, with 76.5% of listings offering Flexible or Moderate policies. This suggests guests in Aalborg may expect booking flexibility.
- Strict cancellation policies are quite rare (4.6%), potentially making listings with this policy less competitive unless justified by high demand or property type.
Recommendations for Hosts
- Consider adopting a Moderate policy to align with the 41.9% market standard in Aalborg.
- Using a Strict policy might deter some guests, as only 4.6% of listings use it. Evaluate if potential revenue protection outweighs possible lower booking rates.
- Regularly review your cancellation policy against competitors and market demand shifts in Aalborg.
Aalborg STR Booking Lead Time Analysis (2026)
Average Booking Lead Time by Month
Booking Lead Time Insights for Aalborg
- The overall average booking lead time for vacation rentals in Aalborg is 43 days.
- Guests book furthest in advance for stays during July (average 60 days), likely coinciding with peak travel demand or local events.
- The shortest booking windows occur for stays in February (average 21 days), indicating more last-minute travel plans during this time.
- Seasonally, Summer (53 days avg.) sees the longest lead times, while Winter (29 days avg.) has the shortest, reflecting typical travel planning cycles.
Recommendations for Hosts
- Use the overall average lead time (43 days) as a baseline for your pricing and availability strategy in Aalborg.
- For July stays, consider implementing length-of-stay discounts or slightly higher rates for bookings made less than 60 days out to capitalize on advance planning.
- Target marketing efforts for the Summer season well in advance (at least 53 days) to capture early planners.
- Monitor your own booking lead times against these Aalborg averages to identify opportunities for dynamic pricing adjustments.
Popular & Essential Airbnb Amenities in Aalborg (2026)
Amenity Prevalence
Amenity Insights for Aalborg
- Popular amenities like Kitchen, Wifi, TV are common but not universal. Offering these can provide a competitive edge.
- Warning: Wifi is not universally provided but is considered essential globally. Ensure reliable Wifi is offered.
Recommendations for Hosts
- Consider adding popular differentiators like Kitchen or Wifi to increase appeal.
- Highlight unique or less common amenities you offer (e.g., hot tub, dedicated workspace, EV charger) in your listing description and photos.
- Regularly check competitor amenities in Aalborg to stay competitive.
Aalborg Airbnb Guest Demographics & Profile Analysis (2026)
Guest Profile Summary for Aalborg
- The typical guest profile for Airbnb in Aalborg consists of a mix of domestic (37%) and international guests, with top international origins including Germany, typically belonging to the Post-2000s (Gen Z/Alpha) group (50%), primarily speaking English or Danish.
- Domestic travelers account for 37.0% of guests.
- Key international markets include Denmark (37%) and Germany (14.1%).
- Top languages spoken are English (37.5%) followed by Danish (16.2%).
- A significant demographic segment is the Post-2000s (Gen Z/Alpha) group, representing 50% of guests.
Recommendations for Hosts
- Focus marketing internationally, particularly towards travelers from Germany.
- Tailor amenities and listing descriptions to appeal to the dominant Post-2000s (Gen Z/Alpha) demographic (e.g., highlight fast WiFi, smart home features, local guides).
- Highlight unique local experiences or amenities relevant to the primary guest profile.
- Consider seasonal promotions aligned with peak travel times for key origin markets.
Nearby Short-Term Rental Market Comparison
How does the Aalborg Airbnb market stack up against its neighbors? Compare key performance metrics like average monthly revenue, ADR, and occupancy rates in surrounding areas to understand the broader regional STR landscape.
| Market | Active Properties | Monthly Revenue | Daily Rate | Avg. Occupancy |
|---|---|---|---|---|
| Øster Knasborg | 17 | $2,243 | $385.06 | 39% |
| Søndervig | 45 | $2,002 | $328.05 | 31% |
| Sunds | 18 | $1,845 | $229.08 | 43% |
| Fjaltring | 11 | $1,827 | $150.64 | 48% |
| Kandestederne | 21 | $1,811 | $219.39 | 42% |
| Blokhus | 50 | $1,688 | $235.35 | 35% |
| Flekkerøy | 41 | $1,603 | $218.05 | 40% |
| Løkken | 132 | $1,589 | $236.52 | 37% |
| Syddjurs Municipality | 412 | $1,555 | $249.33 | 36% |
| Skagen | 343 | $1,547 | $263.28 | 34% |