Tranbjerg Airbnb Market Analysis 2026: Short Term Rental Data & Vacation Rental Statistics in Central Denmark Region, Denmark
Is Airbnb profitable in Tranbjerg in 2026? Explore comprehensive Airbnb analytics for Tranbjerg, Central Denmark Region, Denmark to uncover income potential. This 2026 STR market report for Tranbjerg, based on AirROI data from February 2025 to January 2026, reveals key trends in the niche market of 20 active listings.
Whether you're considering an Airbnb investment in Tranbjerg, optimizing your existing vacation rental, or exploring rental arbitrage opportunities, understanding the Tranbjerg Airbnb data is crucial. Leveraging the low regulation environment is key to maximizing your short term rental income potential. Let's dive into the specifics.
Key Tranbjerg Airbnb Performance Metrics Overview
Monthly Airbnb Revenue Variations & Income Potential in Tranbjerg (2026)
Understanding the monthly revenue variations for Airbnb listings in Tranbjerg is key to maximizing your short term rental income potential. Seasonality significantly impacts earnings. Our analysis, based on data from the past 12 months, shows that the peak revenue month for STRs in Tranbjerg is typically August, while October often presents the lowest earnings, highlighting opportunities for strategic pricing adjustments during shoulder and low seasons. Explore the typical Airbnb income in Tranbjerg across different performance tiers:
- Best-in-class properties (Top 10%) achieve $2,882+ monthly, often utilizing dynamic pricing and superior guest experiences.
- Strong performing properties (Top 25%) earn $1,627 or more, indicating effective management and desirable locations/amenities.
- Typical properties (Median) generate around $986 per month, representing the average market performance.
- Entry-level properties (Bottom 25%) see earnings around $444, often with potential for optimization.
Average Monthly Airbnb Earnings Trend in Tranbjerg
Tranbjerg Airbnb Occupancy Rate Trends (2026)
Maximize your bookings by understanding the Tranbjerg STR occupancy trends. Seasonal demand shifts significantly influence how often properties are booked. Typically, Augustsees the highest demand (peak season occupancy), while April experiences the lowest (low season). Effective strategies, like adjusting minimum stays or offering promotions, can boost occupancy during slower periods. Here's how different property tiers perform in Tranbjerg:
- Best-in-class properties (Top 10%) achieve 74%+ occupancy, indicating high desirability and potentially optimized availability.
- Strong performing properties (Top 25%) maintain 55% or higher occupancy, suggesting good market fit and guest satisfaction.
- Typical properties (Median) have an occupancy rate around 32%.
- Entry-level properties (Bottom 25%) average 17% occupancy, potentially facing higher vacancy.
Average Monthly Occupancy Rate Trend in Tranbjerg
Average Daily Rate (ADR) Airbnb Trends in Tranbjerg (2026)
Effective short term rental pricing strategy in Tranbjerg involves understanding monthly ADR fluctuations. The Average Daily Rate (ADR) for Airbnb in Tranbjerg typically peaks in October and dips lowest during March. Leveraging Airbnb dynamic pricing tools or strategies based on this seasonality can significantly boost revenue. Here's a look at the typical nightly rates achieved:
- Best-in-class properties (Top 10%) command rates of $215+ per night, often due to premium features or locations.
- Strong performing properties (Top 25%) achieve nightly rates of $150 or more.
- Typical properties (Median) charge around $98 per night.
- Entry-level properties (Bottom 25%) earn around $61 per night.
Average Daily Rate (ADR) Trend by Month in Tranbjerg
Get Live Tranbjerg Market Intelligence 👇

Explore Real-time Analytics
Airbnb Seasonality Analysis & Trends in Tranbjerg (2026)
Peak Season (August, July, June)
- Revenue averages $2,044 per month
- Occupancy rates average 50.3%
- Daily rates average $117
Shoulder Season
- Revenue averages $1,097 per month
- Occupancy maintains around 38.5%
- Daily rates hold near $119
Low Season (February, April, October)
- Revenue drops to average $737 per month
- Occupancy decreases to average 25.3%
- Daily rates adjust to average $115
Seasonality Insights for Tranbjerg
- The Airbnb seasonality in Tranbjerg shows highly seasonal trends requiring careful strategy. While the sections above show seasonal averages, it's also insightful to look at the extremes:
- During the high season, the absolute peak month showcases Tranbjerg's highest earning potential, with monthly revenues capable of climbing to $2,279, occupancy reaching a high of 59.6%, and ADRs peaking at $125.
- Conversely, the slowest single month of the year, typically falling within the low season, marks the market's lowest point. In this month, revenue might dip to $641, occupancy could drop to 24.5%, and ADRs may adjust down to $109.
- Understanding both the seasonal averages and these monthly peaks and troughs in revenue, occupancy, and ADR is crucial for maximizing your Airbnb profit potential in Tranbjerg.
Seasonal Strategies for Maximizing Profit
- Peak Season: Maximize revenue through premium pricing and potentially longer minimum stays. Ensure high availability.
- Low Season: Offer competitive pricing, special promotions (e.g., extended stay discounts), and flexible cancellation policies. Target off-season travelers like remote workers or budget-conscious guests.
- Shoulder Seasons: Implement dynamic pricing that balances peak and low rates. Target weekend travelers or specific events. Offer slightly more flexible terms than peak season.
- Regularly analyze your own performance against these Tranbjerg seasonality benchmarks and adjust your pricing and availability strategy accordingly.
Best Areas for Airbnb Investment in Tranbjerg (2026)
Exploring the top neighborhoods for short-term rentals in Tranbjerg? This section highlights key areas, outlining why they are attractive for hosts and guests, along with notable local attractions. Consider these locations based on your target guest profile and investment strategy.
| Neighborhood / Area | Why Host Here? (Target Guests & Appeal) | Key Attractions & Landmarks |
|---|---|---|
| Tranbjerg | A charming suburb of Aarhus, Tranbjerg offers a peaceful environment close to urban amenities. It's great for families and those looking for quiet yet convenient living. | Aarhus Botanical Gardens, Tivoli Friheden, Aarhus City, Marselisborg Deer Park, Den Gamle By (The Old Town), Aarhus Art Museum |
| Aarhus City Center | The heart of Aarhus, the city center is bustling with shops, restaurants, and cultural sites. Ideal for travelers wanting to explore the city's vibrant urban life. | Aarhus Cathedral, Aarhus Municipal Theater, Strøget (shopping street), Latinerkvarteret (Latin Quarter), ARoS Aarhus Art Museum, Dokk1 |
| Marselisborg | Known for its beautiful coastal park and historic palace. Attracts both tourists and locals looking for leisure and outdoor activities by the sea. | Marselisborg Palace, Marselisborg Mindepark, The Beach of Bellevue, Ballehage Strand, Marselisborg Marina, Naturpark Daggerholmene |
| Viby J | A lively suburb of Aarhus offering great transport links and local shopping. Popular with those looking for suburban qualities while being close to the city. | Viby Torv, Viby Stadium, Shopping in Viby Center, Nearby nature parks, Cafés and local eateries, Easy access to Aarhus |
| Brabrand | A serene area known for its lake and recreational facilities. It appeals to nature lovers and those looking for a retreat from the city hustle. | Brabrand Lake, Brabrandstien (walking path), Brabrand Cemetery, Shopping in Brabrand Center, Nature reserves, Sports facilities |
| Beder-Malling | A quaint area with family-friendly attractions and access to beautiful nature. Great for families wanting to explore beyond Aarhus. | Beder Church, Nature areas, Local schools and parks, Community activities, Nearby lakes, Cafés |
| Skanderborg | Located a short drive from Aarhus, Skanderborg offers beautiful lakes and forest areas. It’s perfect for guests seeking tranquility and outdoor adventures. | Skanderborg Lake, Skanderborg Castle, Nature walks, Local festivals, Historiecenter Skanderborg, Den Gamle By in Skanderborg |
| Højbjerg | An attractive residential area with a mix of urban and natural environments. Close to Aarhus University and popular for both students and families. | Aarhus University, Botanical Garden, Jutland Art Academy, Højbjerg Park, Local shops, Cafés and eateries |
Understanding Airbnb License Requirements & STR Laws in Tranbjerg (2026)
While Tranbjerg, Central Denmark Region, Denmark currently shows low STR regulations, specific Airbnb license requirements might still exist or change. Always verify the latest short term rental regulations and Airbnb license requirements directly with local government authorities for Tranbjerg to ensure full compliance before hosting.
(Source: AirROI data, 2026, finding no licensed listings among those analyzed)
Top Performing Airbnb Properties in Tranbjerg (2026)
Benchmark your potential! Explore examples of top-performing Airbnb properties in Tranbjergbased on Trailing Twelve Month (TTM) revenue. Analyze their characteristics, revenue, occupancy rate, and ADR to understand what drives success in this market.
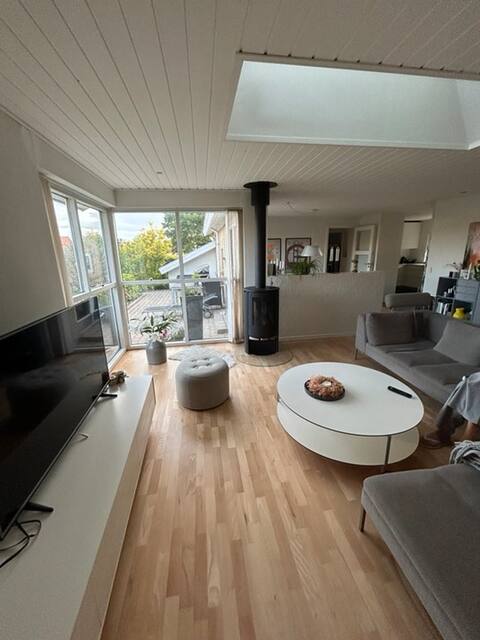
Home in Aarhus south, Tranbjerg
Entire Place • 2 bedrooms

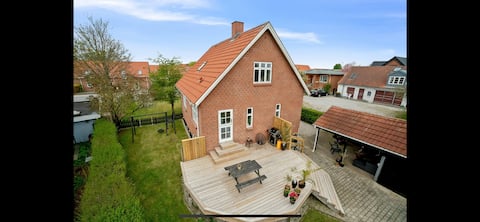
Cozy house in a fun area
Entire Place • 3 bedrooms

Family-friendly and centrally located
Entire Place • 3 bedrooms

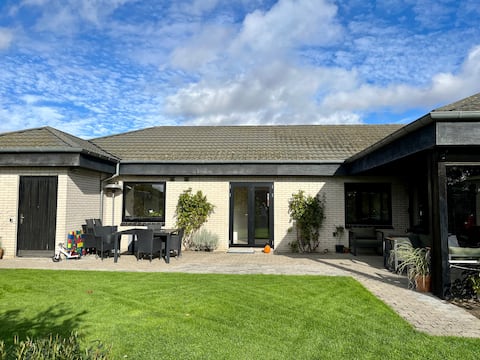
Large apartment in rural surroundings
Entire Place • 2 bedrooms
Large holiday home for family
Entire Place • 4 bedrooms
Wonderful house with garden and free parking
Entire Place • 4 bedrooms
Note: Performance varies based on location, size, amenities, seasonality, and management quality. Data reflects the past 12 months.
Top Performing Airbnb Hosts in Tranbjerg (2026)
Learn from the best! This table showcases top-performing Airbnb hosts in Tranbjerg based on the number of properties managed and estimated total revenue over the past year. Analyze their scale and performance metrics.
| Host Name | Properties | Grossing Revenue | Stay Reviews | Avg Rating |
|---|---|---|---|---|
| Lars | 3 | $37,322 | 430 | 4.86/5.0 |
| Mai-Brit | 1 | $23,251 | 33 | 4.79/5.0 |
| Mia | 1 | $19,243 | 22 | 4.86/5.0 |
| Julie | 1 | $16,742 | 3 | 5.00/5.0 |
| Anne Sofie | 1 | $14,031 | 3 | 5.00/5.0 |
| Mette | 1 | $13,145 | 10 | 5.00/5.0 |
| Iben | 1 | $12,893 | 197 | 4.94/5.0 |
| Host #185457876 | 1 | $12,174 | 0 | Not Rated |
| Jarek | 2 | $9,861 | 56 | 4.75/5.0 |
| Jonas | 1 | $8,254 | 8 | 4.63/5.0 |
Analyzing the strategies of top hosts, such as their property selection, pricing, and guest communication, can offer valuable lessons for optimizing your own Airbnb operations in Tranbjerg.
Dive Deeper: Advanced Tranbjerg STR Market Data (2026)
Ready to unlock more insights? AirROI provides access to advanced metrics and comprehensive Airbnb data for Tranbjerg. Explore detailed analytics beyond this report to refine your investment strategy, optimize pricing, and maximize your vacation rental profits.
Explore Advanced MetricsTranbjerg Short-Term Rental Market Composition (2026): Property & Room Types
Room Type Distribution
Property Type Distribution
Market Composition Insights for Tranbjerg
- The Tranbjerg Airbnb market composition is heavily skewed towards Entire Home/Apt listings, which make up 65% of the 20 active rentals. This indicates strong guest preference for privacy and space.
- However, a notable 35% share for Private Rooms suggests opportunities for budget-conscious travelers or hosts renting out spare rooms.
- Looking at the property type distribution in Tranbjerg, House properties are the most common (65%), reflecting the local real estate landscape.
- Houses represent a significant 65% portion, catering likely to families or larger groups.
Tranbjerg Airbnb Room Capacity Analysis (2026): Bedroom Distribution
Distribution of Listings by Number of Bedrooms
Room Capacity Insights for Tranbjerg
- The dominant room capacity in Tranbjerg is 1 bedroom listings, making up 25% of the market. This suggests a strong demand for properties suitable for couples or solo travelers.
- Together, 1 bedroom and 2 bedrooms properties represent 50.0% of the active Airbnb listings in Tranbjerg, indicating a high concentration in these sizes.
- A significant 25.0% of listings offer 3+ bedrooms, catering to larger groups and families seeking more space in Tranbjerg.
Tranbjerg Vacation Rental Guest Capacity Trends (2026)
Distribution of Listings by Guest Capacity
Guest Capacity Insights for Tranbjerg
- The most common guest capacity trend in Tranbjerg vacation rentals is listings accommodating 5 guests (20%). This suggests the primary traveler segment is likely larger groups.
- Properties designed for 5 guests and 3 guests dominate the Tranbjerg STR market, accounting for 35.0% of listings.
- 15.0% of properties accommodate 6+ guests, serving the market segment for larger families or group travel in Tranbjerg.
- On average, properties in Tranbjerg are equipped to host 3.0 guests.
Tranbjerg Airbnb Booking Patterns (2026): Available vs. Booked Days
Available Days Distribution
Booked Days Distribution
Booking Pattern Insights for Tranbjerg
- The most common availability pattern in Tranbjerg falls within the 271-366 days range, representing 65% of listings. This suggests many properties have significant open periods on their calendars.
- Approximately 95.0% of listings show high availability (181+ days open annually), indicating potential for increased bookings or specific owner usage patterns.
- For booked days, the 31-90 days range is most frequent in Tranbjerg (40%), reflecting common guest stay durations or potential owner blocking patterns.
- A notable 10.0% of properties secure long booking periods (181+ days booked per year), highlighting successful long-term rental strategies or significant owner usage.
Tranbjerg Airbnb Minimum Stay Requirements Analysis
Distribution of Listings by Minimum Night Requirement
1 Night
8 listings
40% of total
2 Nights
4 listings
20% of total
3 Nights
4 listings
20% of total
4-6 Nights
3 listings
15% of total
30+ Nights
1 listings
5% of total
Key Insights
- The most prevalent minimum stay requirement in Tranbjerg is 1 Night, adopted by 40% of listings. This highlights the market's preference for shorter, flexible bookings.
Recommendations
- Align with the market by considering a 1 Night minimum stay, as 40% of Tranbjerg hosts use this setting.
- Adjust minimum nights based on seasonality – potentially shorter during low season and longer during peak demand periods in Tranbjerg.
Tranbjerg Airbnb Cancellation Policy Trends Analysis (2026)
Flexible
5 listings
26.3% of total
Moderate
6 listings
31.6% of total
Firm
8 listings
42.1% of total
Cancellation Policy Insights for Tranbjerg
- The prevailing Airbnb cancellation policy trend in Tranbjerg is Firm, used by 42.1% of listings.
- There's a relatively balanced mix between guest-friendly (57.9%) and stricter (42.1%) policies, offering choices for different guest needs.
Recommendations for Hosts
- Consider adopting a Firm policy to align with the 42.1% market standard in Tranbjerg.
- Regularly review your cancellation policy against competitors and market demand shifts in Tranbjerg.
Tranbjerg STR Booking Lead Time Analysis (2026)
Average Booking Lead Time by Month
Booking Lead Time Insights for Tranbjerg
- The overall average booking lead time for vacation rentals in Tranbjerg is 41 days.
- Guests book furthest in advance for stays during August (average 70 days), likely coinciding with peak travel demand or local events.
- The shortest booking windows occur for stays in April (average 15 days), indicating more last-minute travel plans during this time.
- Seasonally, Summer (57 days avg.) sees the longest lead times, while Spring (23 days avg.) has the shortest, reflecting typical travel planning cycles.
Recommendations for Hosts
- Use the overall average lead time (41 days) as a baseline for your pricing and availability strategy in Tranbjerg.
- For August stays, consider implementing length-of-stay discounts or slightly higher rates for bookings made less than 70 days out to capitalize on advance planning.
- Target marketing efforts for the Summer season well in advance (at least 57 days) to capture early planners.
- Monitor your own booking lead times against these Tranbjerg averages to identify opportunities for dynamic pricing adjustments.
Popular & Essential Airbnb Amenities in Tranbjerg (2026)
Amenity Prevalence
Amenity Insights for Tranbjerg
- Essential amenities in Tranbjerg that guests expect include: Wifi, Free parking on premises, Hot water, Heating. Lacking these (any) could significantly impact bookings.
- Popular amenities like Smoke alarm, Kitchen, TV are common but not universal. Offering these can provide a competitive edge.
Recommendations for Hosts
- Ensure your listing includes all essential amenities for Tranbjerg: Wifi, Free parking on premises, Hot water, Heating.
- Prioritize adding missing essentials: Hot water, Heating.
- Consider adding popular differentiators like Smoke alarm or Kitchen to increase appeal.
- Highlight unique or less common amenities you offer (e.g., hot tub, dedicated workspace, EV charger) in your listing description and photos.
- Regularly check competitor amenities in Tranbjerg to stay competitive.
Tranbjerg Airbnb Guest Demographics & Profile Analysis (2026)
Guest Profile Summary for Tranbjerg
- The typical guest profile for Airbnb in Tranbjerg consists of a mix of domestic (46%) and international guests, with top international origins including Germany, typically belonging to the Post-2000s (Gen Z/Alpha) group (50%), primarily speaking English or Danish.
- Domestic travelers account for 46.0% of guests.
- Key international markets include Denmark (46%) and Germany (19%).
- Top languages spoken are English (29.7%) followed by Danish (20.3%).
- A significant demographic segment is the Post-2000s (Gen Z/Alpha) group, representing 50% of guests.
Recommendations for Hosts
- Balance marketing efforts between domestic and international channels based on the guest mix.
- Tailor amenities and listing descriptions to appeal to the dominant Post-2000s (Gen Z/Alpha) demographic (e.g., highlight fast WiFi, smart home features, local guides).
- Highlight unique local experiences or amenities relevant to the primary guest profile.
- Consider seasonal promotions aligned with peak travel times for key origin markets.
Nearby Short-Term Rental Market Comparison
How does the Tranbjerg Airbnb market stack up against its neighbors? Compare key performance metrics like average monthly revenue, ADR, and occupancy rates in surrounding areas to understand the broader regional STR landscape.
| Market | Active Properties | Monthly Revenue | Daily Rate | Avg. Occupancy |
|---|---|---|---|---|
| Lohals | 20 | $2,866 | $331.99 | 40% |
| Øster Knasborg | 17 | $2,243 | $385.06 | 39% |
| Rude Strand | 27 | $2,198 | $254.15 | 41% |
| Korshavn | 14 | $2,192 | $244.24 | 41% |
| Tørresø Strand | 26 | $2,145 | $235.54 | 42% |
| Billund | 105 | $2,027 | $194.14 | 46% |
| Stillinge Strand | 22 | $1,853 | $228.00 | 36% |
| Sunds | 18 | $1,845 | $229.08 | 43% |
| Troense | 15 | $1,844 | $186.12 | 44% |
| Odder Municipality | 36 | $1,840 | $167.00 | 45% |