Femmøller Airbnb Market Analysis 2026: Short Term Rental Data & Vacation Rental Statistics in Central Denmark Region, Denmark
Is Airbnb profitable in Femmøller in 2026? Explore comprehensive Airbnb analytics for Femmøller, Central Denmark Region, Denmark to uncover income potential. This 2026 STR market report for Femmøller, based on AirROI data from February 2025 to January 2026, reveals key trends in the niche market of 24 active listings.
Whether you're considering an Airbnb investment in Femmøller, optimizing your existing vacation rental, or exploring rental arbitrage opportunities, understanding the Femmøller Airbnb data is crucial. Leveraging the low regulation environment is key to maximizing your short term rental income potential. Let's dive into the specifics.
Key Femmøller Airbnb Performance Metrics Overview
Monthly Airbnb Revenue Variations & Income Potential in Femmøller (2026)
Understanding the monthly revenue variations for Airbnb listings in Femmøller is key to maximizing your short term rental income potential. Seasonality significantly impacts earnings. Our analysis, based on data from the past 12 months, shows that the peak revenue month for STRs in Femmøller is typically July, while January often presents the lowest earnings, highlighting opportunities for strategic pricing adjustments during shoulder and low seasons. Explore the typical Airbnb income in Femmøller across different performance tiers:
- Best-in-class properties (Top 10%) achieve $4,620+ monthly, often utilizing dynamic pricing and superior guest experiences.
- Strong performing properties (Top 25%) earn $2,582 or more, indicating effective management and desirable locations/amenities.
- Typical properties (Median) generate around $1,460 per month, representing the average market performance.
- Entry-level properties (Bottom 25%) see earnings around $792, often with potential for optimization.
Average Monthly Airbnb Earnings Trend in Femmøller
Femmøller Airbnb Occupancy Rate Trends (2026)
Maximize your bookings by understanding the Femmøller STR occupancy trends. Seasonal demand shifts significantly influence how often properties are booked. Typically, Julysees the highest demand (peak season occupancy), while January experiences the lowest (low season). Effective strategies, like adjusting minimum stays or offering promotions, can boost occupancy during slower periods. Here's how different property tiers perform in Femmøller:
- Best-in-class properties (Top 10%) achieve 71%+ occupancy, indicating high desirability and potentially optimized availability.
- Strong performing properties (Top 25%) maintain 51% or higher occupancy, suggesting good market fit and guest satisfaction.
- Typical properties (Median) have an occupancy rate around 28%.
- Entry-level properties (Bottom 25%) average 13% occupancy, potentially facing higher vacancy.
Average Monthly Occupancy Rate Trend in Femmøller
Average Daily Rate (ADR) Airbnb Trends in Femmøller (2026)
Effective short term rental pricing strategy in Femmøller involves understanding monthly ADR fluctuations. The Average Daily Rate (ADR) for Airbnb in Femmøller typically peaks in December and dips lowest during February. Leveraging Airbnb dynamic pricing tools or strategies based on this seasonality can significantly boost revenue. Here's a look at the typical nightly rates achieved:
- Best-in-class properties (Top 10%) command rates of $476+ per night, often due to premium features or locations.
- Strong performing properties (Top 25%) achieve nightly rates of $217 or more.
- Typical properties (Median) charge around $158 per night.
- Entry-level properties (Bottom 25%) earn around $124 per night.
Average Daily Rate (ADR) Trend by Month in Femmøller
Get Live Femmøller Market Intelligence 👇

Explore Real-time Analytics
Airbnb Seasonality Analysis & Trends in Femmøller (2026)
Peak Season (July, October, August)
- Revenue averages $3,019 per month
- Occupancy rates average 52.5%
- Daily rates average $213
Shoulder Season
- Revenue averages $1,893 per month
- Occupancy maintains around 29.9%
- Daily rates hold near $220
Low Season (January, February, May)
- Revenue drops to average $1,261 per month
- Occupancy decreases to average 25.6%
- Daily rates adjust to average $208
Seasonality Insights for Femmøller
- The Airbnb seasonality in Femmøller shows highly seasonal trends requiring careful strategy. While the sections above show seasonal averages, it's also insightful to look at the extremes:
- During the high season, the absolute peak month showcases Femmøller's highest earning potential, with monthly revenues capable of climbing to $3,361, occupancy reaching a high of 59.4%, and ADRs peaking at $239.
- Conversely, the slowest single month of the year, typically falling within the low season, marks the market's lowest point. In this month, revenue might dip to $935, occupancy could drop to 18.0%, and ADRs may adjust down to $196.
- Understanding both the seasonal averages and these monthly peaks and troughs in revenue, occupancy, and ADR is crucial for maximizing your Airbnb profit potential in Femmøller.
Seasonal Strategies for Maximizing Profit
- Peak Season: Maximize revenue through premium pricing and potentially longer minimum stays. Ensure high availability.
- Low Season: Offer competitive pricing, special promotions (e.g., extended stay discounts), and flexible cancellation policies. Target off-season travelers like remote workers or budget-conscious guests.
- Shoulder Seasons: Implement dynamic pricing that balances peak and low rates. Target weekend travelers or specific events. Offer slightly more flexible terms than peak season.
- Regularly analyze your own performance against these Femmøller seasonality benchmarks and adjust your pricing and availability strategy accordingly.
Best Areas for Airbnb Investment in Femmøller (2026)
Exploring the top neighborhoods for short-term rentals in Femmøller? This section highlights key areas, outlining why they are attractive for hosts and guests, along with notable local attractions. Consider these locations based on your target guest profile and investment strategy.
| Neighborhood / Area | Why Host Here? (Target Guests & Appeal) | Key Attractions & Landmarks |
|---|---|---|
| Femmøller Beach | A picturesque beach area known for its scenic views and family-friendly environment. Popular among tourists looking for peaceful beach vacations and water activities. | Femmøller Strand, Jutland Coastal Path, Femmøller Molle, Mols Bjerge National Park, local seafood restaurants |
| Mols Bjerge | A National Park offering beautiful landscapes, hiking trails, and outdoor activities. It attracts nature lovers and adventure seekers looking for a serene escape. | Mols Bjerge National Park, Kalø Castle Ruins, Snaptun Harbour, Hiking Trails, Nature Reserves |
| Ebeltoft | A charming historic town with cobbled streets and half-timbered houses. It's perfect for tourists who want to explore Danish culture and history while enjoying seaside attractions. | Ebeltoft Glass Museum, Fregatten Jylland, Old Town Ebeltoft, Ebeltoft Beach, Local art galleries |
| Skødshoved | A cozy harbor area ideal for those seeking a tranquil atmosphere and water-based activities like fishing and sailing. Perfect for families and couples. | Skødshoved Beach, Skødshoved Harbour, Fishing Spots, Nearby forests, Scenic picnic areas |
| Nerby | A quiet village area with beautiful countryside and close proximity to the coast. Great for tourists looking to relax and explore rural Denmark. | Countryside walks, Local farms, Nature experiences, Scenic viewpoints, Cycling routes |
| Mols | Known for its scenic hills and peaceful agricultural landscape. A perfect spot for eco-tourism and getting close to nature. | Mols Bjerge National Park, Scenic viewpoints, Local farms, Cultural heritage sites, Cycling paths |
| Sølkær | A lakeside area providing fishing, hiking, and other outdoor activities. This is an attractive option for nature lovers and those looking for leisure experiences. | Lakeside activities, Nature trails, Fishing spots, Wildlife watching, Picnic areas |
| Rønde | A small town with historical significance and close access to various attractions. It serves as a gateway for exploring the region's rich culture and nature. | Rønde Church, Local markets, Cultural events, Historical sites, Nature reserves |
Understanding Airbnb License Requirements & STR Laws in Femmøller (2026)
While Femmøller, Central Denmark Region, Denmark currently shows low STR regulations, specific Airbnb license requirements might still exist or change. Always verify the latest short term rental regulations and Airbnb license requirements directly with local government authorities for Femmøller to ensure full compliance before hosting.
(Source: AirROI data, 2026, finding no licensed listings among those analyzed)
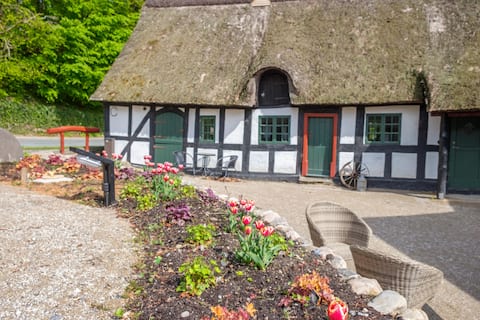
Top Performing Airbnb Properties in Femmøller (2026)
Benchmark your potential! Explore examples of top-performing Airbnb properties in Femmøllerbased on Trailing Twelve Month (TTM) revenue. Analyze their characteristics, revenue, occupancy rate, and ADR to understand what drives success in this market.

Charming new cottage - up to 12 people.
Entire Place • 5 bedrooms
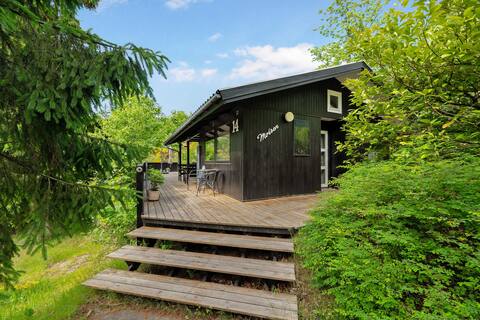
Charming Stay in One of the Historic Wings of.
Entire Place • 2 bedrooms
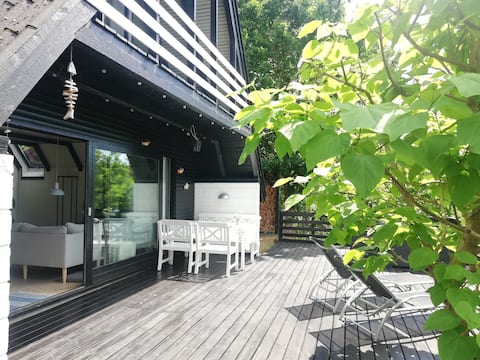
Cozy holiday home in the heart of Mols Bjerge –.
Entire Place • 2 bedrooms

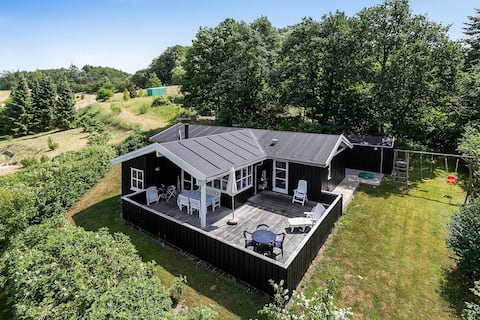
Cottage with beautiful views
Entire Place • 4 bedrooms
Cottage in Mols Bjerge with stunning views
Entire Place • 3 bedrooms
Charming cottage in Femmøller near Ebeltoft
Entire Place • 4 bedrooms
Note: Performance varies based on location, size, amenities, seasonality, and management quality. Data reflects the past 12 months.
Top Performing Airbnb Hosts in Femmøller (2026)
Learn from the best! This table showcases top-performing Airbnb hosts in Femmøller based on the number of properties managed and estimated total revenue over the past year. Analyze their scale and performance metrics.
| Host Name | Properties | Grossing Revenue | Stay Reviews | Avg Rating |
|---|---|---|---|---|
| Ebeltoft Feriehusudlejning | 2 | $81,016 | 3 | Not Rated |
| Morten | 1 | $45,592 | 18 | 5.00/5.0 |
| Sara | 1 | $38,662 | 19 | 4.95/5.0 |
| Mette | 1 | $26,547 | 28 | 4.93/5.0 |
| Lene | 1 | $20,842 | 58 | 4.95/5.0 |
| Søren Gubi | 1 | $19,228 | 115 | 4.97/5.0 |
| Lars | 1 | $19,071 | 113 | 4.91/5.0 |
| Klaus | 1 | $18,726 | 79 | 4.87/5.0 |
| Misan | 1 | $18,259 | 42 | 4.95/5.0 |
| Ulla Juul | 2 | $13,802 | 46 | 4.70/5.0 |
Analyzing the strategies of top hosts, such as their property selection, pricing, and guest communication, can offer valuable lessons for optimizing your own Airbnb operations in Femmøller.
Dive Deeper: Advanced Femmøller STR Market Data (2026)
Ready to unlock more insights? AirROI provides access to advanced metrics and comprehensive Airbnb data for Femmøller. Explore detailed analytics beyond this report to refine your investment strategy, optimize pricing, and maximize your vacation rental profits.
Explore Advanced MetricsFemmøller Short-Term Rental Market Composition (2026): Property & Room Types
Room Type Distribution
Property Type Distribution
Market Composition Insights for Femmøller
- The Femmøller Airbnb market composition is heavily skewed towards Entire Home/Apt listings, which make up 79.2% of the 24 active rentals. This indicates strong guest preference for privacy and space.
- Looking at the property type distribution in Femmøller, House properties are the most common (50%), reflecting the local real estate landscape.
- Houses represent a significant 50% portion, catering likely to families or larger groups.
- The presence of 16.7% Hotel/Boutique listings indicates integration with traditional hospitality.
Femmøller Airbnb Room Capacity Analysis (2026): Bedroom Distribution
Distribution of Listings by Number of Bedrooms
Room Capacity Insights for Femmøller
- The dominant room capacity in Femmøller is 3 bedrooms listings, making up 37.5% of the market. This suggests a strong demand for properties suitable for families or small groups.
- Together, 3 bedrooms and 2 bedrooms properties represent 62.5% of the active Airbnb listings in Femmøller, indicating a high concentration in these sizes.
- A significant 54.2% of listings offer 3+ bedrooms, catering to larger groups and families seeking more space in Femmøller.
Femmøller Vacation Rental Guest Capacity Trends (2026)
Distribution of Listings by Guest Capacity
Guest Capacity Insights for Femmøller
- The most common guest capacity trend in Femmøller vacation rentals is listings accommodating 4 guests (29.2%). This suggests the primary traveler segment is likely small families or groups.
- Properties designed for 4 guests and 6 guests dominate the Femmøller STR market, accounting for 54.2% of listings.
- 45.9% of properties accommodate 6+ guests, serving the market segment for larger families or group travel in Femmøller.
- On average, properties in Femmøller are equipped to host 4.7 guests.
Femmøller Airbnb Booking Patterns (2026): Available vs. Booked Days
Available Days Distribution
Booked Days Distribution
Booking Pattern Insights for Femmøller
- The most common availability pattern in Femmøller falls within the 271-366 days range, representing 58.3% of listings. This suggests many properties have significant open periods on their calendars.
- Approximately 95.8% of listings show high availability (181+ days open annually), indicating potential for increased bookings or specific owner usage patterns.
- For booked days, the 91-180 days range is most frequent in Femmøller (37.5%), reflecting common guest stay durations or potential owner blocking patterns.
- A notable 4.2% of properties secure long booking periods (181+ days booked per year), highlighting successful long-term rental strategies or significant owner usage.
Femmøller Airbnb Minimum Stay Requirements Analysis
Distribution of Listings by Minimum Night Requirement
1 Night
5 listings
20.8% of total
2 Nights
1 listings
4.2% of total
4-6 Nights
8 listings
33.3% of total
7-29 Nights
2 listings
8.3% of total
30+ Nights
8 listings
33.3% of total
Key Insights
- The most prevalent minimum stay requirement in Femmøller is 4-6 Nights, adopted by 33.3% of listings. This highlights the market's preference for longer commitments.
- A significant segment (33.3%) caters to monthly stays (30+ nights) in Femmøller, pointing to opportunities in the extended-stay market.
Recommendations
- Align with the market by considering a 4-6 Nights minimum stay, as 33.3% of Femmøller hosts use this setting.
- If feasible, allowing 1-night stays, especially midweek or during low season, could capture last-minute bookings, as only 20.8% currently do.
- Explore offering discounts for stays of 30+ nights to attract the 33.3% of the market seeking extended stays.
- Adjust minimum nights based on seasonality – potentially shorter during low season and longer during peak demand periods in Femmøller.
Femmøller Airbnb Cancellation Policy Trends Analysis (2026)
Super Strict 30 Days
1 listings
4.2% of total
Super Strict 60 Days
2 listings
8.3% of total
Flexible
3 listings
12.5% of total
Moderate
7 listings
29.2% of total
Firm
10 listings
41.7% of total
Strict
1 listings
4.2% of total
Cancellation Policy Insights for Femmøller
- The prevailing Airbnb cancellation policy trend in Femmøller is Firm, used by 41.7% of listings.
- There's a relatively balanced mix between guest-friendly (41.7%) and stricter (45.9%) policies, offering choices for different guest needs.
- Strict cancellation policies are quite rare (4.2%), potentially making listings with this policy less competitive unless justified by high demand or property type.
Recommendations for Hosts
- Consider adopting a Firm policy to align with the 41.7% market standard in Femmøller.
- Using a Strict policy might deter some guests, as only 4.2% of listings use it. Evaluate if potential revenue protection outweighs possible lower booking rates.
- Regularly review your cancellation policy against competitors and market demand shifts in Femmøller.
Femmøller STR Booking Lead Time Analysis (2026)
Average Booking Lead Time by Month
Booking Lead Time Insights for Femmøller
- The overall average booking lead time for vacation rentals in Femmøller is 63 days.
- Guests book furthest in advance for stays during December (average 99 days), likely coinciding with peak travel demand or local events.
- The shortest booking windows occur for stays in November (average 17 days), indicating more last-minute travel plans during this time.
- Seasonally, Spring (71 days avg.) sees the longest lead times, while Fall (53 days avg.) has the shortest, reflecting typical travel planning cycles.
Recommendations for Hosts
- Use the overall average lead time (63 days) as a baseline for your pricing and availability strategy in Femmøller.
- For December stays, consider implementing length-of-stay discounts or slightly higher rates for bookings made less than 99 days out to capitalize on advance planning.
- Target marketing efforts for the Spring season well in advance (at least 71 days) to capture early planners.
- Monitor your own booking lead times against these Femmøller averages to identify opportunities for dynamic pricing adjustments.
Popular & Essential Airbnb Amenities in Femmøller (2026)
Amenity Prevalence
Amenity Insights for Femmøller
- Essential amenities in Femmøller that guests expect include: Heating, Wifi. Lacking these (any) could significantly impact bookings.
- Popular amenities like Kitchen, Refrigerator, Dishes and silverware are common but not universal. Offering these can provide a competitive edge.
Recommendations for Hosts
- Ensure your listing includes all essential amenities for Femmøller: Heating, Wifi.
- Prioritize adding missing essentials: Heating, Wifi.
- Consider adding popular differentiators like Kitchen or Refrigerator to increase appeal.
- Highlight unique or less common amenities you offer (e.g., hot tub, dedicated workspace, EV charger) in your listing description and photos.
- Regularly check competitor amenities in Femmøller to stay competitive.
Femmøller Airbnb Guest Demographics & Profile Analysis (2026)
Guest Profile Summary for Femmøller
- The typical guest profile for Airbnb in Femmøller consists of a mix of domestic (62%) and international guests, often arriving from nearby Copenhagen, typically belonging to the Post-2000s (Gen Z/Alpha) group (50%), primarily speaking English or Danish.
- Domestic travelers account for 61.8% of guests.
- Key international markets include Denmark (61.8%) and Germany (13.2%).
- Top languages spoken are English (36%) followed by Danish (22.5%).
- A significant demographic segment is the Post-2000s (Gen Z/Alpha) group, representing 50% of guests.
Recommendations for Hosts
- Target domestic marketing efforts towards travelers from Copenhagen and Aarhus.
- Tailor amenities and listing descriptions to appeal to the dominant Post-2000s (Gen Z/Alpha) demographic (e.g., highlight fast WiFi, smart home features, local guides).
- Highlight unique local experiences or amenities relevant to the primary guest profile.
- Consider seasonal promotions aligned with peak travel times for key origin markets.
Nearby Short-Term Rental Market Comparison
How does the Femmøller Airbnb market stack up against its neighbors? Compare key performance metrics like average monthly revenue, ADR, and occupancy rates in surrounding areas to understand the broader regional STR landscape.
| Market | Active Properties | Monthly Revenue | Daily Rate | Avg. Occupancy |
|---|---|---|---|---|
| Lohals | 20 | $2,866 | $331.99 | 40% |
| Øster Knasborg | 17 | $2,243 | $385.06 | 39% |
| Rude Strand | 27 | $2,198 | $254.15 | 41% |
| Korshavn | 14 | $2,192 | $244.24 | 41% |
| Tørresø Strand | 26 | $2,145 | $235.54 | 42% |
| Billund | 105 | $2,027 | $194.14 | 46% |
| Stillinge Strand | 22 | $1,853 | $228.00 | 36% |
| Sunds | 18 | $1,845 | $229.08 | 43% |
| Troense | 15 | $1,844 | $186.12 | 44% |
| Odder Municipality | 36 | $1,840 | $167.00 | 45% |