Kastrup Airbnb Market Analysis 2026: Short Term Rental Data & Vacation Rental Statistics in Capital Region of Denmark, Denmark
Is Airbnb profitable in Kastrup in 2026? Explore comprehensive Airbnb analytics for Kastrup, Capital Region of Denmark, Denmark to uncover income potential. This 2026 STR market report for Kastrup, based on AirROI data from February 2025 to January 2026, reveals key trends in the niche market of 93 active listings.
Whether you're considering an Airbnb investment in Kastrup, optimizing your existing vacation rental, or exploring rental arbitrage opportunities, understanding the Kastrup Airbnb data is crucial. Leveraging the low regulation environment is key to maximizing your short term rental income potential. Let's dive into the specifics.
Key Kastrup Airbnb Performance Metrics Overview
Monthly Airbnb Revenue Variations & Income Potential in Kastrup (2026)
Understanding the monthly revenue variations for Airbnb listings in Kastrup is key to maximizing your short term rental income potential. Seasonality significantly impacts earnings. Our analysis, based on data from the past 12 months, shows that the peak revenue month for STRs in Kastrup is typically August, while January often presents the lowest earnings, highlighting opportunities for strategic pricing adjustments during shoulder and low seasons. Explore the typical Airbnb income in Kastrup across different performance tiers:
- Best-in-class properties (Top 10%) achieve $5,881+ monthly, often utilizing dynamic pricing and superior guest experiences.
- Strong performing properties (Top 25%) earn $3,415 or more, indicating effective management and desirable locations/amenities.
- Typical properties (Median) generate around $2,047 per month, representing the average market performance.
- Entry-level properties (Bottom 25%) see earnings around $1,335, often with potential for optimization.
Average Monthly Airbnb Earnings Trend in Kastrup
Kastrup Airbnb Occupancy Rate Trends (2026)
Maximize your bookings by understanding the Kastrup STR occupancy trends. Seasonal demand shifts significantly influence how often properties are booked. Typically, Augustsees the highest demand (peak season occupancy), while January experiences the lowest (low season). Effective strategies, like adjusting minimum stays or offering promotions, can boost occupancy during slower periods. Here's how different property tiers perform in Kastrup:
- Best-in-class properties (Top 10%) achieve 88%+ occupancy, indicating high desirability and potentially optimized availability.
- Strong performing properties (Top 25%) maintain 73% or higher occupancy, suggesting good market fit and guest satisfaction.
- Typical properties (Median) have an occupancy rate around 53%.
- Entry-level properties (Bottom 25%) average 29% occupancy, potentially facing higher vacancy.
Average Monthly Occupancy Rate Trend in Kastrup
Average Daily Rate (ADR) Airbnb Trends in Kastrup (2026)
Effective short term rental pricing strategy in Kastrup involves understanding monthly ADR fluctuations. The Average Daily Rate (ADR) for Airbnb in Kastrup typically peaks in September and dips lowest during March. Leveraging Airbnb dynamic pricing tools or strategies based on this seasonality can significantly boost revenue. Here's a look at the typical nightly rates achieved:
- Best-in-class properties (Top 10%) command rates of $303+ per night, often due to premium features or locations.
- Strong performing properties (Top 25%) achieve nightly rates of $223 or more.
- Typical properties (Median) charge around $151 per night.
- Entry-level properties (Bottom 25%) earn around $101 per night.
Average Daily Rate (ADR) Trend by Month in Kastrup
Get Live Kastrup Market Intelligence 👇

Explore Real-time Analytics
Airbnb Seasonality Analysis & Trends in Kastrup (2026)
Peak Season (August, July, June)
- Revenue averages $4,155 per month
- Occupancy rates average 66.8%
- Daily rates average $187
Shoulder Season
- Revenue averages $2,825 per month
- Occupancy maintains around 51.8%
- Daily rates hold near $181
Low Season (January, February, March)
- Revenue drops to average $1,544 per month
- Occupancy decreases to average 35.7%
- Daily rates adjust to average $174
Seasonality Insights for Kastrup
- The Airbnb seasonality in Kastrup shows highly seasonal trends requiring careful strategy. While the sections above show seasonal averages, it's also insightful to look at the extremes:
- During the high season, the absolute peak month showcases Kastrup's highest earning potential, with monthly revenues capable of climbing to $4,646, occupancy reaching a high of 73.1%, and ADRs peaking at $193.
- Conversely, the slowest single month of the year, typically falling within the low season, marks the market's lowest point. In this month, revenue might dip to $1,371, occupancy could drop to 23.2%, and ADRs may adjust down to $171.
- Understanding both the seasonal averages and these monthly peaks and troughs in revenue, occupancy, and ADR is crucial for maximizing your Airbnb profit potential in Kastrup.
Seasonal Strategies for Maximizing Profit
- Peak Season: Maximize revenue through premium pricing and potentially longer minimum stays. Ensure high availability.
- Low Season: Offer competitive pricing, special promotions (e.g., extended stay discounts), and flexible cancellation policies. Target off-season travelers like remote workers or budget-conscious guests.
- Shoulder Seasons: Implement dynamic pricing that balances peak and low rates. Target weekend travelers or specific events. Offer slightly more flexible terms than peak season.
- Regularly analyze your own performance against these Kastrup seasonality benchmarks and adjust your pricing and availability strategy accordingly.
Best Areas for Airbnb Investment in Kastrup (2026)
Exploring the top neighborhoods for short-term rentals in Kastrup? This section highlights key areas, outlining why they are attractive for hosts and guests, along with notable local attractions. Consider these locations based on your target guest profile and investment strategy.
| Neighborhood / Area | Why Host Here? (Target Guests & Appeal) | Key Attractions & Landmarks |
|---|---|---|
| Kastrup Strandpark | Beautiful waterfront area ideal for leisure and recreation, attracting guests who enjoy nature and outdoor activities. Close to the beach and scenic walking paths. | Kastrup Strandpark Beach, Nature Park Amager, Tårnlegepladsen, Kastrup Fort, Kastrup Sea Bath |
| Amager Beach | Popular beach destination for both locals and tourists, known for its long sandy beach and vibrant atmosphere. Great for summer visitors looking for sun and sea activities. | Amager Beach Park, Bistro Bølgerne, Volleyball courts, Cycling paths, Beach bar |
| Kastrup Airport Area | Strategic location for travelers due to proximity to Copenhagen Airport. Ideal for short-term stays and business travelers in transit. | Copenhagen Airport, Sky Bar at the Airport, Shopping malls near the airport |
| Kastrup Town | Charming residential area with local shops, cafes, and a sense of community. Offers a more local experience for visitors wanting to explore Danish culture. | Kastrup Church, Local cafes, Shopping streets |
| Amagerbro | A lively neighborhood with numerous dining and nightlife options. Attractive for those who want urban convenience while being close to the beach. | Restaurants and bars, Copenhagen Street Food, Amagerbrogade shopping street |
| Bella Center | A business district that hosts many international conferences and events. Popular among business travelers needing convenient accommodation. | Bella Center, Royal Arena, Busines venues |
| Dragør | Picturesque seaside town with historic buildings and charming harbors. Great for guests looking for a quaint, tranquil experience. | Dragør Old Town, Dragør Marina, Kastrup Fort |
| Copenhagen City Connection | Close to Kastrup, with easy access to Copenhagen's main attractions. Great for tourists wanting to explore the city while having quiet accommodation. | Tivoli Gardens, Strøget shopping street, Copenhagen Opera House, Nyhavn |
Understanding Airbnb License Requirements & STR Laws in Kastrup (2026)
While Kastrup, Capital Region of Denmark, Denmark currently shows low STR regulations, specific Airbnb license requirements might still exist or change. Always verify the latest short term rental regulations and Airbnb license requirements directly with local government authorities for Kastrup to ensure full compliance before hosting.
(Source: AirROI data, 2026, finding no licensed listings among those analyzed)
Top Performing Airbnb Properties in Kastrup (2026)
Benchmark your potential! Explore examples of top-performing Airbnb properties in Kastrupbased on Trailing Twelve Month (TTM) revenue. Analyze their characteristics, revenue, occupancy rate, and ADR to understand what drives success in this market.

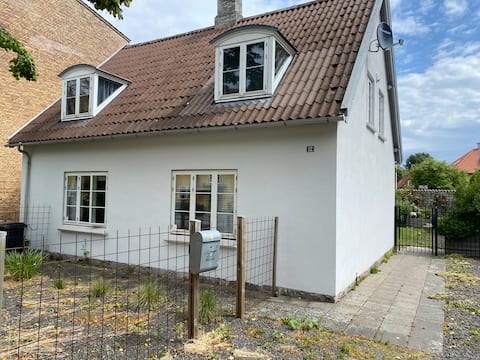
Big family villa, close to city and CPH airport
Entire Place • 5 bedrooms
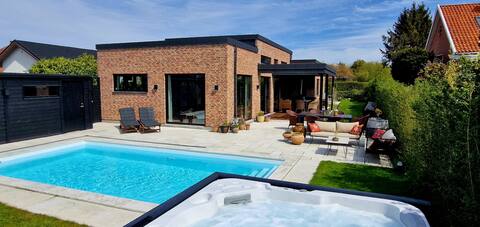
Magnificent villa with pool
Entire Place • 4 bedrooms
New - near Metro in Copenhagen - 16 sleep
Entire Place • 7 bedrooms

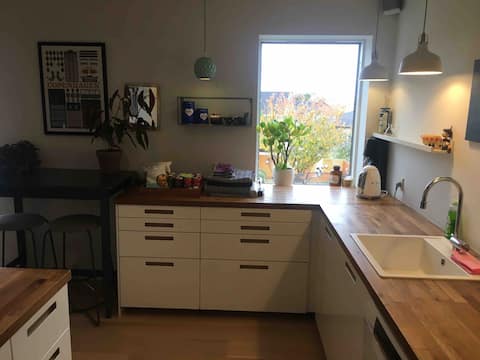
Cozy apartment, great location, private terrace
Entire Place • 2 bedrooms
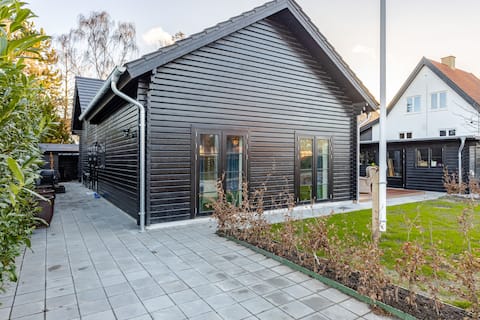
Cosy central house, 5min to airport, 100m to train
Entire Place • 3 bedrooms
Apartment - Near airport,metro,city and the beach.
Entire Place • 3 bedrooms
Note: Performance varies based on location, size, amenities, seasonality, and management quality. Data reflects the past 12 months.
Top Performing Airbnb Hosts in Kastrup (2026)
Learn from the best! This table showcases top-performing Airbnb hosts in Kastrup based on the number of properties managed and estimated total revenue over the past year. Analyze their scale and performance metrics.
| Host Name | Properties | Grossing Revenue | Stay Reviews | Avg Rating |
|---|---|---|---|---|
| Mads | 4 | $199,052 | 712 | 4.89/5.0 |
| Chaudhry. S. S. | 6 | $115,733 | 1806 | 4.73/5.0 |
| Peter And Pia | 1 | $106,031 | 24 | 5.00/5.0 |
| Per Nørgaard | 1 | $99,494 | 20 | 4.95/5.0 |
| Alexandra | 2 | $81,072 | 96 | 4.84/5.0 |
| Thomas | 1 | $51,722 | 4 | 4.75/5.0 |
| Sandra | 1 | $48,155 | 40 | 4.85/5.0 |
| Jeanette & Peter | 2 | $45,343 | 516 | 4.96/5.0 |
| Christine | 1 | $45,016 | 6 | 5.00/5.0 |
| Ellie | 1 | $44,314 | 10 | 4.80/5.0 |
Analyzing the strategies of top hosts, such as their property selection, pricing, and guest communication, can offer valuable lessons for optimizing your own Airbnb operations in Kastrup.
Dive Deeper: Advanced Kastrup STR Market Data (2026)
Ready to unlock more insights? AirROI provides access to advanced metrics and comprehensive Airbnb data for Kastrup. Explore detailed analytics beyond this report to refine your investment strategy, optimize pricing, and maximize your vacation rental profits.
Explore Advanced MetricsKastrup Short-Term Rental Market Composition (2026): Property & Room Types
Room Type Distribution
Property Type Distribution
Market Composition Insights for Kastrup
- The Kastrup Airbnb market composition is heavily skewed towards Entire Home/Apt listings, which make up 65.6% of the 93 active rentals. This indicates strong guest preference for privacy and space.
- However, a notable 34.4% share for Private Rooms suggests opportunities for budget-conscious travelers or hosts renting out spare rooms.
- Looking at the property type distribution in Kastrup, House properties are the most common (61.3%), reflecting the local real estate landscape.
- Houses represent a significant 61.3% portion, catering likely to families or larger groups.
- The presence of 5.4% Hotel/Boutique listings indicates integration with traditional hospitality.
- Smaller segments like unique stays, outdoor/unique (combined 2.2%) offer potential for unique stay experiences.
Kastrup Airbnb Room Capacity Analysis (2026): Bedroom Distribution
Distribution of Listings by Number of Bedrooms
Room Capacity Insights for Kastrup
- The dominant room capacity in Kastrup is 1 bedroom listings, making up 22.6% of the market. This suggests a strong demand for properties suitable for couples or solo travelers.
- Together, 1 bedroom and 3 bedrooms properties represent 40.9% of the active Airbnb listings in Kastrup, indicating a high concentration in these sizes.
- A significant 28.0% of listings offer 3+ bedrooms, catering to larger groups and families seeking more space in Kastrup.
Kastrup Vacation Rental Guest Capacity Trends (2026)
Distribution of Listings by Guest Capacity
Guest Capacity Insights for Kastrup
- The most common guest capacity trend in Kastrup vacation rentals is listings accommodating 4 guests (16.1%). This suggests the primary traveler segment is likely small families or groups.
- Properties designed for 4 guests and 5 guests dominate the Kastrup STR market, accounting for 31.2% of listings.
- 19.4% of properties accommodate 6+ guests, serving the market segment for larger families or group travel in Kastrup.
- On average, properties in Kastrup are equipped to host 3.0 guests.
Kastrup Airbnb Booking Patterns (2026): Available vs. Booked Days
Available Days Distribution
Booked Days Distribution
Booking Pattern Insights for Kastrup
- The most common availability pattern in Kastrup falls within the 181-270 days range, representing 36.6% of listings. This suggests many properties have significant open periods on their calendars.
- Approximately 72.1% of listings show high availability (181+ days open annually), indicating potential for increased bookings or specific owner usage patterns.
- For booked days, the 91-180 days range is most frequent in Kastrup (35.5%), reflecting common guest stay durations or potential owner blocking patterns.
- A notable 30.1% of properties secure long booking periods (181+ days booked per year), highlighting successful long-term rental strategies or significant owner usage.
Kastrup Airbnb Minimum Stay Requirements Analysis
Distribution of Listings by Minimum Night Requirement
1 Night
26 listings
28% of total
2 Nights
14 listings
15.1% of total
3 Nights
9 listings
9.7% of total
4-6 Nights
14 listings
15.1% of total
7-29 Nights
5 listings
5.4% of total
30+ Nights
25 listings
26.9% of total
Key Insights
- The most prevalent minimum stay requirement in Kastrup is 1 Night, adopted by 28% of listings. This highlights the market's preference for shorter, flexible bookings.
- A significant segment (26.9%) caters to monthly stays (30+ nights) in Kastrup, pointing to opportunities in the extended-stay market.
Recommendations
- Align with the market by considering a 1 Night minimum stay, as 28% of Kastrup hosts use this setting.
- If feasible, allowing 1-night stays, especially midweek or during low season, could capture last-minute bookings, as only 28% currently do.
- Explore offering discounts for stays of 30+ nights to attract the 26.9% of the market seeking extended stays.
- Adjust minimum nights based on seasonality – potentially shorter during low season and longer during peak demand periods in Kastrup.
Kastrup Airbnb Cancellation Policy Trends Analysis (2026)
Flexible
34 listings
36.6% of total
Moderate
28 listings
30.1% of total
Firm
20 listings
21.5% of total
Strict
11 listings
11.8% of total
Cancellation Policy Insights for Kastrup
- The prevailing Airbnb cancellation policy trend in Kastrup is Flexible, used by 36.6% of listings.
- There's a relatively balanced mix between guest-friendly (66.7%) and stricter (33.3%) policies, offering choices for different guest needs.
Recommendations for Hosts
- Consider adopting a Flexible policy to align with the 36.6% market standard in Kastrup.
- Using a Strict policy might deter some guests, as only 11.8% of listings use it. Evaluate if potential revenue protection outweighs possible lower booking rates.
- Regularly review your cancellation policy against competitors and market demand shifts in Kastrup.
Kastrup STR Booking Lead Time Analysis (2026)
Average Booking Lead Time by Month
Booking Lead Time Insights for Kastrup
- The overall average booking lead time for vacation rentals in Kastrup is 73 days.
- Guests book furthest in advance for stays during August (average 108 days), likely coinciding with peak travel demand or local events.
- The shortest booking windows occur for stays in February (average 44 days), indicating more last-minute travel plans during this time.
- Seasonally, Summer (88 days avg.) sees the longest lead times, while Winter (54 days avg.) has the shortest, reflecting typical travel planning cycles.
Recommendations for Hosts
- Use the overall average lead time (73 days) as a baseline for your pricing and availability strategy in Kastrup.
- For August stays, consider implementing length-of-stay discounts or slightly higher rates for bookings made less than 108 days out to capitalize on advance planning.
- Target marketing efforts for the Summer season well in advance (at least 88 days) to capture early planners.
- Monitor your own booking lead times against these Kastrup averages to identify opportunities for dynamic pricing adjustments.
Popular & Essential Airbnb Amenities in Kastrup (2026)
Amenity Prevalence
Amenity Insights for Kastrup
- Essential amenities in Kastrup that guests expect include: Wifi. Lacking these (this) could significantly impact bookings.
- Popular amenities like Kitchen, Heating, Dishes and silverware are common but not universal. Offering these can provide a competitive edge.
Recommendations for Hosts
- Ensure your listing includes all essential amenities for Kastrup: Wifi.
- Prioritize adding missing essentials: Wifi.
- Consider adding popular differentiators like Kitchen or Heating to increase appeal.
- Highlight unique or less common amenities you offer (e.g., hot tub, dedicated workspace, EV charger) in your listing description and photos.
- Regularly check competitor amenities in Kastrup to stay competitive.
Kastrup Airbnb Guest Demographics & Profile Analysis (2026)
Guest Profile Summary for Kastrup
- The typical guest profile for Airbnb in Kastrup consists of predominantly international visitors (92%), with top international origins including Germany, typically belonging to the Post-2000s (Gen Z/Alpha) group (50%), primarily speaking English or French.
- Domestic travelers account for 7.9% of guests.
- Key international markets include United States (20.1%) and Germany (12.3%).
- Top languages spoken are English (42.3%) followed by French (10.5%).
- A significant demographic segment is the Post-2000s (Gen Z/Alpha) group, representing 50% of guests.
Recommendations for Hosts
- Focus marketing internationally, particularly towards travelers from Germany.
- Tailor amenities and listing descriptions to appeal to the dominant Post-2000s (Gen Z/Alpha) demographic (e.g., highlight fast WiFi, smart home features, local guides).
- Highlight unique local experiences or amenities relevant to the primary guest profile.
- Consider seasonal promotions aligned with peak travel times for key origin markets.
Nearby Short-Term Rental Market Comparison
How does the Kastrup Airbnb market stack up against its neighbors? Compare key performance metrics like average monthly revenue, ADR, and occupancy rates in surrounding areas to understand the broader regional STR landscape.
| Market | Active Properties | Monthly Revenue | Daily Rate | Avg. Occupancy |
|---|---|---|---|---|
| Wittenbeck | 14 | $2,937 | $224.34 | 43% |
| Copenhagen | 9,111 | $2,347 | $222.94 | 52% |
| Råbylille Strand | 31 | $2,254 | $190.70 | 45% |
| Saunte | 10 | $2,212 | $213.23 | 46% |
| Perstorps kommun | 13 | $2,081 | $161.55 | 48% |
| Frederiksberg | 1,015 | $2,062 | $217.28 | 50% |
| Solrød Strand | 54 | $2,032 | $249.51 | 48% |
| Hellerup | 11 | $1,973 | $298.07 | 51% |
| Örkelljunga | 17 | $1,963 | $305.70 | 28% |
| Laröd | 12 | $1,923 | $329.50 | 38% |