Hornbæk Airbnb Market Analysis 2026: Short Term Rental Data & Vacation Rental Statistics in Capital Region of Denmark, Denmark
Is Airbnb profitable in Hornbæk in 2026? Explore comprehensive Airbnb analytics for Hornbæk, Capital Region of Denmark, Denmark to uncover income potential. This 2026 STR market report for Hornbæk, based on AirROI data from February 2025 to January 2026, reveals key trends in the niche market of 84 active listings.
Whether you're considering an Airbnb investment in Hornbæk, optimizing your existing vacation rental, or exploring rental arbitrage opportunities, understanding the Hornbæk Airbnb data is crucial. Leveraging the low regulation environment is key to maximizing your short term rental income potential. Let's dive into the specifics.
Key Hornbæk Airbnb Performance Metrics Overview
Monthly Airbnb Revenue Variations & Income Potential in Hornbæk (2026)
Understanding the monthly revenue variations for Airbnb listings in Hornbæk is key to maximizing your short term rental income potential. Seasonality significantly impacts earnings. Our analysis, based on data from the past 12 months, shows that the peak revenue month for STRs in Hornbæk is typically July, while January often presents the lowest earnings, highlighting opportunities for strategic pricing adjustments during shoulder and low seasons. Explore the typical Airbnb income in Hornbæk across different performance tiers:
- Best-in-class properties (Top 10%) achieve $6,419+ monthly, often utilizing dynamic pricing and superior guest experiences.
- Strong performing properties (Top 25%) earn $3,691 or more, indicating effective management and desirable locations/amenities.
- Typical properties (Median) generate around $1,875 per month, representing the average market performance.
- Entry-level properties (Bottom 25%) see earnings around $837, often with potential for optimization.
Average Monthly Airbnb Earnings Trend in Hornbæk
Hornbæk Airbnb Occupancy Rate Trends (2026)
Maximize your bookings by understanding the Hornbæk STR occupancy trends. Seasonal demand shifts significantly influence how often properties are booked. Typically, Julysees the highest demand (peak season occupancy), while January experiences the lowest (low season). Effective strategies, like adjusting minimum stays or offering promotions, can boost occupancy during slower periods. Here's how different property tiers perform in Hornbæk:
- Best-in-class properties (Top 10%) achieve 68%+ occupancy, indicating high desirability and potentially optimized availability.
- Strong performing properties (Top 25%) maintain 49% or higher occupancy, suggesting good market fit and guest satisfaction.
- Typical properties (Median) have an occupancy rate around 31%.
- Entry-level properties (Bottom 25%) average 16% occupancy, potentially facing higher vacancy.
Average Monthly Occupancy Rate Trend in Hornbæk
Average Daily Rate (ADR) Airbnb Trends in Hornbæk (2026)
Effective short term rental pricing strategy in Hornbæk involves understanding monthly ADR fluctuations. The Average Daily Rate (ADR) for Airbnb in Hornbæk typically peaks in September and dips lowest during February. Leveraging Airbnb dynamic pricing tools or strategies based on this seasonality can significantly boost revenue. Here's a look at the typical nightly rates achieved:
- Best-in-class properties (Top 10%) command rates of $442+ per night, often due to premium features or locations.
- Strong performing properties (Top 25%) achieve nightly rates of $313 or more.
- Typical properties (Median) charge around $220 per night.
- Entry-level properties (Bottom 25%) earn around $153 per night.
Average Daily Rate (ADR) Trend by Month in Hornbæk
Get Live Hornbæk Market Intelligence 👇

Explore Real-time Analytics
Airbnb Seasonality Analysis & Trends in Hornbæk (2026)
Peak Season (July, August, June)
- Revenue averages $4,363 per month
- Occupancy rates average 55.4%
- Daily rates average $254
Shoulder Season
- Revenue averages $2,357 per month
- Occupancy maintains around 28.8%
- Daily rates hold near $250
Low Season (January, April, May)
- Revenue drops to average $1,754 per month
- Occupancy decreases to average 25.8%
- Daily rates adjust to average $246
Seasonality Insights for Hornbæk
- The Airbnb seasonality in Hornbæk shows highly seasonal trends requiring careful strategy. While the sections above show seasonal averages, it's also insightful to look at the extremes:
- During the high season, the absolute peak month showcases Hornbæk's highest earning potential, with monthly revenues capable of climbing to $4,966, occupancy reaching a high of 62.5%, and ADRs peaking at $261.
- Conversely, the slowest single month of the year, typically falling within the low season, marks the market's lowest point. In this month, revenue might dip to $1,282, occupancy could drop to 16.8%, and ADRs may adjust down to $233.
- Understanding both the seasonal averages and these monthly peaks and troughs in revenue, occupancy, and ADR is crucial for maximizing your Airbnb profit potential in Hornbæk.
Seasonal Strategies for Maximizing Profit
- Peak Season: Maximize revenue through premium pricing and potentially longer minimum stays. Ensure high availability.
- Low Season: Offer competitive pricing, special promotions (e.g., extended stay discounts), and flexible cancellation policies. Target off-season travelers like remote workers or budget-conscious guests.
- Shoulder Seasons: Implement dynamic pricing that balances peak and low rates. Target weekend travelers or specific events. Offer slightly more flexible terms than peak season.
- Regularly analyze your own performance against these Hornbæk seasonality benchmarks and adjust your pricing and availability strategy accordingly.
Best Areas for Airbnb Investment in Hornbæk (2026)
Exploring the top neighborhoods for short-term rentals in Hornbæk? This section highlights key areas, outlining why they are attractive for hosts and guests, along with notable local attractions. Consider these locations based on your target guest profile and investment strategy.
| Neighborhood / Area | Why Host Here? (Target Guests & Appeal) | Key Attractions & Landmarks |
|---|---|---|
| Hornbæk Beach | A beautiful sandy beach area popular with families and tourists in the summer. The beach offers a relaxing environment and fantastic views of the sea, making it ideal for beach lovers and water sports enthusiasts. | Hornbæk Beach, Hornbæk Harbour, The Bathtub, Hornbæk Strand, Helsingør, Kronborg Castle |
| Hornbæk Town Center | Charming town center with boutique shops, cafés, and restaurants. Offers a lively atmosphere and is close to many local attractions, perfect for guests looking to experience local culture. | Local boutiques, Cafés and restaurants, Hornbæk Church, Gallery A, Bakeries |
| Nordstrand | A tranquil area known for its picturesque dunes and nature. Ideal for visitors seeking peace and relaxation away from the hustle and bustle of the main tourist spots. | Nordstrand Beach, Dune hiking trails, Nature reserve, Birdwatching spots |
| Hornbæk Rådhus | Historic town hall area that showcases the charming architecture of Hornbæk. It is popular for hosting events and is centrally located, attracting visitors looking for history and culture. | Hornbæk Town Hall, Cultural events, Nearby parks |
| Nature Park | Surrounding nature park areas that offer hiking trails and scenic views. Great for outdoor enthusiasts who want to explore the natural beauty of the region. | Hiking trails, Scenic viewpoints, Wildlife watching |
| Marina Area | A scenic marina area popular for boating and water activities. Offers a vibrant waterfront atmosphere with seafood restaurants and easy access to water sports. | Marina activities, Boating, Waterfront restaurants |
| Hornbæk Lighthouse | An iconic landmark of the region, offering panoramic views of the coastline. It attracts visitors interested in photography and history, making it a unique Airbnb spot. | Hornbæk Lighthouse, Photography spots, Historical significance |
| Café and Arts District | An area known for its artistic community, filled with galleries and cafes. It draws in visitors who appreciate arts and culture, perfect for creative-minded guests. | Art galleries, Cafés, Artisan shops, Cultural events |
Understanding Airbnb License Requirements & STR Laws in Hornbæk (2026)
While Hornbæk, Capital Region of Denmark, Denmark currently shows low STR regulations, specific Airbnb license requirements might still exist or change. Always verify the latest short term rental regulations and Airbnb license requirements directly with local government authorities for Hornbæk to ensure full compliance before hosting.
(Source: AirROI data, 2026, finding no licensed listings among those analyzed)
Top Performing Airbnb Properties in Hornbæk (2026)
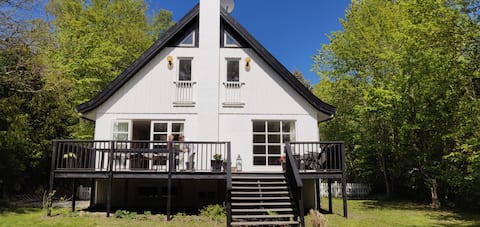
Benchmark your potential! Explore examples of top-performing Airbnb properties in Hornbækbased on Trailing Twelve Month (TTM) revenue. Analyze their characteristics, revenue, occupancy rate, and ADR to understand what drives success in this market.
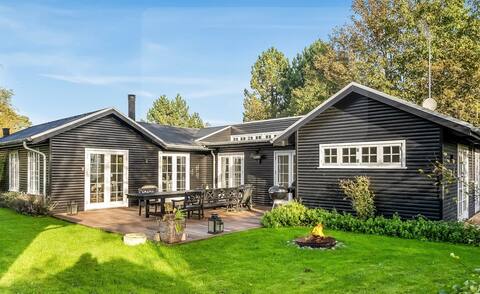
Beautiful and big Summerhouse with Sauna
Entire Place • 5 bedrooms
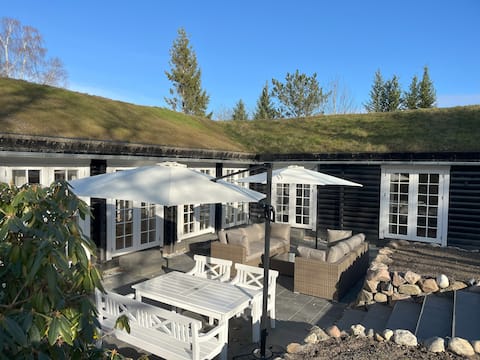
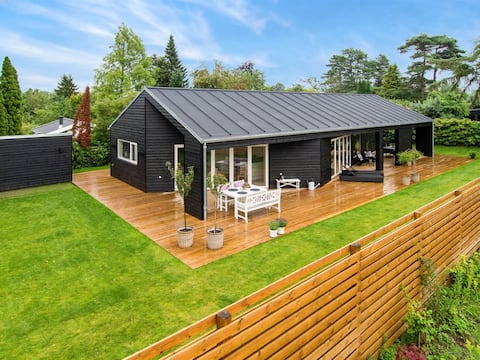
Grass-roof villa and outdoor spa
Entire Place • 6 bedrooms
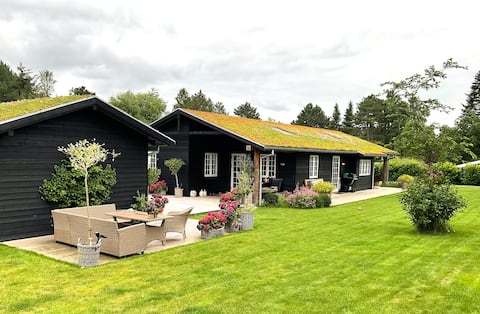
Atmospheric luxury cottage
Entire Place • 3 bedrooms
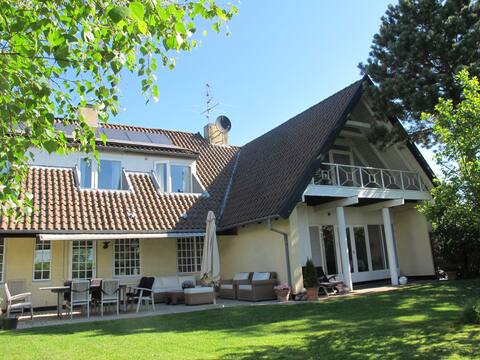
Beautifull Villa by Hornbaek Lake and Beach
Entire Place • 3 bedrooms
Beautiful Villa 300 m from Hornbæk Beach
Entire Place • 3 bedrooms
"Dorthie" - 800m from the sea by Interhome
Entire Place • 4 bedrooms
Note: Performance varies based on location, size, amenities, seasonality, and management quality. Data reflects the past 12 months.
Top Performing Airbnb Hosts in Hornbæk (2026)
Learn from the best! This table showcases top-performing Airbnb hosts in Hornbæk based on the number of properties managed and estimated total revenue over the past year. Analyze their scale and performance metrics.
| Host Name | Properties | Grossing Revenue | Stay Reviews | Avg Rating |
|---|---|---|---|---|
| Svend | 1 | $101,743 | 18 | 5.00/5.0 |
| Sofie | 1 | $68,693 | 20 | 5.00/5.0 |
| Carsten | 2 | $55,732 | 57 | 4.80/5.0 |
| Louise | 1 | $54,643 | 2 | Not Rated |
| Campaya | 3 | $54,193 | 4 | Not Rated |
| Claus | 1 | $47,103 | 134 | 4.82/5.0 |
| Annika - Interhome | 1 | $45,661 | 1 | Not Rated |
| Karin | 1 | $41,781 | 5 | 5.00/5.0 |
| Karoline | 1 | $40,424 | 31 | 5.00/5.0 |
| Kirsa & Jørgen | 1 | $38,835 | 149 | 4.87/5.0 |
Analyzing the strategies of top hosts, such as their property selection, pricing, and guest communication, can offer valuable lessons for optimizing your own Airbnb operations in Hornbæk.
Dive Deeper: Advanced Hornbæk STR Market Data (2026)
Ready to unlock more insights? AirROI provides access to advanced metrics and comprehensive Airbnb data for Hornbæk. Explore detailed analytics beyond this report to refine your investment strategy, optimize pricing, and maximize your vacation rental profits.
Explore Advanced MetricsHornbæk Short-Term Rental Market Composition (2026): Property & Room Types
Room Type Distribution
Property Type Distribution
Market Composition Insights for Hornbæk
- The Hornbæk Airbnb market composition is heavily skewed towards Entire Home/Apt listings, which make up 95.2% of the 84 active rentals. This indicates strong guest preference for privacy and space.
- Looking at the property type distribution in Hornbæk, House properties are the most common (71.4%), reflecting the local real estate landscape.
- Houses represent a significant 71.4% portion, catering likely to families or larger groups.
- The presence of 15.5% Hotel/Boutique listings indicates integration with traditional hospitality.
- Smaller segments like others, apartment/condo (combined 6.0%) offer potential for unique stay experiences.
Hornbæk Airbnb Room Capacity Analysis (2026): Bedroom Distribution
Distribution of Listings by Number of Bedrooms
Room Capacity Insights for Hornbæk
- The dominant room capacity in Hornbæk is 3 bedrooms listings, making up 31% of the market. This suggests a strong demand for properties suitable for families or small groups.
- Together, 3 bedrooms and 4 bedrooms properties represent 53.6% of the active Airbnb listings in Hornbæk, indicating a high concentration in these sizes.
- A significant 59.6% of listings offer 3+ bedrooms, catering to larger groups and families seeking more space in Hornbæk.
Hornbæk Vacation Rental Guest Capacity Trends (2026)
Distribution of Listings by Guest Capacity
Guest Capacity Insights for Hornbæk
- The most common guest capacity trend in Hornbæk vacation rentals is listings accommodating 8+ guests (26.2%). This suggests the primary traveler segment is likely larger groups.
- Properties designed for 8+ guests and 6 guests dominate the Hornbæk STR market, accounting for 48.8% of listings.
- 55.9% of properties accommodate 6+ guests, serving the market segment for larger families or group travel in Hornbæk.
- On average, properties in Hornbæk are equipped to host 5.3 guests.
Hornbæk Airbnb Booking Patterns (2026): Available vs. Booked Days
Available Days Distribution
Booked Days Distribution
Booking Pattern Insights for Hornbæk
- The most common availability pattern in Hornbæk falls within the 271-366 days range, representing 76.2% of listings. This suggests many properties have significant open periods on their calendars.
- Approximately 95.2% of listings show high availability (181+ days open annually), indicating potential for increased bookings or specific owner usage patterns.
- For booked days, the 31-90 days range is most frequent in Hornbæk (53.6%), reflecting common guest stay durations or potential owner blocking patterns.
- A notable 4.8% of properties secure long booking periods (181+ days booked per year), highlighting successful long-term rental strategies or significant owner usage.
Hornbæk Airbnb Minimum Stay Requirements Analysis
Distribution of Listings by Minimum Night Requirement
1 Night
6 listings
7.1% of total
2 Nights
7 listings
8.3% of total
3 Nights
8 listings
9.5% of total
4-6 Nights
30 listings
35.7% of total
7-29 Nights
8 listings
9.5% of total
30+ Nights
25 listings
29.8% of total
Key Insights
- The most prevalent minimum stay requirement in Hornbæk is 4-6 Nights, adopted by 35.7% of listings. This highlights the market's preference for longer commitments.
- Very short stays (1-2 nights) are less common (15.4%), suggesting hosts prefer slightly longer bookings to optimize turnover.
- A significant segment (29.8%) caters to monthly stays (30+ nights) in Hornbæk, pointing to opportunities in the extended-stay market.
Recommendations
- Align with the market by considering a 4-6 Nights minimum stay, as 35.7% of Hornbæk hosts use this setting.
- If feasible, allowing 1-night stays, especially midweek or during low season, could capture last-minute bookings, as only 7.1% currently do.
- Explore offering discounts for stays of 30+ nights to attract the 29.8% of the market seeking extended stays.
- Adjust minimum nights based on seasonality – potentially shorter during low season and longer during peak demand periods in Hornbæk.
Hornbæk Airbnb Cancellation Policy Trends Analysis (2026)
Super Strict 30 Days
1 listings
1.2% of total
Limited
1 listings
1.2% of total
Flexible
19 listings
22.6% of total
Moderate
26 listings
31% of total
Firm
28 listings
33.3% of total
Strict
9 listings
10.7% of total
Cancellation Policy Insights for Hornbæk
- The prevailing Airbnb cancellation policy trend in Hornbæk is Firm, used by 33.3% of listings.
- There's a relatively balanced mix between guest-friendly (53.6%) and stricter (44.0%) policies, offering choices for different guest needs.
Recommendations for Hosts
- Consider adopting a Firm policy to align with the 33.3% market standard in Hornbæk.
- Using a Strict policy might deter some guests, as only 10.7% of listings use it. Evaluate if potential revenue protection outweighs possible lower booking rates.
- Regularly review your cancellation policy against competitors and market demand shifts in Hornbæk.
Hornbæk STR Booking Lead Time Analysis (2026)
Average Booking Lead Time by Month
Booking Lead Time Insights for Hornbæk
- The overall average booking lead time for vacation rentals in Hornbæk is 61 days.
- Guests book furthest in advance for stays during July (average 87 days), likely coinciding with peak travel demand or local events.
- The shortest booking windows occur for stays in January (average 21 days), indicating more last-minute travel plans during this time.
- Seasonally, Summer (77 days avg.) sees the longest lead times, while Fall (30 days avg.) has the shortest, reflecting typical travel planning cycles.
Recommendations for Hosts
- Use the overall average lead time (61 days) as a baseline for your pricing and availability strategy in Hornbæk.
- For July stays, consider implementing length-of-stay discounts or slightly higher rates for bookings made less than 87 days out to capitalize on advance planning.
- Target marketing efforts for the Summer season well in advance (at least 77 days) to capture early planners.
- Monitor your own booking lead times against these Hornbæk averages to identify opportunities for dynamic pricing adjustments.
Popular & Essential Airbnb Amenities in Hornbæk (2026)
Amenity Prevalence
Amenity Insights for Hornbæk
- Essential amenities in Hornbæk that guests expect include: Free parking on premises, Wifi. Lacking these (any) could significantly impact bookings.
- Popular amenities like Kitchen, Heating, Hot water are common but not universal. Offering these can provide a competitive edge.
Recommendations for Hosts
- Ensure your listing includes all essential amenities for Hornbæk: Free parking on premises, Wifi.
- Prioritize adding missing essentials: Free parking on premises, Wifi.
- Consider adding popular differentiators like Kitchen or Heating to increase appeal.
- Highlight unique or less common amenities you offer (e.g., hot tub, dedicated workspace, EV charger) in your listing description and photos.
- Regularly check competitor amenities in Hornbæk to stay competitive.
Hornbæk Airbnb Guest Demographics & Profile Analysis (2026)
Guest Profile Summary for Hornbæk
- The typical guest profile for Airbnb in Hornbæk consists of predominantly international visitors (74%), with top international origins including Germany, typically belonging to the Post-2000s (Gen Z/Alpha) group (50%), primarily speaking English or German.
- Domestic travelers account for 26.5% of guests.
- Key international markets include Denmark (26.5%) and Germany (18.4%).
- Top languages spoken are English (39.9%) followed by German (15.3%).
- A significant demographic segment is the Post-2000s (Gen Z/Alpha) group, representing 50% of guests.
Recommendations for Hosts
- Focus marketing internationally, particularly towards travelers from Germany.
- Tailor amenities and listing descriptions to appeal to the dominant Post-2000s (Gen Z/Alpha) demographic (e.g., highlight fast WiFi, smart home features, local guides).
- Highlight unique local experiences or amenities relevant to the primary guest profile.
- Consider seasonal promotions aligned with peak travel times for key origin markets.
Nearby Short-Term Rental Market Comparison
How does the Hornbæk Airbnb market stack up against its neighbors? Compare key performance metrics like average monthly revenue, ADR, and occupancy rates in surrounding areas to understand the broader regional STR landscape.
| Market | Active Properties | Monthly Revenue | Daily Rate | Avg. Occupancy |
|---|---|---|---|---|
| Lerums kommun | 35 | $2,479 | $282.44 | 46% |
| Copenhagen | 9,111 | $2,347 | $222.94 | 52% |
| Saunte | 10 | $2,212 | $213.23 | 46% |
| Perstorps kommun | 13 | $2,081 | $161.55 | 48% |
| Frederiksberg | 1,015 | $2,062 | $217.28 | 50% |
| Solrød Strand | 54 | $2,032 | $249.51 | 48% |
| Trönningenäs | 19 | $2,022 | $283.00 | 46% |
| Hellerup | 11 | $1,973 | $298.07 | 51% |
| Örkelljunga | 17 | $1,963 | $305.70 | 28% |
| Hestra | 17 | $1,930 | $193.94 | 36% |