Holløse Airbnb Market Analysis 2026: Short Term Rental Data & Vacation Rental Statistics in Capital Region of Denmark, Denmark
Is Airbnb profitable in Holløse in 2026? Explore comprehensive Airbnb analytics for Holløse, Capital Region of Denmark, Denmark to uncover income potential. This 2026 STR market report for Holløse, based on AirROI data from February 2025 to January 2026, reveals key trends in the niche market of 18 active listings.
Whether you're considering an Airbnb investment in Holløse, optimizing your existing vacation rental, or exploring rental arbitrage opportunities, understanding the Holløse Airbnb data is crucial. Leveraging the low regulation environment is key to maximizing your short term rental income potential. Let's dive into the specifics.
Key Holløse Airbnb Performance Metrics Overview
Monthly Airbnb Revenue Variations & Income Potential in Holløse (2026)
Understanding the monthly revenue variations for Airbnb listings in Holløse is key to maximizing your short term rental income potential. Seasonality significantly impacts earnings. Our analysis, based on data from the past 12 months, shows that the peak revenue month for STRs in Holløse is typically July, while February often presents the lowest earnings, highlighting opportunities for strategic pricing adjustments during shoulder and low seasons. Explore the typical Airbnb income in Holløse across different performance tiers:
- Best-in-class properties (Top 10%) achieve $4,174+ monthly, often utilizing dynamic pricing and superior guest experiences.
- Strong performing properties (Top 25%) earn $2,805 or more, indicating effective management and desirable locations/amenities.
- Typical properties (Median) generate around $1,415 per month, representing the average market performance.
- Entry-level properties (Bottom 25%) see earnings around $705, often with potential for optimization.
Average Monthly Airbnb Earnings Trend in Holløse
Holløse Airbnb Occupancy Rate Trends (2026)
Maximize your bookings by understanding the Holløse STR occupancy trends. Seasonal demand shifts significantly influence how often properties are booked. Typically, Julysees the highest demand (peak season occupancy), while February experiences the lowest (low season). Effective strategies, like adjusting minimum stays or offering promotions, can boost occupancy during slower periods. Here's how different property tiers perform in Holløse:
- Best-in-class properties (Top 10%) achieve 63%+ occupancy, indicating high desirability and potentially optimized availability.
- Strong performing properties (Top 25%) maintain 45% or higher occupancy, suggesting good market fit and guest satisfaction.
- Typical properties (Median) have an occupancy rate around 23%.
- Entry-level properties (Bottom 25%) average 12% occupancy, potentially facing higher vacancy.
Average Monthly Occupancy Rate Trend in Holløse
Average Daily Rate (ADR) Airbnb Trends in Holløse (2026)
Effective short term rental pricing strategy in Holløse involves understanding monthly ADR fluctuations. The Average Daily Rate (ADR) for Airbnb in Holløse typically peaks in July and dips lowest during March. Leveraging Airbnb dynamic pricing tools or strategies based on this seasonality can significantly boost revenue. Here's a look at the typical nightly rates achieved:
- Best-in-class properties (Top 10%) command rates of $350+ per night, often due to premium features or locations.
- Strong performing properties (Top 25%) achieve nightly rates of $232 or more.
- Typical properties (Median) charge around $187 per night.
- Entry-level properties (Bottom 25%) earn around $153 per night.
Average Daily Rate (ADR) Trend by Month in Holløse
Get Live Holløse Market Intelligence 👇

Explore Real-time Analytics
Airbnb Seasonality Analysis & Trends in Holløse (2026)
Peak Season (July, August, October)
- Revenue averages $2,971 per month
- Occupancy rates average 45.5%
- Daily rates average $225
Shoulder Season
- Revenue averages $1,834 per month
- Occupancy maintains around 30.0%
- Daily rates hold near $219
Low Season (January, February, September)
- Revenue drops to average $943 per month
- Occupancy decreases to average 15.7%
- Daily rates adjust to average $220
Seasonality Insights for Holløse
- The Airbnb seasonality in Holløse shows highly seasonal trends requiring careful strategy. While the sections above show seasonal averages, it's also insightful to look at the extremes:
- During the high season, the absolute peak month showcases Holløse's highest earning potential, with monthly revenues capable of climbing to $3,702, occupancy reaching a high of 50.4%, and ADRs peaking at $230.
- Conversely, the slowest single month of the year, typically falling within the low season, marks the market's lowest point. In this month, revenue might dip to $200, occupancy could drop to 3.6%, and ADRs may adjust down to $211.
- Understanding both the seasonal averages and these monthly peaks and troughs in revenue, occupancy, and ADR is crucial for maximizing your Airbnb profit potential in Holløse.
Seasonal Strategies for Maximizing Profit
- Peak Season: Maximize revenue through premium pricing and potentially longer minimum stays. Ensure high availability.
- Low Season: Offer competitive pricing, special promotions (e.g., extended stay discounts), and flexible cancellation policies. Target off-season travelers like remote workers or budget-conscious guests.
- Shoulder Seasons: Implement dynamic pricing that balances peak and low rates. Target weekend travelers or specific events. Offer slightly more flexible terms than peak season.
- Regularly analyze your own performance against these Holløse seasonality benchmarks and adjust your pricing and availability strategy accordingly.
Best Areas for Airbnb Investment in Holløse (2026)
Exploring the top neighborhoods for short-term rentals in Holløse? This section highlights key areas, outlining why they are attractive for hosts and guests, along with notable local attractions. Consider these locations based on your target guest profile and investment strategy.
| Neighborhood / Area | Why Host Here? (Target Guests & Appeal) | Key Attractions & Landmarks |
|---|---|---|
| Holløse Village | A quaint and peaceful village atmosphere that attracts families and couples looking for a relaxing getaway. Surrounded by nature, it's the perfect spot for those wanting to escape the city bustle. | Local parks, Bicycle trails, Cafés, Local art galleries |
| Bagsværd Sø | Located near a beautiful lake, this area offers outdoor activities and a scenic backdrop for guests. It's ideal for those seeking nature-oriented stays with water sports and hiking opportunities. | Bagsværd Lake, Walking paths, Fishing spots, Picnic areas |
| Vallensbæk Strand | A coastal area with stunning beach access, making it attractive for beachgoers and families during the summer months. The local vibe is relaxed and perfect for vacationers. | Vallensbæk Beach, Marina, Beachside restaurants, Promenade |
| Lyngby-Taarbæk | This municipality offers a rich blend of urban amenities and scenic nature close to Copenhagen. It's popular among both tourists and locals looking for both relaxation and city life. | Lyngby Lake, Shopping centers, Cafés, Cultural events |
| Frederiksberg | An affluent area of Copenhagen known for its parks and gardens, making it a prime location for tourists who prefer elegance and outdoor leisure activities. | Frederiksberg Gardens, Copenhagen Zoo, Shopping streets, Cafés |
| Copenhagen West | West Copenhagen encompasses trendy neighborhoods that attract a younger crowd and tourists looking for a hip urban experience with artistic flair. | Vesterbro, Kødbyen (the Meatpacking District), Street art, Restaurants and bars |
| Tisvilde | A charming coastal town perfect for those looking for a mix of beach relaxation and nature exploration. This area appeals to adventure seekers and beach lovers. | Tisvilde Beach, Tisvilde Hegn (forest), Cafés, Local shops |
| Hillerød | Home to historic attractions such as Frederiksborg Castle, Hillerød attracts both history buffs and tourists interested in culture and nature combined. | Frederiksborg Castle, Hillerød Town Center, Gardens, Museums |
Understanding Airbnb License Requirements & STR Laws in Holløse (2026)
While Holløse, Capital Region of Denmark, Denmark currently shows low STR regulations, specific Airbnb license requirements might still exist or change. Always verify the latest short term rental regulations and Airbnb license requirements directly with local government authorities for Holløse to ensure full compliance before hosting.
(Source: AirROI data, 2026, finding no licensed listings among those analyzed)
Top Performing Airbnb Properties in Holløse (2026)
Benchmark your potential! Explore examples of top-performing Airbnb properties in Holløsebased on Trailing Twelve Month (TTM) revenue. Analyze their characteristics, revenue, occupancy rate, and ADR to understand what drives success in this market.

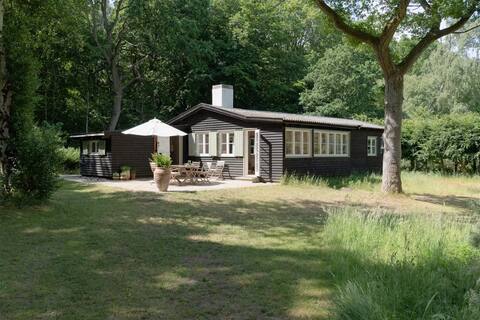
Cozy hideaway with private garden, 100m to forest
Entire Place • 2 bedrooms

Lovely large year-round house close to forest and beach
Entire Place • 3 bedrooms
Charming Family Forest Retreat in Tisvildeleje
Entire Place • 2 bedrooms
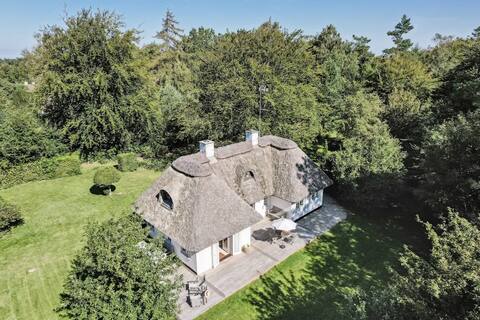
Idyllic Thatched Cottage Retreat
Entire Place • 3 bedrooms

A frame On a Hillside, Facing South East
Entire Place • 3 bedrooms

Lovely house by Tisvilde Hegn
Entire Place • 3 bedrooms
Note: Performance varies based on location, size, amenities, seasonality, and management quality. Data reflects the past 12 months.
Top Performing Airbnb Hosts in Holløse (2026)
Learn from the best! This table showcases top-performing Airbnb hosts in Holløse based on the number of properties managed and estimated total revenue over the past year. Analyze their scale and performance metrics.
| Host Name | Properties | Grossing Revenue | Stay Reviews | Avg Rating |
|---|---|---|---|---|
| Hans Christian Barré | 1 | $47,602 | 11 | 4.91/5.0 |
| Anette | 1 | $27,030 | 35 | 5.00/5.0 |
| Kat | 1 | $20,230 | 8 | 5.00/5.0 |
| Christina Maria | 1 | $14,922 | 6 | 5.00/5.0 |
| Mads | 1 | $11,282 | 23 | 4.78/5.0 |
| Nina | 1 | $11,005 | 1 | Not Rated |
| Katrine | 1 | $9,759 | 5 | 5.00/5.0 |
| Laura | 1 | $8,844 | 13 | 4.69/5.0 |
| Christian L. | 1 | $8,015 | 46 | 4.83/5.0 |
| Lotte | 1 | $6,595 | 15 | 4.80/5.0 |
Analyzing the strategies of top hosts, such as their property selection, pricing, and guest communication, can offer valuable lessons for optimizing your own Airbnb operations in Holløse.
Dive Deeper: Advanced Holløse STR Market Data (2026)
Ready to unlock more insights? AirROI provides access to advanced metrics and comprehensive Airbnb data for Holløse. Explore detailed analytics beyond this report to refine your investment strategy, optimize pricing, and maximize your vacation rental profits.
Explore Advanced MetricsHolløse Short-Term Rental Market Composition (2026): Property & Room Types
Room Type Distribution
Property Type Distribution
Market Composition Insights for Holløse
- The Holløse Airbnb market composition is heavily skewed towards Entire Home/Apt listings, which make up 100% of the 18 active rentals. This indicates strong guest preference for privacy and space.
- Looking at the property type distribution in Holløse, House properties are the most common (61.1%), reflecting the local real estate landscape.
- Houses represent a significant 61.1% portion, catering likely to families or larger groups.
Holløse Airbnb Room Capacity Analysis (2026): Bedroom Distribution
Distribution of Listings by Number of Bedrooms
Room Capacity Insights for Holløse
- The dominant room capacity in Holløse is 3 bedrooms listings, making up 61.1% of the market. This suggests a strong demand for properties suitable for families or small groups.
- Together, 3 bedrooms and 2 bedrooms properties represent 94.4% of the active Airbnb listings in Holløse, indicating a high concentration in these sizes.
- A significant 61.1% of listings offer 3+ bedrooms, catering to larger groups and families seeking more space in Holløse.
Holløse Vacation Rental Guest Capacity Trends (2026)
Distribution of Listings by Guest Capacity
Guest Capacity Insights for Holløse
- The most common guest capacity trend in Holløse vacation rentals is listings accommodating 6 guests (27.8%). This suggests the primary traveler segment is likely larger groups.
- Properties designed for 6 guests and 5 guests dominate the Holløse STR market, accounting for 55.6% of listings.
- 33.4% of properties accommodate 6+ guests, serving the market segment for larger families or group travel in Holløse.
- On average, properties in Holløse are equipped to host 4.8 guests.
Holløse Airbnb Booking Patterns (2026): Available vs. Booked Days
Available Days Distribution
Booked Days Distribution
Booking Pattern Insights for Holløse
- The most common availability pattern in Holløse falls within the 271-366 days range, representing 88.9% of listings. This suggests many properties have significant open periods on their calendars.
- Approximately 94.5% of listings show high availability (181+ days open annually), indicating potential for increased bookings or specific owner usage patterns.
- For booked days, the 31-90 days range is most frequent in Holløse (61.1%), reflecting common guest stay durations or potential owner blocking patterns.
- A notable 5.6% of properties secure long booking periods (181+ days booked per year), highlighting successful long-term rental strategies or significant owner usage.
Holløse Airbnb Minimum Stay Requirements Analysis
Distribution of Listings by Minimum Night Requirement
1 Night
1 listings
5.6% of total
2 Nights
2 listings
11.1% of total
3 Nights
3 listings
16.7% of total
4-6 Nights
5 listings
27.8% of total
30+ Nights
7 listings
38.9% of total
Key Insights
- The most prevalent minimum stay requirement in Holløse is 30+ Nights, adopted by 38.9% of listings. This highlights the market's preference for longer commitments.
- Very short stays (1-2 nights) are less common (16.7%), suggesting hosts prefer slightly longer bookings to optimize turnover.
- A significant segment (38.9%) caters to monthly stays (30+ nights) in Holløse, pointing to opportunities in the extended-stay market.
Recommendations
- Align with the market by considering a 30+ Nights minimum stay, as 38.9% of Holløse hosts use this setting.
- If feasible, allowing 1-night stays, especially midweek or during low season, could capture last-minute bookings, as only 5.6% currently do.
- Explore offering discounts for stays of 30+ nights to attract the 38.9% of the market seeking extended stays.
- Adjust minimum nights based on seasonality – potentially shorter during low season and longer during peak demand periods in Holløse.
Holløse Airbnb Cancellation Policy Trends Analysis (2026)
Limited
1 listings
5.6% of total
Flexible
2 listings
11.1% of total
Moderate
2 listings
11.1% of total
Firm
7 listings
38.9% of total
Strict
6 listings
33.3% of total
Cancellation Policy Insights for Holløse
- The prevailing Airbnb cancellation policy trend in Holløse is Firm, used by 38.9% of listings.
- A majority (72.2%) of hosts in Holløse utilize Firm or Strict policies, indicating a market where hosts prioritize booking security.
Recommendations for Hosts
- Consider adopting a Firm policy to align with the 38.9% market standard in Holløse.
- With 33.3% using Strict terms, this is a viable option in Holløse, particularly for high-value properties or during peak demand periods.
- Regularly review your cancellation policy against competitors and market demand shifts in Holløse.
Holløse STR Booking Lead Time Analysis (2026)
Average Booking Lead Time by Month
Booking Lead Time Insights for Holløse
- The overall average booking lead time for vacation rentals in Holløse is 62 days.
- Guests book furthest in advance for stays during July (average 142 days), likely coinciding with peak travel demand or local events.
- The shortest booking windows occur for stays in December (average 1 days), indicating more last-minute travel plans during this time.
- Seasonally, Summer (103 days avg.) sees the longest lead times, while Winter (1 days avg.) has the shortest, reflecting typical travel planning cycles.
Recommendations for Hosts
- Use the overall average lead time (62 days) as a baseline for your pricing and availability strategy in Holløse.
- For July stays, consider implementing length-of-stay discounts or slightly higher rates for bookings made less than 142 days out to capitalize on advance planning.
- During December, focus on last-minute booking availability and promotions, as guests book with very short notice (1 days avg.).
- Target marketing efforts for the Summer season well in advance (at least 103 days) to capture early planners.
- Monitor your own booking lead times against these Holløse averages to identify opportunities for dynamic pricing adjustments.
Popular & Essential Airbnb Amenities in Holløse (2026)
Amenity Prevalence
Amenity Insights for Holløse
- Essential amenities in Holløse that guests expect include: Free parking on premises, Kitchen. Lacking these (any) could significantly impact bookings.
- Popular amenities like Heating, Hangers, Wifi are common but not universal. Offering these can provide a competitive edge.
- Warning: Wifi is not universally provided but is considered essential globally. Ensure reliable Wifi is offered.
Recommendations for Hosts
- Ensure your listing includes all essential amenities for Holløse: Free parking on premises, Kitchen.
- Consider adding popular differentiators like Heating or Hangers to increase appeal.
- Highlight unique or less common amenities you offer (e.g., hot tub, dedicated workspace, EV charger) in your listing description and photos.
- Regularly check competitor amenities in Holløse to stay competitive.
Holløse Airbnb Guest Demographics & Profile Analysis (2026)
Guest Profile Summary for Holløse
- The typical guest profile for Airbnb in Holløse consists of a mix of domestic (36%) and international guests, with top international origins including Germany, typically belonging to the Post-2000s (Gen Z/Alpha) group (50%), primarily speaking English or German.
- Domestic travelers account for 36.0% of guests.
- Key international markets include Denmark (36%) and Germany (28%).
- Top languages spoken are English (36%) followed by German (16%).
- A significant demographic segment is the Post-2000s (Gen Z/Alpha) group, representing 50% of guests.
Recommendations for Hosts
- Focus marketing internationally, particularly towards travelers from Germany.
- Tailor amenities and listing descriptions to appeal to the dominant Post-2000s (Gen Z/Alpha) demographic (e.g., highlight fast WiFi, smart home features, local guides).
- Highlight unique local experiences or amenities relevant to the primary guest profile.
- Consider seasonal promotions aligned with peak travel times for key origin markets.
Nearby Short-Term Rental Market Comparison
How does the Holløse Airbnb market stack up against its neighbors? Compare key performance metrics like average monthly revenue, ADR, and occupancy rates in surrounding areas to understand the broader regional STR landscape.
| Market | Active Properties | Monthly Revenue | Daily Rate | Avg. Occupancy |
|---|---|---|---|---|
| Lerums kommun | 35 | $2,479 | $282.44 | 46% |
| Copenhagen | 9,111 | $2,347 | $222.94 | 52% |
| Saunte | 10 | $2,212 | $213.23 | 46% |
| Perstorps kommun | 13 | $2,081 | $161.55 | 48% |
| Frederiksberg | 1,015 | $2,062 | $217.28 | 50% |
| Solrød Strand | 54 | $2,032 | $249.51 | 48% |
| Trönningenäs | 19 | $2,022 | $283.00 | 46% |
| Hellerup | 11 | $1,973 | $298.07 | 51% |
| Örkelljunga | 17 | $1,963 | $305.70 | 28% |
| Hestra | 17 | $1,930 | $193.94 | 36% |