Bækkekrog Airbnb Market Analysis 2025: Short Term Rental Data & Vacation Rental Statistics in Capital Region of Denmark, Denmark
Is Airbnb profitable in Bækkekrog in 2025? Explore comprehensive Airbnb analytics for Bækkekrog, Capital Region of Denmark, Denmark to uncover income potential. This 2025 STR market report for Bækkekrog, based on AirROI data from November 2024 to October 2025, reveals key trends in the niche market of 18 active listings.
Whether you're considering an Airbnb investment in Bækkekrog, optimizing your existing vacation rental, or exploring rental arbitrage opportunities, understanding the Bækkekrog Airbnb data is crucial. Leveraging the low regulation environment is key to maximizing your short term rental income potential. Let's dive into the specifics.
Key Bækkekrog Airbnb Performance Metrics Overview
Monthly Airbnb Revenue Variations & Income Potential in Bækkekrog (2025)
Understanding the monthly revenue variations for Airbnb listings in Bækkekrog is key to maximizing your short term rental income potential. Seasonality significantly impacts earnings. Our analysis, based on data from the past 12 months, shows that the peak revenue month for STRs in Bækkekrog is typically July, while September often presents the lowest earnings, highlighting opportunities for strategic pricing adjustments during shoulder and low seasons. Explore the typical Airbnb income in Bækkekrog across different performance tiers:
- Best-in-class properties (Top 10%) achieve $3,287+ monthly, often utilizing dynamic pricing and superior guest experiences.
- Strong performing properties (Top 25%) earn $2,591 or more, indicating effective management and desirable locations/amenities.
- Typical properties (Median) generate around $1,392 per month, representing the average market performance.
- Entry-level properties (Bottom 25%) see earnings around $721, often with potential for optimization.
Average Monthly Airbnb Earnings Trend in Bækkekrog
Bækkekrog Airbnb Occupancy Rate Trends (2025)
Maximize your bookings by understanding the Bækkekrog STR occupancy trends. Seasonal demand shifts significantly influence how often properties are booked. Typically, Julysees the highest demand (peak season occupancy), while September experiences the lowest (low season). Effective strategies, like adjusting minimum stays or offering promotions, can boost occupancy during slower periods. Here's how different property tiers perform in Bækkekrog:
- Best-in-class properties (Top 10%) achieve 70%+ occupancy, indicating high desirability and potentially optimized availability.
- Strong performing properties (Top 25%) maintain 55% or higher occupancy, suggesting good market fit and guest satisfaction.
- Typical properties (Median) have an occupancy rate around 34%.
- Entry-level properties (Bottom 25%) average 17% occupancy, potentially facing higher vacancy.
Average Monthly Occupancy Rate Trend in Bækkekrog
Average Daily Rate (ADR) Airbnb Trends in Bækkekrog (2025)
Effective short term rental pricing strategy in Bækkekrog involves understanding monthly ADR fluctuations. The Average Daily Rate (ADR) for Airbnb in Bækkekrog typically peaks in December and dips lowest during June. Leveraging Airbnb dynamic pricing tools or strategies based on this seasonality can significantly boost revenue. Here's a look at the typical nightly rates achieved:
- Best-in-class properties (Top 10%) command rates of $278+ per night, often due to premium features or locations.
- Strong performing properties (Top 25%) achieve nightly rates of $216 or more.
- Typical properties (Median) charge around $178 per night.
- Entry-level properties (Bottom 25%) earn around $139 per night.
Average Daily Rate (ADR) Trend by Month in Bækkekrog
Get Live Bækkekrog Market Intelligence 👇

Explore Real-time Analytics
Airbnb Seasonality Analysis & Trends in Bækkekrog (2025)
Peak Season (July, August, June)
- Revenue averages $2,794 per month
- Occupancy rates average 55.9%
- Daily rates average $178
Shoulder Season
- Revenue averages $1,648 per month
- Occupancy maintains around 36.1%
- Daily rates hold near $183
Low Season (February, September, October)
- Revenue drops to average $1,023 per month
- Occupancy decreases to average 23.5%
- Daily rates adjust to average $177
Seasonality Insights for Bækkekrog
- The Airbnb seasonality in Bækkekrog shows highly seasonal trends requiring careful strategy. While the sections above show seasonal averages, it's also insightful to look at the extremes:
- During the high season, the absolute peak month showcases Bækkekrog's highest earning potential, with monthly revenues capable of climbing to $3,335, occupancy reaching a high of 62.5%, and ADRs peaking at $186.
- Conversely, the slowest single month of the year, typically falling within the low season, marks the market's lowest point. In this month, revenue might dip to $910, occupancy could drop to 20.0%, and ADRs may adjust down to $174.
- Understanding both the seasonal averages and these monthly peaks and troughs in revenue, occupancy, and ADR is crucial for maximizing your Airbnb profit potential in Bækkekrog.
Seasonal Strategies for Maximizing Profit
- Peak Season: Maximize revenue through premium pricing and potentially longer minimum stays. Ensure high availability.
- Low Season: Offer competitive pricing, special promotions (e.g., extended stay discounts), and flexible cancellation policies. Target off-season travelers like remote workers or budget-conscious guests.
- Shoulder Seasons: Implement dynamic pricing that balances peak and low rates. Target weekend travelers or specific events. Offer slightly more flexible terms than peak season.
- Regularly analyze your own performance against these Bækkekrog seasonality benchmarks and adjust your pricing and availability strategy accordingly.
Best Areas for Airbnb Investment in Bækkekrog (2025)
Exploring the top neighborhoods for short-term rentals in Bækkekrog? This section highlights key areas, outlining why they are attractive for hosts and guests, along with notable local attractions. Consider these locations based on your target guest profile and investment strategy.
| Neighborhood / Area | Why Host Here? (Target Guests & Appeal) | Key Attractions & Landmarks |
|---|---|---|
| Helsingør | A historic town known for its iconic castle, Kronborg, and charming waterfront. It attracts tourists interested in culture and history, making it a great spot for Airbnb hosting. | Kronborg Castle, M/S Maritime Museum of Denmark, Helsingør's Old Town, Rosenborg Castle, Hamlet's Grave |
| Copenhagen City Center | The vibrant heart of the capital, filled with cultural sights, shopping, and restaurants. Ideal for tourists seeking urban experiences and convenient access to attractions. | Tivoli Gardens, The Little Mermaid, Nyhavn, Strøget shopping street, Rundetaarn |
| Frederiksberg | A beautiful borough known for its parks, shopping, and dining options. It offers a host of luxurious accommodations and is a desirable area for tourists and locals alike. | Frederiksberg Gardens, Copenhagen Zoo, Frederiksberg Palace, Danish Design Centre, Shopping at Falkoner Allé |
| Vesterbro | A trendy neighborhood known for its hip cafes, bars, and nightlife. It attracts a younger demographic and those looking for a lively atmosphere. | Tivoli Gardens, Meatpacking District, Vesterbrogade, Kødbyen, Copenhagen Central Station |
| Nørrebro | A multicultural area known for its creativity, cool cafes, and vibrant street life. Popular among younger travelers seeking an authentic experience. | Assistens Cemetery, Nørrebro Park, Superkilen Park, Café Kafeteriet, The Aamanns Deli |
| Amager | A diverse island area known for its beaches, parks, and modern architecture. It's ideal for travelers looking for a mix of nature and urban life. | Amager Strandpark, The Little Mermaid, Copenhagen Opera House, Copenhill, Kastrup Sea Bath |
| Hellerup | An affluent suburb of Copenhagen with beautiful homes and proximity to the coast. It attracts visitors looking for a quieter stay while still being close to the city. | Sculpture Park, Hellerup Marina, Louisiana Museum of Modern Art, Kampenborg Strand, St. Andrew's Church |
| Dragør | A picturesque fishing village that's famous for its 18th-century architecture and harbor. It's perfect for guests who want a tranquil escape near the capital. | The Old Town, Dragør Beach, Dragør Museum, The Harbor, The Lighthouse |
Understanding Airbnb License Requirements & STR Laws in Bækkekrog (2025)
While Bækkekrog, Capital Region of Denmark, Denmark currently shows low STR regulations, specific Airbnb license requirements might still exist or change. Always verify the latest short term rental regulations and Airbnb license requirements directly with local government authorities for Bækkekrog to ensure full compliance before hosting.
(Source: AirROI data, 2025, finding no licensed listings among those analyzed)
Top Performing Airbnb Properties in Bækkekrog (2025)
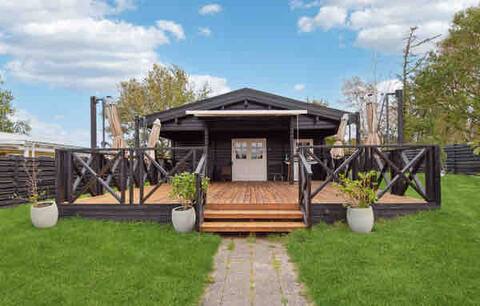
Benchmark your potential! Explore examples of top-performing Airbnb properties in Bækkekrogbased on Trailing Twelve Month (TTM) revenue. Analyze their characteristics, revenue, occupancy rate, and ADR to understand what drives success in this market.
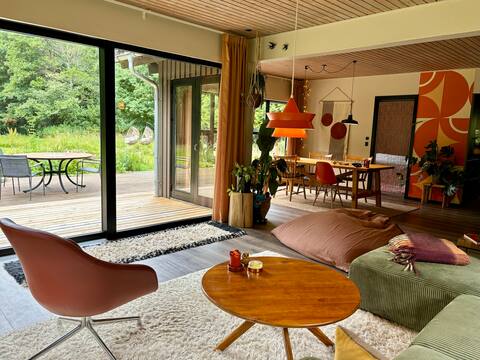
Large cottage in the middle of nature
Entire Place • 5 bedrooms
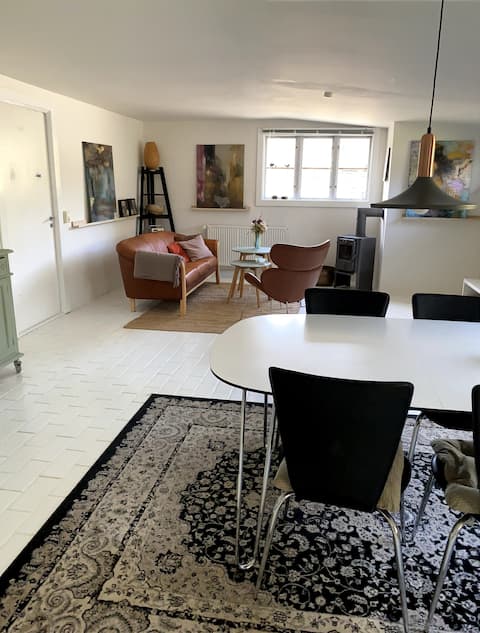
Fully equipped house, wonderful nature - all year
Entire Place • 2 bedrooms
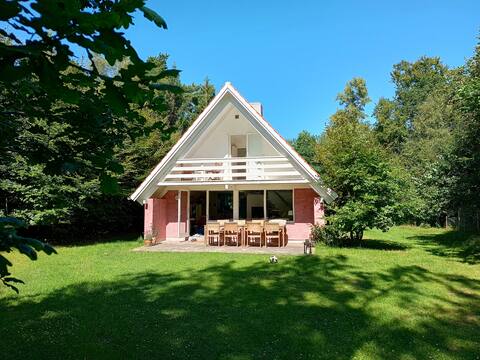
Summer house overlooking Tisvilde Hegn, Asserbo
Entire Place • 2 bedrooms
Cozy house for 2 people
Entire Place • 1 bedroom
Feriehus - Ramløse, Danmark
Entire Place • 3 bedrooms
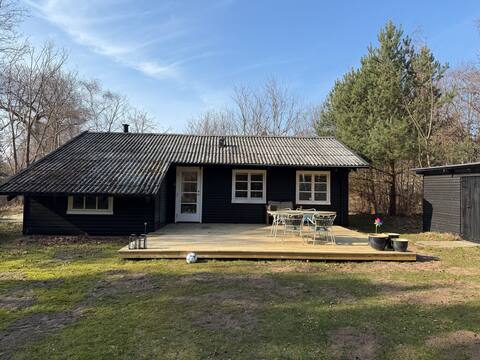
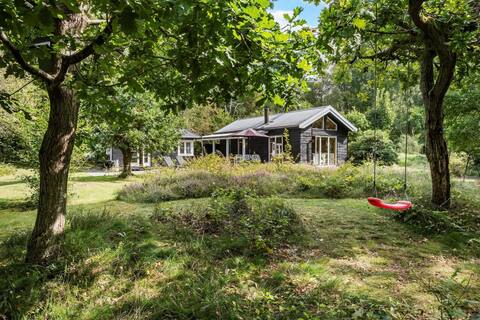
Beautifully renovated cottage by the forest and large plot
Entire Place • 3 bedrooms
Note: Performance varies based on location, size, amenities, seasonality, and management quality. Data reflects the past 12 months.
Top Performing Airbnb Hosts in Bækkekrog (2025)
Learn from the best! This table showcases top-performing Airbnb hosts in Bækkekrog based on the number of properties managed and estimated total revenue over the past year. Analyze their scale and performance metrics.
| Host Name | Properties | Grossing Revenue | Stay Reviews | Avg Rating |
|---|---|---|---|---|
| Louise | 1 | $41,984 | 8 | 5.00/5.0 |
| Louise | 1 | $31,098 | 82 | 4.90/5.0 |
| Ditte | 1 | $23,156 | 6 | 4.83/5.0 |
| Gitte | 1 | $20,392 | 13 | 4.92/5.0 |
| Refaat | 1 | $19,509 | 26 | 4.23/5.0 |
| Jakob | 1 | $17,194 | 7 | 4.86/5.0 |
| Line | 1 | $16,831 | 71 | 4.87/5.0 |
| Christina | 1 | $14,631 | 2 | Not Rated |
| Simone | 1 | $9,044 | 3 | 4.67/5.0 |
| Verner | 1 | $8,562 | 15 | 4.87/5.0 |
Analyzing the strategies of top hosts, such as their property selection, pricing, and guest communication, can offer valuable lessons for optimizing your own Airbnb operations in Bækkekrog.
Dive Deeper: Advanced Bækkekrog STR Market Data (2025)
Ready to unlock more insights? AirROI provides access to advanced metrics and comprehensive Airbnb data for Bækkekrog. Explore detailed analytics beyond this report to refine your investment strategy, optimize pricing, and maximize your vacation rental profits.
Explore Advanced MetricsBækkekrog Short-Term Rental Market Composition (2025): Property & Room Types
Room Type Distribution
Property Type Distribution
Market Composition Insights for Bækkekrog
- The Bækkekrog Airbnb market composition is heavily skewed towards Entire Home/Apt listings, which make up 94.4% of the 18 active rentals. This indicates strong guest preference for privacy and space.
- Looking at the property type distribution in Bækkekrog, House properties are the most common (50%), reflecting the local real estate landscape.
- Houses represent a significant 50% portion, catering likely to families or larger groups.
- The presence of 11.1% Hotel/Boutique listings indicates integration with traditional hospitality.
Bækkekrog Airbnb Room Capacity Analysis (2025): Bedroom Distribution
Distribution of Listings by Number of Bedrooms
Room Capacity Insights for Bækkekrog
- The dominant room capacity in Bækkekrog is 3 bedrooms listings, making up 44.4% of the market. This suggests a strong demand for properties suitable for families or small groups.
- Together, 3 bedrooms and 2 bedrooms properties represent 77.7% of the active Airbnb listings in Bækkekrog, indicating a high concentration in these sizes.
- A significant 55.6% of listings offer 3+ bedrooms, catering to larger groups and families seeking more space in Bækkekrog.
Bækkekrog Vacation Rental Guest Capacity Trends (2025)
Distribution of Listings by Guest Capacity
Guest Capacity Insights for Bækkekrog
- The most common guest capacity trend in Bækkekrog vacation rentals is listings accommodating 6 guests (33.3%). This suggests the primary traveler segment is likely larger groups.
- Properties designed for 6 guests and 4 guests dominate the Bækkekrog STR market, accounting for 61.1% of listings.
- 55.5% of properties accommodate 6+ guests, serving the market segment for larger families or group travel in Bækkekrog.
- On average, properties in Bækkekrog are equipped to host 5.3 guests.
Bækkekrog Airbnb Booking Patterns (2025): Available vs. Booked Days
Available Days Distribution
Booked Days Distribution
Booking Pattern Insights for Bækkekrog
- The most common availability pattern in Bækkekrog falls within the 271-366 days range, representing 61.1% of listings. This suggests many properties have significant open periods on their calendars.
- Approximately 94.4% of listings show high availability (181+ days open annually), indicating potential for increased bookings or specific owner usage patterns.
- For booked days, the 1-30 days range is most frequent in Bækkekrog (38.9%), reflecting common guest stay durations or potential owner blocking patterns.
- A notable 11.1% of properties secure long booking periods (181+ days booked per year), highlighting successful long-term rental strategies or significant owner usage.
Bækkekrog Airbnb Minimum Stay Requirements Analysis
Distribution of Listings by Minimum Night Requirement
1 Night
2 listings
11.1% of total
2 Nights
3 listings
16.7% of total
3 Nights
3 listings
16.7% of total
4-6 Nights
5 listings
27.8% of total
7-29 Nights
2 listings
11.1% of total
30+ Nights
3 listings
16.7% of total
Key Insights
- The most prevalent minimum stay requirement in Bækkekrog is 4-6 Nights, adopted by 27.8% of listings. This highlights the market's preference for longer commitments.
- A significant segment (16.7%) caters to monthly stays (30+ nights) in Bækkekrog, pointing to opportunities in the extended-stay market.
Recommendations
- Align with the market by considering a 4-6 Nights minimum stay, as 27.8% of Bækkekrog hosts use this setting.
- If feasible, allowing 1-night stays, especially midweek or during low season, could capture last-minute bookings, as only 11.1% currently do.
- Explore offering discounts for stays of 30+ nights to attract the 16.7% of the market seeking extended stays.
- Adjust minimum nights based on seasonality – potentially shorter during low season and longer during peak demand periods in Bækkekrog.
Bækkekrog Airbnb Cancellation Policy Trends Analysis (2025)
Flexible
6 listings
33.3% of total
Moderate
4 listings
22.2% of total
Firm
4 listings
22.2% of total
Strict
4 listings
22.2% of total
Cancellation Policy Insights for Bækkekrog
- The prevailing Airbnb cancellation policy trend in Bækkekrog is Flexible, used by 33.3% of listings.
- There's a relatively balanced mix between guest-friendly (55.5%) and stricter (44.4%) policies, offering choices for different guest needs.
Recommendations for Hosts
- Consider adopting a Flexible policy to align with the 33.3% market standard in Bækkekrog.
- Regularly review your cancellation policy against competitors and market demand shifts in Bækkekrog.
Bækkekrog STR Booking Lead Time Analysis (2025)
Average Booking Lead Time by Month
Booking Lead Time Insights for Bækkekrog
- The overall average booking lead time for vacation rentals in Bækkekrog is 47 days.
- Guests book furthest in advance for stays during July (average 103 days), likely coinciding with peak travel demand or local events.
- The shortest booking windows occur for stays in October (average 9 days), indicating more last-minute travel plans during this time.
- Seasonally, Summer (69 days avg.) sees the longest lead times, while Winter (23 days avg.) has the shortest, reflecting typical travel planning cycles.
Recommendations for Hosts
- Use the overall average lead time (47 days) as a baseline for your pricing and availability strategy in Bækkekrog.
- For July stays, consider implementing length-of-stay discounts or slightly higher rates for bookings made less than 103 days out to capitalize on advance planning.
- During October, focus on last-minute booking availability and promotions, as guests book with very short notice (9 days avg.).
- Target marketing efforts for the Summer season well in advance (at least 69 days) to capture early planners.
- Monitor your own booking lead times against these Bækkekrog averages to identify opportunities for dynamic pricing adjustments.
Popular & Essential Airbnb Amenities in Bækkekrog (2025)
Amenity Prevalence
Amenity Insights for Bækkekrog
- Essential amenities in Bækkekrog that guests expect include: Heating. Lacking these (this) could significantly impact bookings.
- Popular amenities like Free parking on premises, Wifi, Kitchen are common but not universal. Offering these can provide a competitive edge.
- Warning: Wifi is not universally provided but is considered essential globally. Ensure reliable Wifi is offered.
Recommendations for Hosts
- Ensure your listing includes all essential amenities for Bækkekrog: Heating.
- Consider adding popular differentiators like Free parking on premises or Wifi to increase appeal.
- Highlight unique or less common amenities you offer (e.g., hot tub, dedicated workspace, EV charger) in your listing description and photos.
- Regularly check competitor amenities in Bækkekrog to stay competitive.
Bækkekrog Airbnb Guest Demographics & Profile Analysis (2025)
Guest Profile Summary for Bækkekrog
- The typical guest profile for Airbnb in Bækkekrog consists of a mix of domestic (57%) and international guests, often arriving from nearby Copenhagen, typically belonging to the Post-2000s (Gen Z/Alpha) group (50%), primarily speaking English or Danish.
- Domestic travelers account for 57.4% of guests.
- Key international markets include Denmark (57.4%) and Netherlands (10.6%).
- Top languages spoken are English (37.5%) followed by Danish (22.9%).
- A significant demographic segment is the Post-2000s (Gen Z/Alpha) group, representing 50% of guests.
Recommendations for Hosts
- Balance marketing efforts between domestic and international channels based on the guest mix.
- Tailor amenities and listing descriptions to appeal to the dominant Post-2000s (Gen Z/Alpha) demographic (e.g., highlight fast WiFi, smart home features, local guides).
- Highlight unique local experiences or amenities relevant to the primary guest profile.
- Consider seasonal promotions aligned with peak travel times for key origin markets.
Nearby Short-Term Rental Market Comparison
How does the Bækkekrog Airbnb market stack up against its neighbors? Compare key performance metrics like average monthly revenue, ADR, and occupancy rates in surrounding areas to understand the broader regional STR landscape.
| Market | Active Properties | Monthly Revenue | Daily Rate | Avg. Occupancy |
|---|---|---|---|---|
| Copenhagen | 9,573 | $2,294 | $220.64 | 50% |
| Lerums kommun | 35 | $2,265 | $274.13 | 44% |
| Hestra | 16 | $2,153 | $201.40 | 41% |
| Solrød Strand | 49 | $2,139 | $228.87 | 47% |
| Laröd | 12 | $2,118 | $356.87 | 39% |
| Saunte | 11 | $2,059 | $211.02 | 44% |
| Stillinge Strand | 22 | $2,054 | $236.97 | 37% |
| Perstorps kommun | 14 | $2,032 | $165.38 | 49% |
| Frederiksberg | 1,079 | $2,023 | $218.97 | 48% |
| Kastrup | 77 | $2,006 | $184.03 | 51% |