Kalogreia Airbnb Market Analysis 2026: Short Term Rental Data & Vacation Rental Statistics in Northern Cyprus, Cyprus
Is Airbnb profitable in Kalogreia in 2026? Explore comprehensive Airbnb analytics for Kalogreia, Northern Cyprus, Cyprus to uncover income potential. This 2026 STR market report for Kalogreia, based on AirROI data from February 2025 to January 2026, reveals key trends in the niche market of 18 active listings.
Whether you're considering an Airbnb investment in Kalogreia, optimizing your existing vacation rental, or exploring rental arbitrage opportunities, understanding the Kalogreia Airbnb data is crucial. Leveraging the low regulation environment is key to maximizing your short term rental income potential. Let's dive into the specifics.
Key Kalogreia Airbnb Performance Metrics Overview
Monthly Airbnb Revenue Variations & Income Potential in Kalogreia (2026)
Understanding the monthly revenue variations for Airbnb listings in Kalogreia is key to maximizing your short term rental income potential. Seasonality significantly impacts earnings. Our analysis, based on data from the past 12 months, shows that the peak revenue month for STRs in Kalogreia is typically August, while December often presents the lowest earnings, highlighting opportunities for strategic pricing adjustments during shoulder and low seasons. Explore the typical Airbnb income in Kalogreia across different performance tiers:
- Best-in-class properties (Top 10%) achieve $2,528+ monthly, often utilizing dynamic pricing and superior guest experiences.
- Strong performing properties (Top 25%) earn $1,198 or more, indicating effective management and desirable locations/amenities.
- Typical properties (Median) generate around $639 per month, representing the average market performance.
- Entry-level properties (Bottom 25%) see earnings around $313, often with potential for optimization.
Average Monthly Airbnb Earnings Trend in Kalogreia
Kalogreia Airbnb Occupancy Rate Trends (2026)
Maximize your bookings by understanding the Kalogreia STR occupancy trends. Seasonal demand shifts significantly influence how often properties are booked. Typically, Augustsees the highest demand (peak season occupancy), while December experiences the lowest (low season). Effective strategies, like adjusting minimum stays or offering promotions, can boost occupancy during slower periods. Here's how different property tiers perform in Kalogreia:
- Best-in-class properties (Top 10%) achieve 68%+ occupancy, indicating high desirability and potentially optimized availability.
- Strong performing properties (Top 25%) maintain 41% or higher occupancy, suggesting good market fit and guest satisfaction.
- Typical properties (Median) have an occupancy rate around 21%.
- Entry-level properties (Bottom 25%) average 11% occupancy, potentially facing higher vacancy.
Average Monthly Occupancy Rate Trend in Kalogreia
Average Daily Rate (ADR) Airbnb Trends in Kalogreia (2026)
Effective short term rental pricing strategy in Kalogreia involves understanding monthly ADR fluctuations. The Average Daily Rate (ADR) for Airbnb in Kalogreia typically peaks in August and dips lowest during February. Leveraging Airbnb dynamic pricing tools or strategies based on this seasonality can significantly boost revenue. Here's a look at the typical nightly rates achieved:
- Best-in-class properties (Top 10%) command rates of $200+ per night, often due to premium features or locations.
- Strong performing properties (Top 25%) achieve nightly rates of $122 or more.
- Typical properties (Median) charge around $85 per night.
- Entry-level properties (Bottom 25%) earn around $76 per night.
Average Daily Rate (ADR) Trend by Month in Kalogreia
Get Live Kalogreia Market Intelligence 👇

Explore Real-time Analytics
Airbnb Seasonality Analysis & Trends in Kalogreia (2026)
Peak Season (August, July, June)
- Revenue averages $1,414 per month
- Occupancy rates average 33.9%
- Daily rates average $113
Shoulder Season
- Revenue averages $975 per month
- Occupancy maintains around 31.0%
- Daily rates hold near $100
Low Season (January, November, December)
- Revenue drops to average $687 per month
- Occupancy decreases to average 20.8%
- Daily rates adjust to average $108
Seasonality Insights for Kalogreia
- The Airbnb seasonality in Kalogreia shows highly seasonal trends requiring careful strategy. While the sections above show seasonal averages, it's also insightful to look at the extremes:
- During the high season, the absolute peak month showcases Kalogreia's highest earning potential, with monthly revenues capable of climbing to $1,807, occupancy reaching a high of 39.2%, and ADRs peaking at $115.
- Conversely, the slowest single month of the year, typically falling within the low season, marks the market's lowest point. In this month, revenue might dip to $591, occupancy could drop to 18.3%, and ADRs may adjust down to $89.
- Understanding both the seasonal averages and these monthly peaks and troughs in revenue, occupancy, and ADR is crucial for maximizing your Airbnb profit potential in Kalogreia.
Seasonal Strategies for Maximizing Profit
- Peak Season: Maximize revenue through premium pricing and potentially longer minimum stays. Ensure high availability.
- Low Season: Offer competitive pricing, special promotions (e.g., extended stay discounts), and flexible cancellation policies. Target off-season travelers like remote workers or budget-conscious guests.
- Shoulder Seasons: Implement dynamic pricing that balances peak and low rates. Target weekend travelers or specific events. Offer slightly more flexible terms than peak season.
- Regularly analyze your own performance against these Kalogreia seasonality benchmarks and adjust your pricing and availability strategy accordingly.
Best Areas for Airbnb Investment in Kalogreia (2026)
Exploring the top neighborhoods for short-term rentals in Kalogreia? This section highlights key areas, outlining why they are attractive for hosts and guests, along with notable local attractions. Consider these locations based on your target guest profile and investment strategy.
| Neighborhood / Area | Why Host Here? (Target Guests & Appeal) | Key Attractions & Landmarks |
|---|---|---|
| Kalogreia Beach | Beautiful beach area known for its crystal-clear waters and stunning sunsets, making it a popular spot for sunbathers and water activities. | Kalogreia Beach, Water sports, Sunset views, Beachside cafes |
| Kyrenia Town | Historic coastal town with charming harbor, rich history, and vibrant dining scene. Great for tourists interested in culture and history. | Kyrenia Harbor, Kyrenia Castle, St. Hilarion Castle, Local restaurants, Historic sites |
| Nicosia City Center | Capital city of Cyprus that offers a mix of modern and traditional experiences, attracting both business and leisure travelers. | Ledra Street, The Green Line, Cyprus Museum, Shopping areas, Local culture |
| Famagusta | Historical city with a mix of ancient ruins and beautiful beaches. Attracts history enthusiasts and beach-goers. | Salamis Ruins, Famagusta Old Town, Varosha Beach, Local bazaars, Historical museums |
| Laranca (Larnaca) | Popular with tourists for its beautiful beaches and ancient sites. Offers a vibrant atmosphere and is a gateway to many attractions. | Larnaca Salt Lake, Hala Sultan Tekke, Finikoudes Beach, Local restaurants, Scuba diving |
| Aphrodite's Rock (Petra tou Romiou) | Famous mythological site linked to the goddess of love. Perfect for romantic getaways and day trips. | Aphrodite's Rock, Beautiful coastline, Nature walks, Photography spots |
| Bellapais | Quaint village known for its historical abbey and stunning views over Kyrenia. Attracts couples and those looking for a peaceful retreat. | Bellapais Abbey, Scenic viewpoints, Local eateries, Cultural experiences |
| Karpaz Peninsula | Remote and tranquil area of stunning natural beauty, ideal for those looking to escape the hustle and bustle and enjoy nature. | Karpaz Beaches, Mango Beach, Wild donkeys, Nature reserves, Bird watching |
Understanding Airbnb License Requirements & STR Laws in Kalogreia (2026)
While Kalogreia, Northern Cyprus, Cyprus currently shows low STR regulations, specific Airbnb license requirements might still exist or change. Always verify the latest short term rental regulations and Airbnb license requirements directly with local government authorities for Kalogreia to ensure full compliance before hosting.
(Source: AirROI data, 2026, finding no licensed listings among those analyzed)
Top Performing Airbnb Properties in Kalogreia (2026)
Benchmark your potential! Explore examples of top-performing Airbnb properties in Kalogreiabased on Trailing Twelve Month (TTM) revenue. Analyze their characteristics, revenue, occupancy rate, and ADR to understand what drives success in this market.

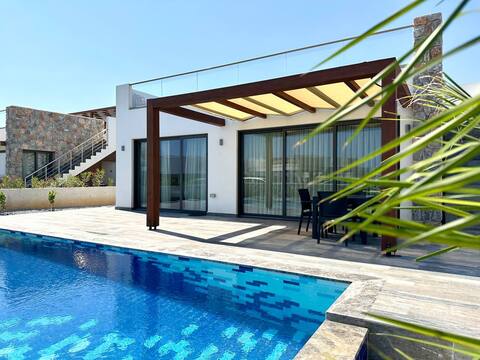
F16 Apartment Deja Blue with Rooftop Terrace
Entire Place • 1 bedroom
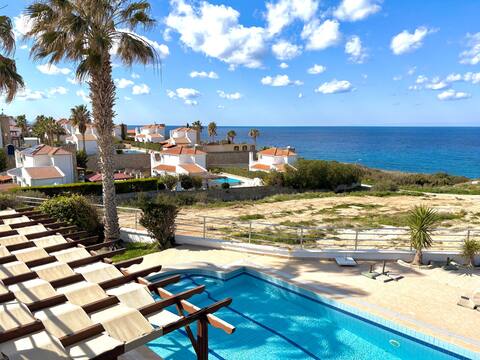
Deja Blue bungalow 2 with private pool sleeps 6
Entire Place • 3 bedrooms
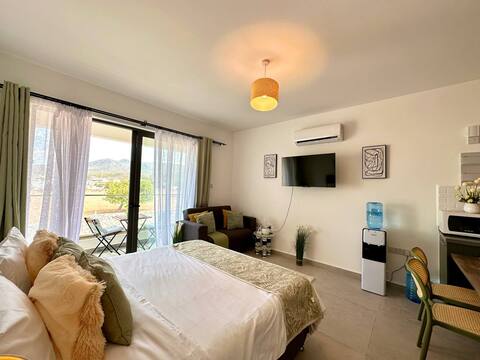
Villa Jacqueline - Three bedroom with sea view
Entire Place • 3 bedrooms
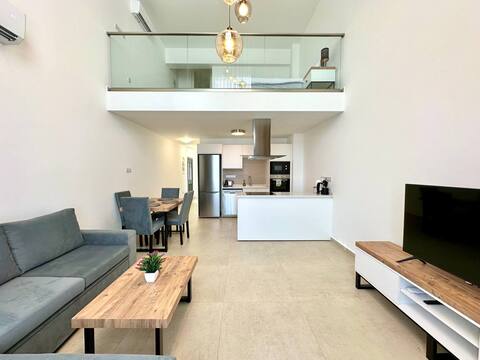
Dejablue, block S4 unit 22
Entire Place • N/A
Deja Blue block C unit 19
Entire Place • 1 bedroom

Deja Blue block S3 unit 10
Entire Place • N/A
Note: Performance varies based on location, size, amenities, seasonality, and management quality. Data reflects the past 12 months.
Top Performing Airbnb Hosts in Kalogreia (2026)
Learn from the best! This table showcases top-performing Airbnb hosts in Kalogreia based on the number of properties managed and estimated total revenue over the past year. Analyze their scale and performance metrics.
| Host Name | Properties | Grossing Revenue | Stay Reviews | Avg Rating |
|---|---|---|---|---|
| JoyaCyprus | 8 | $64,711 | 15 | 4.88/5.0 |
| Your.Rentals | 2 | $43,478 | 14 | 4.83/5.0 |
| Shuki | 1 | $3,901 | 3 | 5.00/5.0 |
| Kate | 1 | $3,230 | 10 | 5.00/5.0 |
| Наталия | 2 | $2,465 | 2 | Not Rated |
| A.Yildiz | 1 | $1,760 | 1 | Not Rated |
| Happy Home Cyprus | 1 | $857 | 1 | Not Rated |
| Andreas | 1 | $447 | 2 | Not Rated |
| Ben | 1 | $247 | 3 | 5.00/5.0 |
Analyzing the strategies of top hosts, such as their property selection, pricing, and guest communication, can offer valuable lessons for optimizing your own Airbnb operations in Kalogreia.
Dive Deeper: Advanced Kalogreia STR Market Data (2026)
Ready to unlock more insights? AirROI provides access to advanced metrics and comprehensive Airbnb data for Kalogreia. Explore detailed analytics beyond this report to refine your investment strategy, optimize pricing, and maximize your vacation rental profits.
Explore Advanced MetricsKalogreia Short-Term Rental Market Composition (2026): Property & Room Types
Room Type Distribution
Property Type Distribution
Market Composition Insights for Kalogreia
- The Kalogreia Airbnb market composition is heavily skewed towards Entire Home/Apt listings, which make up 100% of the 18 active rentals. This indicates strong guest preference for privacy and space.
- Looking at the property type distribution in Kalogreia, Apartment/Condo properties are the most common (88.9%), reflecting the local real estate landscape.
Kalogreia Airbnb Room Capacity Analysis (2026): Bedroom Distribution
Distribution of Listings by Number of Bedrooms
Room Capacity Insights for Kalogreia
- The dominant room capacity in Kalogreia is 1 bedroom listings, making up 33.3% of the market. This suggests a strong demand for properties suitable for couples or solo travelers.
- Together, 1 bedroom and 2 bedrooms properties represent 50.0% of the active Airbnb listings in Kalogreia, indicating a high concentration in these sizes.
Kalogreia Vacation Rental Guest Capacity Trends (2026)
Distribution of Listings by Guest Capacity
Guest Capacity Insights for Kalogreia
- The most common guest capacity trend in Kalogreia vacation rentals is listings accommodating 2 guests (44.4%). This suggests the primary traveler segment is likely couples or solo travelers.
- Properties designed for 2 guests and 3 guests dominate the Kalogreia STR market, accounting for 72.2% of listings.
- A significant 44.4% of listings cater specifically to 1-2 guests, highlighting strong demand from couples and solo travelers in Kalogreia.
- 11.1% of properties accommodate 6+ guests, serving the market segment for larger families or group travel in Kalogreia.
- On average, properties in Kalogreia are equipped to host 3.1 guests.
Kalogreia Airbnb Booking Patterns (2026): Available vs. Booked Days
Available Days Distribution
Booked Days Distribution
Booking Pattern Insights for Kalogreia
- The most common availability pattern in Kalogreia falls within the 271-366 days range, representing 77.8% of listings. This suggests many properties have significant open periods on their calendars.
- Approximately 94.5% of listings show high availability (181+ days open annually), indicating potential for increased bookings or specific owner usage patterns.
- For booked days, the 1-30 days range is most frequent in Kalogreia (38.9%), reflecting common guest stay durations or potential owner blocking patterns.
- A notable 5.6% of properties secure long booking periods (181+ days booked per year), highlighting successful long-term rental strategies or significant owner usage.
Kalogreia Airbnb Minimum Stay Requirements Analysis
Distribution of Listings by Minimum Night Requirement
2 Nights
3 listings
16.7% of total
3 Nights
10 listings
55.6% of total
7-29 Nights
2 listings
11.1% of total
30+ Nights
3 listings
16.7% of total
Key Insights
- The most prevalent minimum stay requirement in Kalogreia is 3 Nights, adopted by 55.6% of listings. This highlights the market's preference for longer commitments.
- Very short stays (1-2 nights) are less common (16.7%), suggesting hosts prefer slightly longer bookings to optimize turnover.
- A significant segment (16.7%) caters to monthly stays (30+ nights) in Kalogreia, pointing to opportunities in the extended-stay market.
Recommendations
- Align with the market by considering a 3 Nights minimum stay, as 55.6% of Kalogreia hosts use this setting.
- Explore offering discounts for stays of 30+ nights to attract the 16.7% of the market seeking extended stays.
- Adjust minimum nights based on seasonality – potentially shorter during low season and longer during peak demand periods in Kalogreia.
Kalogreia Airbnb Cancellation Policy Trends Analysis (2026)
Flexible
3 listings
16.7% of total
Moderate
10 listings
55.6% of total
Firm
2 listings
11.1% of total
Strict
3 listings
16.7% of total
Cancellation Policy Insights for Kalogreia
- The prevailing Airbnb cancellation policy trend in Kalogreia is Moderate, used by 55.6% of listings.
- The market strongly favors guest-friendly terms, with 72.3% of listings offering Flexible or Moderate policies. This suggests guests in Kalogreia may expect booking flexibility.
Recommendations for Hosts
- Consider adopting a Moderate policy to align with the 55.6% market standard in Kalogreia.
- Regularly review your cancellation policy against competitors and market demand shifts in Kalogreia.
Kalogreia STR Booking Lead Time Analysis (2026)
Average Booking Lead Time by Month
Booking Lead Time Insights for Kalogreia
- The overall average booking lead time for vacation rentals in Kalogreia is 26 days.
- Guests book furthest in advance for stays during August (average 58 days), likely coinciding with peak travel demand or local events.
- The shortest booking windows occur for stays in February (average 4 days), indicating more last-minute travel plans during this time.
- Seasonally, Summer (39 days avg.) sees the longest lead times, while Winter (10 days avg.) has the shortest, reflecting typical travel planning cycles.
Recommendations for Hosts
- Use the overall average lead time (26 days) as a baseline for your pricing and availability strategy in Kalogreia.
- For August stays, consider implementing length-of-stay discounts or slightly higher rates for bookings made less than 58 days out to capitalize on advance planning.
- During February, focus on last-minute booking availability and promotions, as guests book with very short notice (4 days avg.).
- Target marketing efforts for the Summer season well in advance (at least 39 days) to capture early planners.
- Monitor your own booking lead times against these Kalogreia averages to identify opportunities for dynamic pricing adjustments.
Popular & Essential Airbnb Amenities in Kalogreia (2026)
Amenity Prevalence
Amenity Insights for Kalogreia
- Essential amenities in Kalogreia that guests expect include: Kitchen, TV, Pool, Air conditioning, Free parking on premises, Washer. Lacking these (any) could significantly impact bookings.
- Popular amenities like Wifi, Beach access, Heating are common but not universal. Offering these can provide a competitive edge.
- Warning: Wifi is not universally provided but is considered essential globally. Ensure reliable Wifi is offered.
Recommendations for Hosts
- Ensure your listing includes all essential amenities for Kalogreia: Kitchen, TV, Pool, Air conditioning, Free parking on premises, Washer.
- Consider adding popular differentiators like Wifi or Beach access to increase appeal.
- Highlight unique or less common amenities you offer (e.g., hot tub, dedicated workspace, EV charger) in your listing description and photos.
- Regularly check competitor amenities in Kalogreia to stay competitive.
Kalogreia Airbnb Guest Demographics & Profile Analysis (2026)
Guest Profile Summary for Kalogreia
- The typical guest profile for Airbnb in Kalogreia consists of predominantly international visitors (100%), with top international origins including Türkiye, typically belonging to the Pre-1950s (Silent Gen) group (50%), primarily speaking English or German.
- Domestic travelers account for 0.0% of guests.
- Key international markets include Turkey (33.3%) and Türkiye (16.7%).
- Top languages spoken are English (40%) followed by German (20%).
- A significant demographic segment is the Post-2000s (Gen Z/Alpha) group, representing 50% of guests.
Recommendations for Hosts
- Focus marketing internationally, particularly towards travelers from Türkiye.
- Tailor amenities and listing descriptions to appeal to the dominant Pre-1950s (Silent Gen) demographic while maintaining broad appeal across age groups.
- Highlight unique local experiences or amenities relevant to the primary guest profile.
- Consider seasonal promotions aligned with peak travel times for key origin markets.
Nearby Short-Term Rental Market Comparison
How does the Kalogreia Airbnb market stack up against its neighbors? Compare key performance metrics like average monthly revenue, ADR, and occupancy rates in surrounding areas to understand the broader regional STR landscape.
| Market | Active Properties | Monthly Revenue | Daily Rate | Avg. Occupancy |
|---|---|---|---|---|
| Κοινότητα Κισσόνεργας | 61 | $3,019 | $329.83 | 40% |
| Yialia | 15 | $2,478 | $297.53 | 43% |
| Tsada | 15 | $2,413 | $210.08 | 51% |
| Kouklia | 98 | $2,357 | $313.09 | 40% |
| Peyia | 614 | $2,262 | $234.01 | 46% |
| Agios Athanasios | 12 | $2,180 | $166.96 | 56% |
| Pomos | 56 | $2,161 | $238.67 | 39% |
| Argaka | 50 | $2,110 | $260.98 | 45% |
| Neo Chorio | 108 | $2,009 | $242.15 | 42% |
| Κοινότητα Χλώρακα | 124 | $2,003 | $167.05 | 49% |