Nečujam Airbnb Market Analysis 2025: Short Term Rental Data & Vacation Rental Statistics in Nečujam, Croatia
Is Airbnb profitable in Nečujam in 2025? Explore comprehensive Airbnb analytics for Nečujam, Nečujam, Croatia to uncover income potential. This 2025 STR market report for Nečujam, based on AirROI data from April 2024 to March 2025, reveals key trends in the niche market of 58 active listings.
Whether you're considering an Airbnb investment in Nečujam, optimizing your existing vacation rental, or exploring rental arbitrage opportunities, understanding the Nečujam Airbnb data is crucial. Leveraging the low regulation environment is key to maximizing your short term rental income potential. Let's dive into the specifics.
Key Nečujam Airbnb Performance Metrics Overview
Monthly Airbnb Revenue Variations & Income Potential in Nečujam (2025)
Understanding the monthly revenue variations for Airbnb listings in Nečujam is key to maximizing your short term rental income potential. Seasonality significantly impacts earnings. Our analysis, based on data from the past 12 months, shows that the peak revenue month for STRs in Nečujam is typically August, while April often presents the lowest earnings, highlighting opportunities for strategic pricing adjustments during shoulder and low seasons. Explore the typical Airbnb income in Nečujam across different performance tiers:
- Best-in-class properties (Top 10%) achieve $3,403+ monthly, often utilizing dynamic pricing and superior guest experiences.
- Strong performing properties (Top 25%) earn $1,574 or more, indicating effective management and desirable locations/amenities.
- Typical properties (Median) generate around $890 per month, representing the average market performance.
- Entry-level properties (Bottom 25%) see earnings around $438, often with potential for optimization.
Average Monthly Airbnb Earnings Trend in Nečujam
Nečujam Airbnb Occupancy Rate Trends (2025)
Maximize your bookings by understanding the Nečujam STR occupancy trends. Seasonal demand shifts significantly influence how often properties are booked. Typically, Augustsees the highest demand (peak season occupancy), while April experiences the lowest (low season). Effective strategies, like adjusting minimum stays or offering promotions, can boost occupancy during slower periods. Here's how different property tiers perform in Nečujam:
- Best-in-class properties (Top 10%) achieve 61%+ occupancy, indicating high desirability and potentially optimized availability.
- Strong performing properties (Top 25%) maintain 43% or higher occupancy, suggesting good market fit and guest satisfaction.
- Typical properties (Median) have an occupancy rate around 23%.
- Entry-level properties (Bottom 25%) average 10% occupancy, potentially facing higher vacancy.
Average Monthly Occupancy Rate Trend in Nečujam
Average Daily Rate (ADR) Airbnb Trends in Nečujam (2025)
Effective short term rental pricing strategy in Nečujam involves understanding monthly ADR fluctuations. The Average Daily Rate (ADR) for Airbnb in Nečujam typically peaks in July and dips lowest during April. Leveraging Airbnb dynamic pricing tools or strategies based on this seasonality can significantly boost revenue. Here's a look at the typical nightly rates achieved:
- Best-in-class properties (Top 10%) command rates of $274+ per night, often due to premium features or locations.
- Strong performing properties (Top 25%) achieve nightly rates of $150 or more.
- Typical properties (Median) charge around $109 per night.
- Entry-level properties (Bottom 25%) earn around $82 per night.
Average Daily Rate (ADR) Trend by Month in Nečujam
Get Live Nečujam Market Intelligence 👇

Explore Real-time Analytics
Airbnb Seasonality Analysis & Trends in Nečujam (2025)
Peak Season (August, July, November)
- Revenue averages $2,373 per month
- Occupancy rates average 43.9%
- Daily rates average $152
Shoulder Season
- Revenue averages $1,407 per month
- Occupancy maintains around 26.4%
- Daily rates hold near $145
Low Season (January, February, April)
- Revenue drops to average $655 per month
- Occupancy decreases to average 19.7%
- Daily rates adjust to average $146
Seasonality Insights for Nečujam
- The Airbnb seasonality in Nečujam shows highly seasonal trends requiring careful strategy. While the sections above show seasonal averages, it's also insightful to look at the extremes:
- During the high season, the absolute peak month showcases Nečujam's highest earning potential, with monthly revenues capable of climbing to $2,668, occupancy reaching a high of 52.7%, and ADRs peaking at $153.
- Conversely, the slowest single month of the year, typically falling within the low season, marks the market's lowest point. In this month, revenue might dip to $489, occupancy could drop to 13.3%, and ADRs may adjust down to $136.
- Understanding both the seasonal averages and these monthly peaks and troughs in revenue, occupancy, and ADR is crucial for maximizing your Airbnb profit potential in Nečujam.
Seasonal Strategies for Maximizing Profit
- Peak Season: Maximize revenue through premium pricing and potentially longer minimum stays. Ensure high availability.
- Low Season: Offer competitive pricing, special promotions (e.g., extended stay discounts), and flexible cancellation policies. Target off-season travelers like remote workers or budget-conscious guests.
- Shoulder Seasons: Implement dynamic pricing that balances peak and low rates. Target weekend travelers or specific events. Offer slightly more flexible terms than peak season.
- Regularly analyze your own performance against these Nečujam seasonality benchmarks and adjust your pricing and availability strategy accordingly.
Best Areas for Airbnb Investment in Nečujam (2025)
Exploring the top neighborhoods for short-term rentals in Nečujam? This section highlights key areas, outlining why they are attractive for hosts and guests, along with notable local attractions. Consider these locations based on your target guest profile and investment strategy.
| Neighborhood / Area | Why Host Here? (Target Guests & Appeal) | Key Attractions & Landmarks |
|---|---|---|
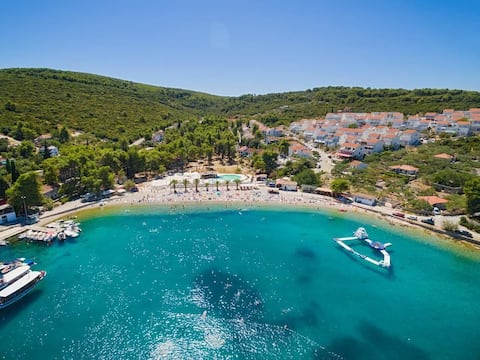
| Nečujam Beach | A beautiful beach on Solta Island, popular for its crystal clear waters and serene environment. Ideal for travelers seeking a peaceful getaway with beach access and natural beauty. | Nečujam Beach, Šuplja Stina Beach, Rogac Beach, Duga Beach, Nearby hiking trails, Local restaurants |
| Stomorska Village | A charming fishing village nearby that offers a taste of local life and culture. Great for guests interested in traditional Croatian experiences and quiet ambiance. | Stomorska Harbor, Local seafood restaurants, Cultural festivals, Nearby olive groves, Shops and markets |
| Maslinica | Known for its picturesque marina and stunning sea views, Maslinica attracts yacht enthusiasts and those looking for a scenic retreat on the Adriatic. | Maslinica Marina, Secluded coves, Historical churches, Local wineries, Water sports activities |
| Rogac | A small yet busy harbor area with ferry connections to Split, making it a convenient spot for travelers looking to explore more of Croatia while enjoying the local atmosphere. | Rogac Ferry Port, Promenade with cafes, Nearby peaceful beaches, Scenic walking paths, Access to Split |
| Grapčeva Cave | A popular tourist attraction located on the island, known for its historical significance and beautiful nature, suitable for adventure seekers and history buffs. | Grapčeva Cave, Guided tours, Nature walks, Cave exploration |
| Krknjaši | A remote beach area perfect for those seeking solitude and undisturbed natural beauty, ideal for families or couples looking for a romantic escape. | Krknjaši Beach, Clear waters, Secluded spots, Picnic areas, Nature exploration |
| Trogir | A UNESCO World Heritage site located a ferry ride away, Trogir is famed for its historic architecture and vibrant atmosphere, making it a must-visit for culture seekers. | Trogir Town Square, St. Lawrence Cathedral, Trogir Fortress, Historic Old Town, Local markets |
| Split | A larger city nearby known for its rich history and lively culture, Split is a major tourist destination that offers many sightseeing options and urban amenities. | Diocletian's Palace, Marjan Hill, Split Riva, Local restaurants and bars, Beaches |
Understanding Airbnb License Requirements & STR Laws in Nečujam (2025)
While Nečujam, Nečujam, Croatia currently shows low STR regulations, specific Airbnb license requirements might still exist or change. Always verify the latest short term rental regulations and Airbnb license requirements directly with local government authorities for Nečujam to ensure full compliance before hosting.
(Source: AirROI data, 2025, finding no licensed listings among those analyzed)
Top Performing Airbnb Properties in Nečujam (2025)
Benchmark your potential! Explore examples of top-performing Airbnb properties in Nečujambased on Trailing Twelve Month (TTM) revenue. Analyze their characteristics, revenue, occupancy rate, and ADR to understand what drives success in this market.

Villa Captain's house with heated pool, jacuzzi
Entire Place • 3 bedrooms
Villa Gabriela, Nečujam, Sholta
Entire Place • 6 bedrooms
Holiday home Ana with pool, Island Šolta
Entire Place • 2 bedrooms
VILLA IVAN WITH POOL,ISLAND ŠOLTA
Entire Place • 4 bedrooms
Necujam bay
Entire Place • 2 bedrooms
My Oasis
Entire Place • 3 bedrooms
Note: Performance varies based on location, size, amenities, seasonality, and management quality. Data reflects the past 12 months.
Top Performing Airbnb Hosts in Nečujam (2025)
Learn from the best! This table showcases top-performing Airbnb hosts in Nečujam based on the number of properties managed and estimated total revenue over the past year. Analyze their scale and performance metrics.
| Host Name | Properties | Grossing Revenue | Stay Reviews | Avg Rating |
|---|---|---|---|---|
| FERIE HOME Agency | 1 | $97,589 | 28 | 4.96/5.0 |
| Antonija | 2 | $56,916 | 50 | 4.98/5.0 |
| Sanda | 2 | $37,337 | 38 | 4.99/5.0 |
| Selma | 3 | $35,556 | 17 | 5.00/5.0 |
| Host #443060635 | 3 | $26,630 | 1 | 0.00/5.0 |
| Duško | 1 | $19,656 | 88 | 4.89/5.0 |
| Kresimir | 1 | $18,172 | 3 | 4.67/5.0 |
| Host #8383453 | 1 | $17,340 | 1 | 0.00/5.0 |
| Anja | 3 | $17,050 | 6 | 3.22/5.0 |
| Host #458538237 | 2 | $15,533 | 0 | 0.00/5.0 |
Analyzing the strategies of top hosts, such as their property selection, pricing, and guest communication, can offer valuable lessons for optimizing your own Airbnb operations in Nečujam.
Dive Deeper: Advanced Nečujam STR Market Data (2025)
Ready to unlock more insights? AirROI provides access to advanced metrics and comprehensive Airbnb data for Nečujam. Explore detailed analytics beyond this report to refine your investment strategy, optimize pricing, and maximize your vacation rental profits.
Explore Advanced MetricsNečujam Short-Term Rental Market Composition (2025): Property & Room Types
Room Type Distribution
Property Type Distribution
Market Composition Insights for Nečujam
- The Nečujam Airbnb market composition is heavily skewed towards Entire Home/Apt listings, which make up 96.6% of the 58 active rentals. This indicates strong guest preference for privacy and space.
- Looking at the property type distribution in Nečujam, Apartment/Condo properties are the most common (55.2%), reflecting the local real estate landscape.
- Houses represent a significant 37.9% portion, catering likely to families or larger groups.
- Smaller segments like unique stays (combined 1.7%) offer potential for unique stay experiences.
Nečujam Airbnb Room Capacity Analysis (2025): Bedroom Distribution
Distribution of Listings by Number of Bedrooms
Room Capacity Insights for Nečujam
- The dominant room capacity in Nečujam is 2 bedrooms listings, making up 51.7% of the market. This suggests a strong demand for properties suitable for couples or solo travelers.
- Together, 2 bedrooms and 1 bedroom properties represent 75.8% of the active Airbnb listings in Nečujam, indicating a high concentration in these sizes.
Nečujam Vacation Rental Guest Capacity Trends (2025)
Distribution of Listings by Guest Capacity
Guest Capacity Insights for Nečujam
- The most common guest capacity trend in Nečujam vacation rentals is listings accommodating 4 guests (25.9%). This suggests the primary traveler segment is likely small families or groups.
- Properties designed for 4 guests and 5 guests dominate the Nečujam STR market, accounting for 50.0% of listings.
- 31.1% of properties accommodate 6+ guests, serving the market segment for larger families or group travel in Nečujam.
- On average, properties in Nečujam are equipped to host 4.7 guests.
Nečujam Airbnb Booking Patterns (2025): Available vs. Booked Days
Available Days Distribution
Booked Days Distribution
Booking Pattern Insights for Nečujam
- The most common availability pattern in Nečujam falls within the 271-366 days range, representing 91.4% of listings. This suggests many properties have significant open periods on their calendars.
- Approximately 98.3% of listings show high availability (181+ days open annually), indicating potential for increased bookings or specific owner usage patterns.
- For booked days, the 31-90 days range is most frequent in Nečujam (56.9%), reflecting common guest stay durations or potential owner blocking patterns.
- A notable 3.4% of properties secure long booking periods (181+ days booked per year), highlighting successful long-term rental strategies or significant owner usage.
Nečujam Airbnb Minimum Stay Requirements Analysis
Distribution of Listings by Minimum Night Requirement
1 Night
3 listings
5.8% of total
3 Nights
6 listings
11.5% of total
4-6 Nights
38 listings
73.1% of total
7-29 Nights
5 listings
9.6% of total
Key Insights
- The most prevalent minimum stay requirement in Nečujam is 4-6 Nights, adopted by 73.1% of listings. This highlights the market's preference for longer commitments.
- Very short stays (1-2 nights) are less common (5.8%), suggesting hosts prefer slightly longer bookings to optimize turnover.
Recommendations
- Align with the market by considering a 4-6 Nights minimum stay, as 73.1% of Nečujam hosts use this setting.
- If feasible, allowing 1-night stays, especially midweek or during low season, could capture last-minute bookings, as only 5.8% currently do.
- Adjust minimum nights based on seasonality – potentially shorter during low season and longer during peak demand periods in Nečujam.
Nečujam Airbnb Cancellation Policy Trends Analysis (2025)
Super Strict 30 Days
3 listings
7.3% of total
Flexible
6 listings
14.6% of total
Moderate
8 listings
19.5% of total
Firm
11 listings
26.8% of total
Strict
13 listings
31.7% of total
Cancellation Policy Insights for Nečujam
- The prevailing Airbnb cancellation policy trend in Nečujam is Strict, used by 31.7% of listings.
- A majority (58.5%) of hosts in Nečujam utilize Firm or Strict policies, indicating a market where hosts prioritize booking security.
Recommendations for Hosts
- Consider adopting a Strict policy to align with the 31.7% market standard in Nečujam.
- With 31.7% using Strict terms, this is a viable option in Nečujam, particularly for high-value properties or during peak demand periods.
- Regularly review your cancellation policy against competitors and market demand shifts in Nečujam.
Nečujam STR Booking Lead Time Analysis (2025)
Average Booking Lead Time by Month
Booking Lead Time Insights for Nečujam
- The overall average booking lead time for vacation rentals in Nečujam is 78 days.
- Guests book furthest in advance for stays during November (average 100 days), likely coinciding with peak travel demand or local events.
- The shortest booking windows occur for stays in February (average 2 days), indicating more last-minute travel plans during this time.
- Seasonally, Fall (99 days avg.) sees the longest lead times, while Winter (28 days avg.) has the shortest, reflecting typical travel planning cycles.
Recommendations for Hosts
- Use the overall average lead time (78 days) as a baseline for your pricing and availability strategy in Nečujam.
- For November stays, consider implementing length-of-stay discounts or slightly higher rates for bookings made less than 100 days out to capitalize on advance planning.
- During February, focus on last-minute booking availability and promotions, as guests book with very short notice (2 days avg.).
- Target marketing efforts for the Fall season well in advance (at least 99 days) to capture early planners.
- Monitor your own booking lead times against these Nečujam averages to identify opportunities for dynamic pricing adjustments.
Popular & Essential Airbnb Amenities in Nečujam (2025)
Amenity Prevalence
Amenity Insights for Nečujam
- Essential amenities in Nečujam that guests expect include: Air conditioning. Lacking these (this) could significantly impact bookings.
- Popular amenities like Kitchen, Wifi, Hot water are common but not universal. Offering these can provide a competitive edge.
- Warning: Wifi is not universally provided but is considered essential globally. Ensure reliable Wifi is offered.
Recommendations for Hosts
- Ensure your listing includes all essential amenities for Nečujam: Air conditioning.
- Prioritize adding missing essentials: Air conditioning.
- Consider adding popular differentiators like Kitchen or Wifi to increase appeal.
- Highlight unique or less common amenities you offer (e.g., hot tub, dedicated workspace, EV charger) in your listing description and photos.
- Regularly check competitor amenities in Nečujam to stay competitive.
Nečujam Airbnb Guest Demographics & Profile Analysis (2025)
Guest Profile Summary for Nečujam
- The typical guest profile for Airbnb in Nečujam consists of predominantly international visitors (95%), with top international origins including United Kingdom, typically belonging to the Post-2000s (Gen Z/Alpha) group (50%), primarily speaking English or German.
- Domestic travelers account for 5.3% of guests.
- Key international markets include Germany (29.3%) and United Kingdom (12%).
- Top languages spoken are English (40.9%) followed by German (26.1%).
- A significant demographic segment is the Post-2000s (Gen Z/Alpha) group, representing 50% of guests.
Recommendations for Hosts
- Focus marketing internationally, particularly towards travelers from United Kingdom.
- Tailor amenities and listing descriptions to appeal to the dominant Post-2000s (Gen Z/Alpha) demographic (e.g., highlight fast WiFi, smart home features, local guides).
- Highlight unique local experiences or amenities relevant to the primary guest profile.
- Consider seasonal promotions aligned with peak travel times for key origin markets.
Nearby Short-Term Rental Market Comparison
How does the Nečujam Airbnb market stack up against its neighbors? Compare key performance metrics like average monthly revenue, ADR, and occupancy rates in surrounding areas to understand the broader regional STR landscape.
| Market | Active Properties | Monthly Revenue | Daily Rate | Avg. Occupancy |
|---|---|---|---|---|
| Dugopolje | 21 | $3,569 | $361.70 | 53% |
| Strožanac Gornji | 38 | $3,532 | $389.83 | 45% |
| Poljica Brig | 17 | $3,498 | $482.94 | 50% |
| Crno | 17 | $3,372 | $541.23 | 40% |
| Srinjine | 36 | $3,172 | $386.92 | 48% |
| Općina Klis | 87 | $2,949 | $339.82 | 54% |
| Zemunik Gornji | 11 | $2,879 | $332.51 | 45% |
| Grubine | 26 | $2,814 | $358.61 | 47% |
| Majkovi | 18 | $2,765 | $316.09 | 48% |
| Grad Solin | 214 | $2,640 | $265.51 | 49% |