Debeljuhi Airbnb Market Analysis 2025: Short Term Rental Data & Vacation Rental Statistics in Istria County, Croatia
Is Airbnb profitable in Debeljuhi in 2025? Explore comprehensive Airbnb analytics for Debeljuhi, Istria County, Croatia to uncover income potential. This 2025 STR market report for Debeljuhi, based on AirROI data from April 2024 to March 2025, reveals key trends in the niche market of 17 active listings.
Whether you're considering an Airbnb investment in Debeljuhi, optimizing your existing vacation rental, or exploring rental arbitrage opportunities, understanding the Debeljuhi Airbnb data is crucial. Leveraging the low regulation environment is key to maximizing your short term rental income potential. Let's dive into the specifics.
Key Debeljuhi Airbnb Performance Metrics Overview
Monthly Airbnb Revenue Variations & Income Potential in Debeljuhi (2025)
Understanding the monthly revenue variations for Airbnb listings in Debeljuhi is key to maximizing your short term rental income potential. Seasonality significantly impacts earnings. Our analysis, based on data from the past 12 months, shows that the peak revenue month for STRs in Debeljuhi is typically April, while January often presents the lowest earnings, highlighting opportunities for strategic pricing adjustments during shoulder and low seasons. Explore the typical Airbnb income in Debeljuhi across different performance tiers:
- Best-in-class properties (Top 10%) achieve $4,830+ monthly, often utilizing dynamic pricing and superior guest experiences.
- Strong performing properties (Top 25%) earn $4,067 or more, indicating effective management and desirable locations/amenities.
- Typical properties (Median) generate around $1,802 per month, representing the average market performance.
- Entry-level properties (Bottom 25%) see earnings around $889, often with potential for optimization.
Average Monthly Airbnb Earnings Trend in Debeljuhi
Debeljuhi Airbnb Occupancy Rate Trends (2025)
Maximize your bookings by understanding the Debeljuhi STR occupancy trends. Seasonal demand shifts significantly influence how often properties are booked. Typically, Augustsees the highest demand (peak season occupancy), while January experiences the lowest (low season). Effective strategies, like adjusting minimum stays or offering promotions, can boost occupancy during slower periods. Here's how different property tiers perform in Debeljuhi:
- Best-in-class properties (Top 10%) achieve 45%+ occupancy, indicating high desirability and potentially optimized availability.
- Strong performing properties (Top 25%) maintain 40% or higher occupancy, suggesting good market fit and guest satisfaction.
- Typical properties (Median) have an occupancy rate around 27%.
- Entry-level properties (Bottom 25%) average 17% occupancy, potentially facing higher vacancy.
Average Monthly Occupancy Rate Trend in Debeljuhi
Average Daily Rate (ADR) Airbnb Trends in Debeljuhi (2025)
Effective short term rental pricing strategy in Debeljuhi involves understanding monthly ADR fluctuations. The Average Daily Rate (ADR) for Airbnb in Debeljuhi typically peaks in April and dips lowest during May. Leveraging Airbnb dynamic pricing tools or strategies based on this seasonality can significantly boost revenue. Here's a look at the typical nightly rates achieved:
- Best-in-class properties (Top 10%) command rates of $429+ per night, often due to premium features or locations.
- Strong performing properties (Top 25%) achieve nightly rates of $277 or more.
- Typical properties (Median) charge around $222 per night.
- Entry-level properties (Bottom 25%) earn around $113 per night.
Average Daily Rate (ADR) Trend by Month in Debeljuhi
Get Live Debeljuhi Market Intelligence 👇

Explore Real-time Analytics
Airbnb Seasonality Analysis & Trends in Debeljuhi (2025)
Peak Season (April, August, July)
- Revenue averages $5,119 per month
- Occupancy rates average 43.8%
- Daily rates average $273
Shoulder Season
- Revenue averages $1,926 per month
- Occupancy maintains around 24.6%
- Daily rates hold near $231
Low Season (January, February, June)
- Revenue drops to average $597 per month
- Occupancy decreases to average 10.1%
- Daily rates adjust to average $233
Seasonality Insights for Debeljuhi
- The Airbnb seasonality in Debeljuhi shows highly seasonal trends requiring careful strategy. While the sections above show seasonal averages, it's also insightful to look at the extremes:
- During the high season, the absolute peak month showcases Debeljuhi's highest earning potential, with monthly revenues capable of climbing to $6,410, occupancy reaching a high of 61.6%, and ADRs peaking at $342.
- Conversely, the slowest single month of the year, typically falling within the low season, marks the market's lowest point. In this month, revenue might dip to $0, occupancy could drop to 0.0%, and ADRs may adjust down to $225.
- Understanding both the seasonal averages and these monthly peaks and troughs in revenue, occupancy, and ADR is crucial for maximizing your Airbnb profit potential in Debeljuhi.
Seasonal Strategies for Maximizing Profit
- Peak Season: Maximize revenue through premium pricing and potentially longer minimum stays. Ensure high availability.
- Low Season: Offer competitive pricing, special promotions (e.g., extended stay discounts), and flexible cancellation policies. Target off-season travelers like remote workers or budget-conscious guests.
- Shoulder Seasons: Implement dynamic pricing that balances peak and low rates. Target weekend travelers or specific events. Offer slightly more flexible terms than peak season.
- Regularly analyze your own performance against these Debeljuhi seasonality benchmarks and adjust your pricing and availability strategy accordingly.
Best Areas for Airbnb Investment in Debeljuhi (2025)
Exploring the top neighborhoods for short-term rentals in Debeljuhi? This section highlights key areas, outlining why they are attractive for hosts and guests, along with notable local attractions. Consider these locations based on your target guest profile and investment strategy.
| Neighborhood / Area | Why Host Here? (Target Guests & Appeal) | Key Attractions & Landmarks |
|---|---|---|
| Pula | The largest city in Istria, known for its well-preserved Roman architecture and vibrant cultural scene. It draws tourists interested in history, art, and Mediterranean lifestyle. | Pula Arena, Temple of Augustus, Pula Fortress, Brijuni National Park, Pula Aquarium, Historical Museum of Istria |
| Rovinj | A picturesque coastal town famous for its charming old town, cuisine, and beautiful beaches. Popular for romantic getaways and cultural experiences. | Rovinj Old Town, St. Euphemia's Church, Golden Cape Forest Park, Rovinj Aquarium, Batana Eco-Museum, Puntizela Beach |
| Medulin | A popular resort town known for its stunning beaches and family-friendly activities. Great for beachgoers and those looking for a laid-back atmosphere. | Medulin Beach, Bijeca Beach, Premantura Nature Park, Cape Kamenjak, Medulin Village, Kamenjak Beach |
| Labin | A historic town perched on a hill, known for its artistic community and medieval charm. Ideal for tourists interested in art, history, and local culture. | Labin Old Town, Frata's Gallery, Tito's Square, Kvarner Bay, Labin Art Gallery, Historical Museum |
| Brtonigla | A small town in Istria known for its vineyards and olive groves, perfect for culinary tourism and artistic retreats. | Aquapark Istralandia, Wine Tasting Tours, Baredine Cave, Parenzana Cycling Trail, Local Olive Oil Producers, Gastronomy Events |
| Bale | A quaint village with a rich history and beautiful landscapes. Attracts visitors looking for a peaceful retreat away from the bustling tourist centers. | Castle of Soardo-Bembo, Church of St. Julian, Bale's Stone Town, Exhibition Space, Nature Trails, Cultural Events |
| Fazana | A small fishing village known for its seafood and proximity to Brijuni Islands. Popular with visitors seeking authentic Croatian culture and natural beauty. | Brijuni Islands National Park, Fazana Beach, Fisherman's Market, Local Seafood Restaurants, St. Mary's Church, Walkways along the coast |
| Istria Wine Road | Known for its vineyards and wine production, this area attracts wine lovers and those interested in agritourism and rural experiences. | Wine Tasting Tours, St. Anthony's Chapel, Local Vineyards, Truffles Hunting, Food & Wine Festivals, Agricultural Museums |
Understanding Airbnb License Requirements & STR Laws in Debeljuhi (2025)
While Debeljuhi, Istria County, Croatia currently shows low STR regulations, specific Airbnb license requirements might still exist or change. Always verify the latest short term rental regulations and Airbnb license requirements directly with local government authorities for Debeljuhi to ensure full compliance before hosting.
(Source: AirROI data, 2025, finding no licensed listings among those analyzed)
Top Performing Airbnb Properties in Debeljuhi (2025)
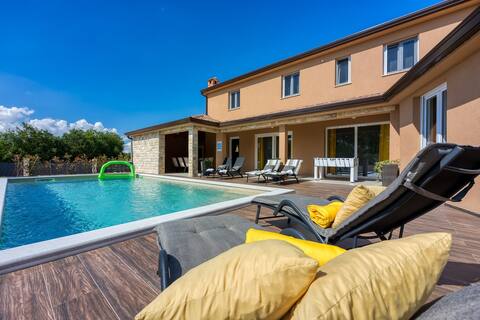
Benchmark your potential! Explore examples of top-performing Airbnb properties in Debeljuhibased on Trailing Twelve Month (TTM) revenue. Analyze their characteristics, revenue, occupancy rate, and ADR to understand what drives success in this market.

Holiday home fradelani with private pool
Entire Place • 4 bedrooms
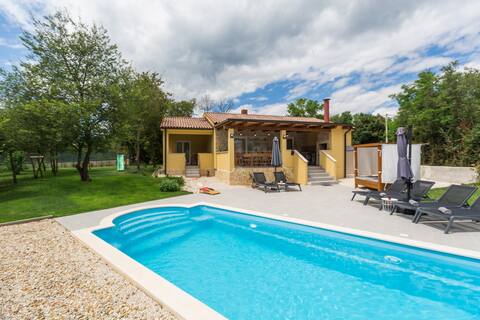
Villa Perla Spa
Entire Place • 4 bedrooms
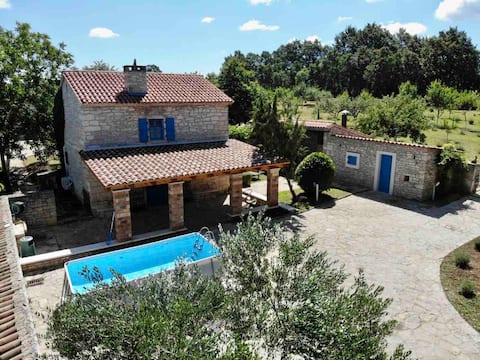
Villa Savey (heated pool)
Entire Place • 3 bedrooms
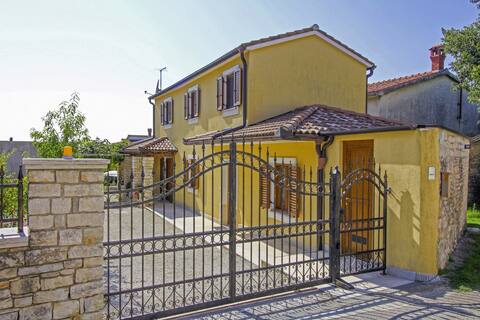
Kuća Dani
Entire Place • 2 bedrooms

Your Second Home near Rovinj/Istria
Entire Place • 4 bedrooms
Alena in Debeljuhi (house for 4 people)
Entire Place • 2 bedrooms
Note: Performance varies based on location, size, amenities, seasonality, and management quality. Data reflects the past 12 months.
Top Performing Airbnb Hosts in Debeljuhi (2025)
Learn from the best! This table showcases top-performing Airbnb hosts in Debeljuhi based on the number of properties managed and estimated total revenue over the past year. Analyze their scale and performance metrics.
| Host Name | Properties | Grossing Revenue | Stay Reviews | Avg Rating |
|---|---|---|---|---|
| Rosana | 3 | $70,006 | 12 | 4.92/5.0 |
| Sandro | 1 | $23,394 | 3 | 5.00/5.0 |
| Ana | 1 | $19,759 | 6 | 4.83/5.0 |
| Mihaela | 1 | $15,610 | 48 | 4.90/5.0 |
| ID Riva Tours | 1 | $14,420 | 8 | 5.00/5.0 |
| Ranka | 1 | $13,028 | 22 | 4.95/5.0 |
| Zahra | 4 | $12,687 | 67 | 4.79/5.0 |
| Host #154045024 | 1 | $10,600 | 0 | 0.00/5.0 |
| Dušan | 1 | $9,228 | 17 | 4.94/5.0 |
| Host #141524509 | 1 | $3,244 | 0 | 0.00/5.0 |
Analyzing the strategies of top hosts, such as their property selection, pricing, and guest communication, can offer valuable lessons for optimizing your own Airbnb operations in Debeljuhi.
Dive Deeper: Advanced Debeljuhi STR Market Data (2025)
Ready to unlock more insights? AirROI provides access to advanced metrics and comprehensive Airbnb data for Debeljuhi. Explore detailed analytics beyond this report to refine your investment strategy, optimize pricing, and maximize your vacation rental profits.
Explore Advanced MetricsDebeljuhi Short-Term Rental Market Composition (2025): Property & Room Types
Room Type Distribution
Property Type Distribution
Market Composition Insights for Debeljuhi
- The Debeljuhi Airbnb market composition is heavily skewed towards Entire Home/Apt listings, which make up 100% of the 17 active rentals. This indicates strong guest preference for privacy and space.
- Looking at the property type distribution in Debeljuhi, House properties are the most common (100%), reflecting the local real estate landscape.
- Houses represent a significant 100% portion, catering likely to families or larger groups.
Debeljuhi Airbnb Room Capacity Analysis (2025): Bedroom Distribution
Distribution of Listings by Number of Bedrooms
Room Capacity Insights for Debeljuhi
- The dominant room capacity in Debeljuhi is 3 bedrooms listings, making up 35.3% of the market. This suggests a strong demand for properties suitable for families or small groups.
- Together, 3 bedrooms and 4 bedrooms properties represent 64.7% of the active Airbnb listings in Debeljuhi, indicating a high concentration in these sizes.
- A significant 64.7% of listings offer 3+ bedrooms, catering to larger groups and families seeking more space in Debeljuhi.
Debeljuhi Vacation Rental Guest Capacity Trends (2025)
Distribution of Listings by Guest Capacity
Guest Capacity Insights for Debeljuhi
- The most common guest capacity trend in Debeljuhi vacation rentals is listings accommodating 8+ guests (35.3%). This suggests the primary traveler segment is likely larger groups.
- Properties designed for 8+ guests and 6 guests dominate the Debeljuhi STR market, accounting for 64.7% of listings.
- 70.6% of properties accommodate 6+ guests, serving the market segment for larger families or group travel in Debeljuhi.
- On average, properties in Debeljuhi are equipped to host 6.1 guests.
Debeljuhi Airbnb Booking Patterns (2025): Available vs. Booked Days
Available Days Distribution
Booked Days Distribution
Booking Pattern Insights for Debeljuhi
- The most common availability pattern in Debeljuhi falls within the 271-366 days range, representing 94.1% of listings. This suggests many properties have significant open periods on their calendars.
- Approximately 100.0% of listings show high availability (181+ days open annually), indicating potential for increased bookings or specific owner usage patterns.
- For booked days, the 31-90 days range is most frequent in Debeljuhi (47.1%), reflecting common guest stay durations or potential owner blocking patterns.
Debeljuhi Airbnb Minimum Stay Requirements Analysis
Distribution of Listings by Minimum Night Requirement
1 Night
1 listings
6.3% of total
2 Nights
1 listings
6.3% of total
4-6 Nights
10 listings
62.5% of total
7-29 Nights
3 listings
18.8% of total
30+ Nights
1 listings
6.3% of total
Key Insights
- The most prevalent minimum stay requirement in Debeljuhi is 4-6 Nights, adopted by 62.5% of listings. This highlights the market's preference for longer commitments.
- Very short stays (1-2 nights) are less common (12.6%), suggesting hosts prefer slightly longer bookings to optimize turnover.
Recommendations
- Align with the market by considering a 4-6 Nights minimum stay, as 62.5% of Debeljuhi hosts use this setting.
- If feasible, allowing 1-night stays, especially midweek or during low season, could capture last-minute bookings, as only 6.3% currently do.
- Explore offering discounts for stays of 30+ nights to attract the 6.3% of the market seeking extended stays.
- Adjust minimum nights based on seasonality – potentially shorter during low season and longer during peak demand periods in Debeljuhi.
Debeljuhi Airbnb Cancellation Policy Trends Analysis (2025)
Super Strict 30 Days
4 listings
30.8% of total
Moderate
1 listings
7.7% of total
Firm
2 listings
15.4% of total
Strict
6 listings
46.2% of total
Cancellation Policy Insights for Debeljuhi
- The prevailing Airbnb cancellation policy trend in Debeljuhi is Strict, used by 46.2% of listings.
- A majority (61.6%) of hosts in Debeljuhi utilize Firm or Strict policies, indicating a market where hosts prioritize booking security.
Recommendations for Hosts
- Consider adopting a Strict policy to align with the 46.2% market standard in Debeljuhi.
- With 46.2% using Strict terms, this is a viable option in Debeljuhi, particularly for high-value properties or during peak demand periods.
- Regularly review your cancellation policy against competitors and market demand shifts in Debeljuhi.
Debeljuhi STR Booking Lead Time Analysis (2025)
Average Booking Lead Time by Month
Booking Lead Time Insights for Debeljuhi
- The overall average booking lead time for vacation rentals in Debeljuhi is 83 days.
- Guests book furthest in advance for stays during April (average 196 days), likely coinciding with peak travel demand or local events.
- The shortest booking windows occur for stays in February (average 0 days), indicating more last-minute travel plans during this time.
- Seasonally, Spring (93 days avg.) sees the longest lead times, while Winter (37 days avg.) has the shortest, reflecting typical travel planning cycles.
Recommendations for Hosts
- Use the overall average lead time (83 days) as a baseline for your pricing and availability strategy in Debeljuhi.
- For April stays, consider implementing length-of-stay discounts or slightly higher rates for bookings made less than 196 days out to capitalize on advance planning.
- During February, focus on last-minute booking availability and promotions, as guests book with very short notice (0 days avg.).
- Target marketing efforts for the Spring season well in advance (at least 93 days) to capture early planners.
- Monitor your own booking lead times against these Debeljuhi averages to identify opportunities for dynamic pricing adjustments.
Popular & Essential Airbnb Amenities in Debeljuhi (2025)
Amenity Prevalence
Amenity Insights for Debeljuhi
- Essential amenities in Debeljuhi that guests expect include: Wifi, Free parking on premises, Kitchen. Lacking these (any) could significantly impact bookings.
- Popular amenities like Cooking basics, Essentials, Hair dryer are common but not universal. Offering these can provide a competitive edge.
Recommendations for Hosts
- Ensure your listing includes all essential amenities for Debeljuhi: Wifi, Free parking on premises, Kitchen.
- Consider adding popular differentiators like Cooking basics or Essentials to increase appeal.
- Highlight unique or less common amenities you offer (e.g., hot tub, dedicated workspace, EV charger) in your listing description and photos.
- Regularly check competitor amenities in Debeljuhi to stay competitive.
Debeljuhi Airbnb Guest Demographics & Profile Analysis (2025)
Guest Profile Summary for Debeljuhi
- The typical guest profile for Airbnb in Debeljuhi consists of predominantly international visitors (100%), with top international origins including United Kingdom, typically belonging to the Post-2000s (Gen Z/Alpha) group (50%), primarily speaking English or French.
- Domestic travelers account for 0.0% of guests.
- Key international markets include Germany (38.5%) and United Kingdom (19.2%).
- Top languages spoken are English (31.3%) followed by French (21.9%).
- A significant demographic segment is the Post-2000s (Gen Z/Alpha) group, representing 50% of guests.
Recommendations for Hosts
- Focus marketing internationally, particularly towards travelers from United Kingdom.
- Tailor amenities and listing descriptions to appeal to the dominant Post-2000s (Gen Z/Alpha) demographic (e.g., highlight fast WiFi, smart home features, local guides).
- Highlight unique local experiences or amenities relevant to the primary guest profile.
- Consider seasonal promotions aligned with peak travel times for key origin markets.
Nearby Short-Term Rental Market Comparison
How does the Debeljuhi Airbnb market stack up against its neighbors? Compare key performance metrics like average monthly revenue, ADR, and occupancy rates in surrounding areas to understand the broader regional STR landscape.
| Market | Active Properties | Monthly Revenue | Daily Rate | Avg. Occupancy |
|---|---|---|---|---|
| Selina | 14 | $4,330 | $440.33 | 47% |
| Cortina d'Ampezzo | 265 | $3,522 | $379.53 | 43% |
| Venice | 6,405 | $3,454 | $238.80 | 53% |
| Podhom | 10 | $2,849 | $196.30 | 50% |
| Colle Santa Lucia | 16 | $2,841 | $187.59 | 47% |
| Rojnići | 13 | $2,827 | $244.42 | 48% |
| Welsberg-Taisten - Monguelfo-Tesido | 27 | $2,749 | $252.33 | 48% |
| Bad Sankt Leonhard im Lavanttal | 27 | $2,745 | $266.48 | 39% |
| Sveti Petar u Šumi | 42 | $2,737 | $316.96 | 45% |
| Brajkovići | 17 | $2,712 | $408.86 | 43% |