Santa Ana Airbnb Market Analysis 2026: Short Term Rental Data & Vacation Rental Statistics in San Jose Province, Costa Rica
Is Airbnb profitable in Santa Ana in 2026? Explore comprehensive Airbnb analytics for Santa Ana, San Jose Province, Costa Rica to uncover income potential. This 2026 STR market report for Santa Ana, based on AirROI data from February 2025 to January 2026, reveals key trends in the niche market of 58 active listings.
Whether you're considering an Airbnb investment in Santa Ana, optimizing your existing vacation rental, or exploring rental arbitrage opportunities, understanding the Santa Ana Airbnb data is crucial. Leveraging the low regulation environment is key to maximizing your short term rental income potential. Let's dive into the specifics.
Key Santa Ana Airbnb Performance Metrics Overview
Monthly Airbnb Revenue Variations & Income Potential in Santa Ana (2026)
Understanding the monthly revenue variations for Airbnb listings in Santa Ana is key to maximizing your short term rental income potential. Seasonality significantly impacts earnings. Our analysis, based on data from the past 12 months, shows that the peak revenue month for STRs in Santa Ana is typically December, while September often presents the lowest earnings, highlighting opportunities for strategic pricing adjustments during shoulder and low seasons. Explore the typical Airbnb income in Santa Ana across different performance tiers:
- Best-in-class properties (Top 10%) achieve $2,812+ monthly, often utilizing dynamic pricing and superior guest experiences.
- Strong performing properties (Top 25%) earn $1,756 or more, indicating effective management and desirable locations/amenities.
- Typical properties (Median) generate around $1,019 per month, representing the average market performance.
- Entry-level properties (Bottom 25%) see earnings around $444, often with potential for optimization.
Average Monthly Airbnb Earnings Trend in Santa Ana
Santa Ana Airbnb Occupancy Rate Trends (2026)
Maximize your bookings by understanding the Santa Ana STR occupancy trends. Seasonal demand shifts significantly influence how often properties are booked. Typically, Marchsees the highest demand (peak season occupancy), while September experiences the lowest (low season). Effective strategies, like adjusting minimum stays or offering promotions, can boost occupancy during slower periods. Here's how different property tiers perform in Santa Ana:
- Best-in-class properties (Top 10%) achieve 83%+ occupancy, indicating high desirability and potentially optimized availability.
- Strong performing properties (Top 25%) maintain 68% or higher occupancy, suggesting good market fit and guest satisfaction.
- Typical properties (Median) have an occupancy rate around 45%.
- Entry-level properties (Bottom 25%) average 22% occupancy, potentially facing higher vacancy.
Average Monthly Occupancy Rate Trend in Santa Ana
Average Daily Rate (ADR) Airbnb Trends in Santa Ana (2026)
Effective short term rental pricing strategy in Santa Ana involves understanding monthly ADR fluctuations. The Average Daily Rate (ADR) for Airbnb in Santa Ana typically peaks in February and dips lowest during September. Leveraging Airbnb dynamic pricing tools or strategies based on this seasonality can significantly boost revenue. Here's a look at the typical nightly rates achieved:
- Best-in-class properties (Top 10%) command rates of $167+ per night, often due to premium features or locations.
- Strong performing properties (Top 25%) achieve nightly rates of $100 or more.
- Typical properties (Median) charge around $70 per night.
- Entry-level properties (Bottom 25%) earn around $53 per night.
Average Daily Rate (ADR) Trend by Month in Santa Ana
Get Live Santa Ana Market Intelligence 👇

Explore Real-time Analytics
Airbnb Seasonality Analysis & Trends in Santa Ana (2026)
Peak Season (December, March, June)
- Revenue averages $1,822 per month
- Occupancy rates average 49.9%
- Daily rates average $111
Shoulder Season
- Revenue averages $1,593 per month
- Occupancy maintains around 47.0%
- Daily rates hold near $110
Low Season (August, September, October)
- Revenue drops to average $1,285 per month
- Occupancy decreases to average 40.1%
- Daily rates adjust to average $101
Seasonality Insights for Santa Ana
- The Airbnb seasonality in Santa Ana shows moderate seasonality with distinct peak and low periods. While the sections above show seasonal averages, it's also insightful to look at the extremes:
- During the high season, the absolute peak month showcases Santa Ana's highest earning potential, with monthly revenues capable of climbing to $1,885, occupancy reaching a high of 56.8%, and ADRs peaking at $116.
- Conversely, the slowest single month of the year, typically falling within the low season, marks the market's lowest point. In this month, revenue might dip to $1,149, occupancy could drop to 39.1%, and ADRs may adjust down to $95.
- Understanding both the seasonal averages and these monthly peaks and troughs in revenue, occupancy, and ADR is crucial for maximizing your Airbnb profit potential in Santa Ana.
Seasonal Strategies for Maximizing Profit
- Peak Season: Maximize revenue through premium pricing and potentially longer minimum stays. Ensure high availability.
- Low Season: Offer competitive pricing, special promotions (e.g., extended stay discounts), and flexible cancellation policies. Target off-season travelers like remote workers or budget-conscious guests.
- Shoulder Seasons: Implement dynamic pricing that balances peak and low rates. Target weekend travelers or specific events. Offer slightly more flexible terms than peak season.
- Regularly analyze your own performance against these Santa Ana seasonality benchmarks and adjust your pricing and availability strategy accordingly.
Best Areas for Airbnb Investment in Santa Ana (2026)
Exploring the top neighborhoods for short-term rentals in Santa Ana? This section highlights key areas, outlining why they are attractive for hosts and guests, along with notable local attractions. Consider these locations based on your target guest profile and investment strategy.
| Neighborhood / Area | Why Host Here? (Target Guests & Appeal) | Key Attractions & Landmarks |
|---|---|---|
| Downtown Santa Ana | Cultural and economic hub of Santa Ana with easy access to attractions, restaurants, and government buildings. Ideal for both business travelers and tourists looking to explore the city. | Parque Central de Santa Ana, Museo de Artes, Catedral de Santa Ana, Teatro Municipal, Local cafes and restaurants |
| Santa Ana Mountains | Nature lovers will appreciate the access to beautiful hiking trails and panoramic views. A serene environment for guests seeking relaxation and outdoor adventures. | Hiking trails, Nature reserves, Bird watching, Scenic viewpoints, Camping sites |
| Escazu | A prosperous suburb close to Santa Ana known for its expat community, upscale shopping, and dining options. Attractive for visitors looking for a blend of urban and suburban living. | Multiplaza Escazu, Culinary schools, Fine dining restaurants, Cafes and shops, Cultural events |
| San José | While slightly further away, the capital city offers rich cultural experiences, historical sites, and vibrant nightlife, making it a desirable location for guests seeking a city experience. | Teatro Nacional, Museo del Oro, Mercado Central, Barrio Amón, Cultural festivals |
| Los Arcos | A tranquil residential area known for its family-friendly environment and close-knit community, great for guests looking for a peaceful stay. | Local parks, Community events, Grocery stores, Family restaurants, Quiet neighborhoods |
| La Sabana | A large urban park in San Jose, popular among locals for recreation and relaxation. Good for guests who enjoy outdoor activities. | Parque La Sabana, Museo de Arte Costarricense, Running and walking trails, Open-air sports, Cafes around the park |
| Tibás | A neighborhood that is increasingly popular among tourists for its affordability and proximity to central San José. Attracts visitors looking for budget options with local experiences. | Local markets, Cultural workshops, Community events, Sporting events, Close to downtown |
| Alajuela | Just a short drive from Santa Ana, Alajuela is known for its historical significance and natural beauty, attractive for those interested in Costa Rican history and nature. | Juan Santamaría International Airport, Museo Histórico Cultural Juan Santamaría, Poás Volcano, Coffee plantations, Natural reserves |
Understanding Airbnb License Requirements & STR Laws in Santa Ana (2026)
While Santa Ana, San Jose Province, Costa Rica currently shows low STR regulations, specific Airbnb license requirements might still exist or change. Always verify the latest short term rental regulations and Airbnb license requirements directly with local government authorities for Santa Ana to ensure full compliance before hosting.
(Source: AirROI data, 2026, finding no licensed listings among those analyzed)
Top Performing Airbnb Properties in Santa Ana (2026)
Benchmark your potential! Explore examples of top-performing Airbnb properties in Santa Anabased on Trailing Twelve Month (TTM) revenue. Analyze their characteristics, revenue, occupancy rate, and ADR to understand what drives success in this market.
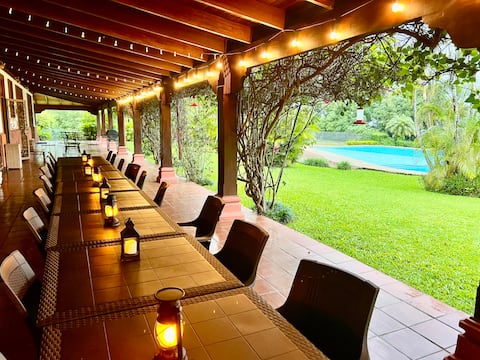
8BR Hacienda near SJO • Corporate & Yoga Retreats
Entire Place • 8 bedrooms
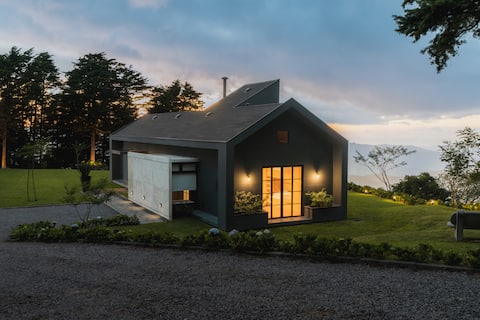
Family-Friendly Mountain Farm Stay with Animals
Entire Place • 2 bedrooms
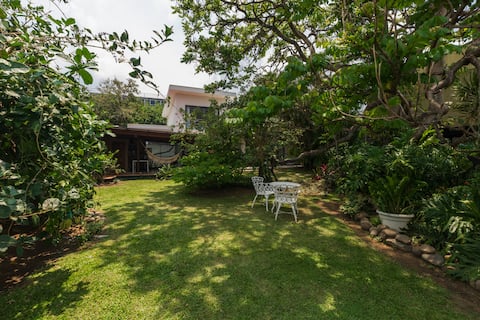
Modern house, Lush Garden in the heart of the city
Entire Place • 2 bedrooms

Contemporary 3-BR Condo with Pool|Gym|AC King Bed
Entire Place • 3 bedrooms
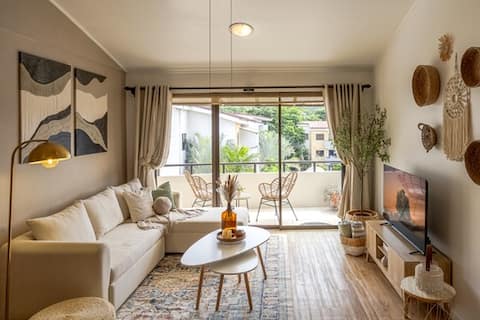
Upscale Bohemian Oasis in San José
Entire Place • 2 bedrooms

River view apartment, spacious & central /condo
Entire Place • 2 bedrooms
Note: Performance varies based on location, size, amenities, seasonality, and management quality. Data reflects the past 12 months.
Top Performing Airbnb Hosts in Santa Ana (2026)
Learn from the best! This table showcases top-performing Airbnb hosts in Santa Ana based on the number of properties managed and estimated total revenue over the past year. Analyze their scale and performance metrics.
| Host Name | Properties | Grossing Revenue | Stay Reviews | Avg Rating |
|---|---|---|---|---|
| Pia | 1 | $139,571 | 37 | 4.97/5.0 |
| Bruno | 1 | $108,671 | 180 | 4.97/5.0 |
| Yair | 2 | $54,549 | 116 | 4.86/5.0 |
| Evelin | 3 | $48,846 | 208 | 4.93/5.0 |
| Katarzyna | 2 | $39,057 | 44 | 4.96/5.0 |
| Bernardo | 1 | $29,082 | 58 | 4.93/5.0 |
| Marlon | 1 | $28,187 | 82 | 4.96/5.0 |
| Maria Del Pilar | 2 | $26,207 | 576 | 4.80/5.0 |
| Luca | 2 | $24,117 | 59 | 4.91/5.0 |
| Wanda | 1 | $20,411 | 141 | 4.91/5.0 |
Analyzing the strategies of top hosts, such as their property selection, pricing, and guest communication, can offer valuable lessons for optimizing your own Airbnb operations in Santa Ana.
Dive Deeper: Advanced Santa Ana STR Market Data (2026)
Ready to unlock more insights? AirROI provides access to advanced metrics and comprehensive Airbnb data for Santa Ana. Explore detailed analytics beyond this report to refine your investment strategy, optimize pricing, and maximize your vacation rental profits.
Explore Advanced MetricsSanta Ana Short-Term Rental Market Composition (2026): Property & Room Types
Room Type Distribution
Property Type Distribution
Market Composition Insights for Santa Ana
- The Santa Ana Airbnb market composition is heavily skewed towards Entire Home/Apt listings, which make up 77.6% of the 58 active rentals. This indicates strong guest preference for privacy and space.
- Looking at the property type distribution in Santa Ana, Apartment/Condo properties are the most common (72.4%), reflecting the local real estate landscape.
- The presence of 12.1% Hotel/Boutique listings indicates integration with traditional hospitality.
- Smaller segments like others, outdoor/unique (combined 5.1%) offer potential for unique stay experiences.
Santa Ana Airbnb Room Capacity Analysis (2026): Bedroom Distribution
Distribution of Listings by Number of Bedrooms
Room Capacity Insights for Santa Ana
- The dominant room capacity in Santa Ana is 1 bedroom listings, making up 51.7% of the market. This suggests a strong demand for properties suitable for couples or solo travelers.
- Together, 1 bedroom and 2 bedrooms properties represent 82.7% of the active Airbnb listings in Santa Ana, indicating a high concentration in these sizes.
- With over half the market (51.7%) consisting of studios or 1-bedroom units, Santa Ana is particularly well-suited for individuals or couples.
- Listings with 3+ bedrooms (6.9%) represent a smaller niche, potentially indicating an underserved market for larger group accommodations in Santa Ana.
Santa Ana Vacation Rental Guest Capacity Trends (2026)
Distribution of Listings by Guest Capacity
Guest Capacity Insights for Santa Ana
- The most common guest capacity trend in Santa Ana vacation rentals is listings accommodating 4 guests (32.8%). This suggests the primary traveler segment is likely small families or groups.
- Properties designed for 4 guests and 2 guests dominate the Santa Ana STR market, accounting for 53.5% of listings.
- 12.0% of properties accommodate 6+ guests, serving the market segment for larger families or group travel in Santa Ana.
- On average, properties in Santa Ana are equipped to host 3.2 guests.
Santa Ana Airbnb Booking Patterns (2026): Available vs. Booked Days
Available Days Distribution
Booked Days Distribution
Booking Pattern Insights for Santa Ana
- The most common availability pattern in Santa Ana falls within the 271-366 days range, representing 37.9% of listings. This suggests many properties have significant open periods on their calendars.
- Approximately 70.7% of listings show high availability (181+ days open annually), indicating potential for increased bookings or specific owner usage patterns.
- For booked days, the 91-180 days range is most frequent in Santa Ana (34.5%), reflecting common guest stay durations or potential owner blocking patterns.
- A notable 29.3% of properties secure long booking periods (181+ days booked per year), highlighting successful long-term rental strategies or significant owner usage.
Santa Ana Airbnb Minimum Stay Requirements Analysis
Distribution of Listings by Minimum Night Requirement
1 Night
27 listings
46.6% of total
2 Nights
12 listings
20.7% of total
3 Nights
6 listings
10.3% of total
4-6 Nights
5 listings
8.6% of total
30+ Nights
8 listings
13.8% of total
Key Insights
- The most prevalent minimum stay requirement in Santa Ana is 1 Night, adopted by 46.6% of listings. This highlights the market's preference for shorter, flexible bookings.
- A strong majority (67.3%) of the Santa Ana Airbnb data shows acceptance of very short stays (1-2 nights), indicating a dynamic, high-turnover market.
- A significant segment (13.8%) caters to monthly stays (30+ nights) in Santa Ana, pointing to opportunities in the extended-stay market.
Recommendations
- Align with the market by considering a 1 Night minimum stay, as 46.6% of Santa Ana hosts use this setting.
- Explore offering discounts for stays of 30+ nights to attract the 13.8% of the market seeking extended stays.
- Adjust minimum nights based on seasonality – potentially shorter during low season and longer during peak demand periods in Santa Ana.
Santa Ana Airbnb Cancellation Policy Trends Analysis (2026)
Flexible
15 listings
25.9% of total
Moderate
26 listings
44.8% of total
Firm
14 listings
24.1% of total
Strict
3 listings
5.2% of total
Cancellation Policy Insights for Santa Ana
- The prevailing Airbnb cancellation policy trend in Santa Ana is Moderate, used by 44.8% of listings.
- The market strongly favors guest-friendly terms, with 70.7% of listings offering Flexible or Moderate policies. This suggests guests in Santa Ana may expect booking flexibility.
- Strict cancellation policies are quite rare (5.2%), potentially making listings with this policy less competitive unless justified by high demand or property type.
Recommendations for Hosts
- Consider adopting a Moderate policy to align with the 44.8% market standard in Santa Ana.
- Using a Strict policy might deter some guests, as only 5.2% of listings use it. Evaluate if potential revenue protection outweighs possible lower booking rates.
- Regularly review your cancellation policy against competitors and market demand shifts in Santa Ana.
Santa Ana STR Booking Lead Time Analysis (2026)
Average Booking Lead Time by Month
Booking Lead Time Insights for Santa Ana
- The overall average booking lead time for vacation rentals in Santa Ana is 37 days.
- Guests book furthest in advance for stays during February (average 53 days), likely coinciding with peak travel demand or local events.
- The shortest booking windows occur for stays in June (average 22 days), indicating more last-minute travel plans during this time.
- Seasonally, Winter (51 days avg.) sees the longest lead times, while Summer (32 days avg.) has the shortest, reflecting typical travel planning cycles.
Recommendations for Hosts
- Use the overall average lead time (37 days) as a baseline for your pricing and availability strategy in Santa Ana.
- For February stays, consider implementing length-of-stay discounts or slightly higher rates for bookings made less than 53 days out to capitalize on advance planning.
- Target marketing efforts for the Winter season well in advance (at least 51 days) to capture early planners.
- Monitor your own booking lead times against these Santa Ana averages to identify opportunities for dynamic pricing adjustments.
Popular & Essential Airbnb Amenities in Santa Ana (2026)
Amenity Prevalence
Amenity Insights for Santa Ana
- Essential amenities in Santa Ana that guests expect include: Wifi. Lacking these (this) could significantly impact bookings.
- Popular amenities like TV, Free parking on premises, Washer are common but not universal. Offering these can provide a competitive edge.
Recommendations for Hosts
- Ensure your listing includes all essential amenities for Santa Ana: Wifi.
- Prioritize adding missing essentials: Wifi.
- Consider adding popular differentiators like TV or Free parking on premises to increase appeal.
- Highlight unique or less common amenities you offer (e.g., hot tub, dedicated workspace, EV charger) in your listing description and photos.
- Regularly check competitor amenities in Santa Ana to stay competitive.
Santa Ana Airbnb Guest Demographics & Profile Analysis (2026)
Guest Profile Summary for Santa Ana
- The typical guest profile for Airbnb in Santa Ana consists of predominantly international visitors (71%), with top international origins including Costa Rica, typically belonging to the Post-2000s (Gen Z/Alpha) group (50%), primarily speaking English or Spanish.
- Domestic travelers account for 29.0% of guests.
- Key international markets include United States (40.3%) and Costa Rica (29%).
- Top languages spoken are English (43%) followed by Spanish (34.6%).
- A significant demographic segment is the Post-2000s (Gen Z/Alpha) group, representing 50% of guests.
Recommendations for Hosts
- Focus marketing internationally, particularly towards travelers from Costa Rica.
- Tailor amenities and listing descriptions to appeal to the dominant Post-2000s (Gen Z/Alpha) demographic (e.g., highlight fast WiFi, smart home features, local guides).
- Highlight unique local experiences or amenities relevant to the primary guest profile.
- Consider seasonal promotions aligned with peak travel times for key origin markets.
Nearby Short-Term Rental Market Comparison
How does the Santa Ana Airbnb market stack up against its neighbors? Compare key performance metrics like average monthly revenue, ADR, and occupancy rates in surrounding areas to understand the broader regional STR landscape.
| Market | Active Properties | Monthly Revenue | Daily Rate | Avg. Occupancy |
|---|---|---|---|---|
| Nacascolo | 32 | $6,132 | $1145.14 | 33% |
| Pinilla | 91 | $4,982 | $544.03 | 35% |
| Playa Tamarindo | 21 | $4,869 | $404.48 | 44% |
| Playa Langosta | 163 | $4,380 | $474.00 | 39% |
| Punta Islita | 27 | $4,193 | $518.64 | 36% |
| Tamarindo | 1,302 | $3,897 | $386.82 | 41% |
| Osa | 10 | $3,418 | $586.45 | 32% |
| Cabo Velas | 922 | $3,316 | $381.01 | 38% |
| Playa Grande | 33 | $3,195 | $397.35 | 40% |
| Nosara | 873 | $3,169 | $421.13 | 39% |